Experiments
Contents
Beauveria bassiana
We did some research on Beavearia bassiana fungus because it's an entomopathogenic fungus used during years in agriculture, especially in Canada. [1]
So, we wanted to use this fungus to fight bed bugs which invade our homes. We selected and bought a Beauveria sample.
Growing Beauveria bassiana
First of all, we grew Beauveria bassiana fungus on three different kind of culture medium :
- LB with an antibiotic Cm50
- Sabouraud with Cm 50
- Sabouraud with collagen and Cm 50 [2]
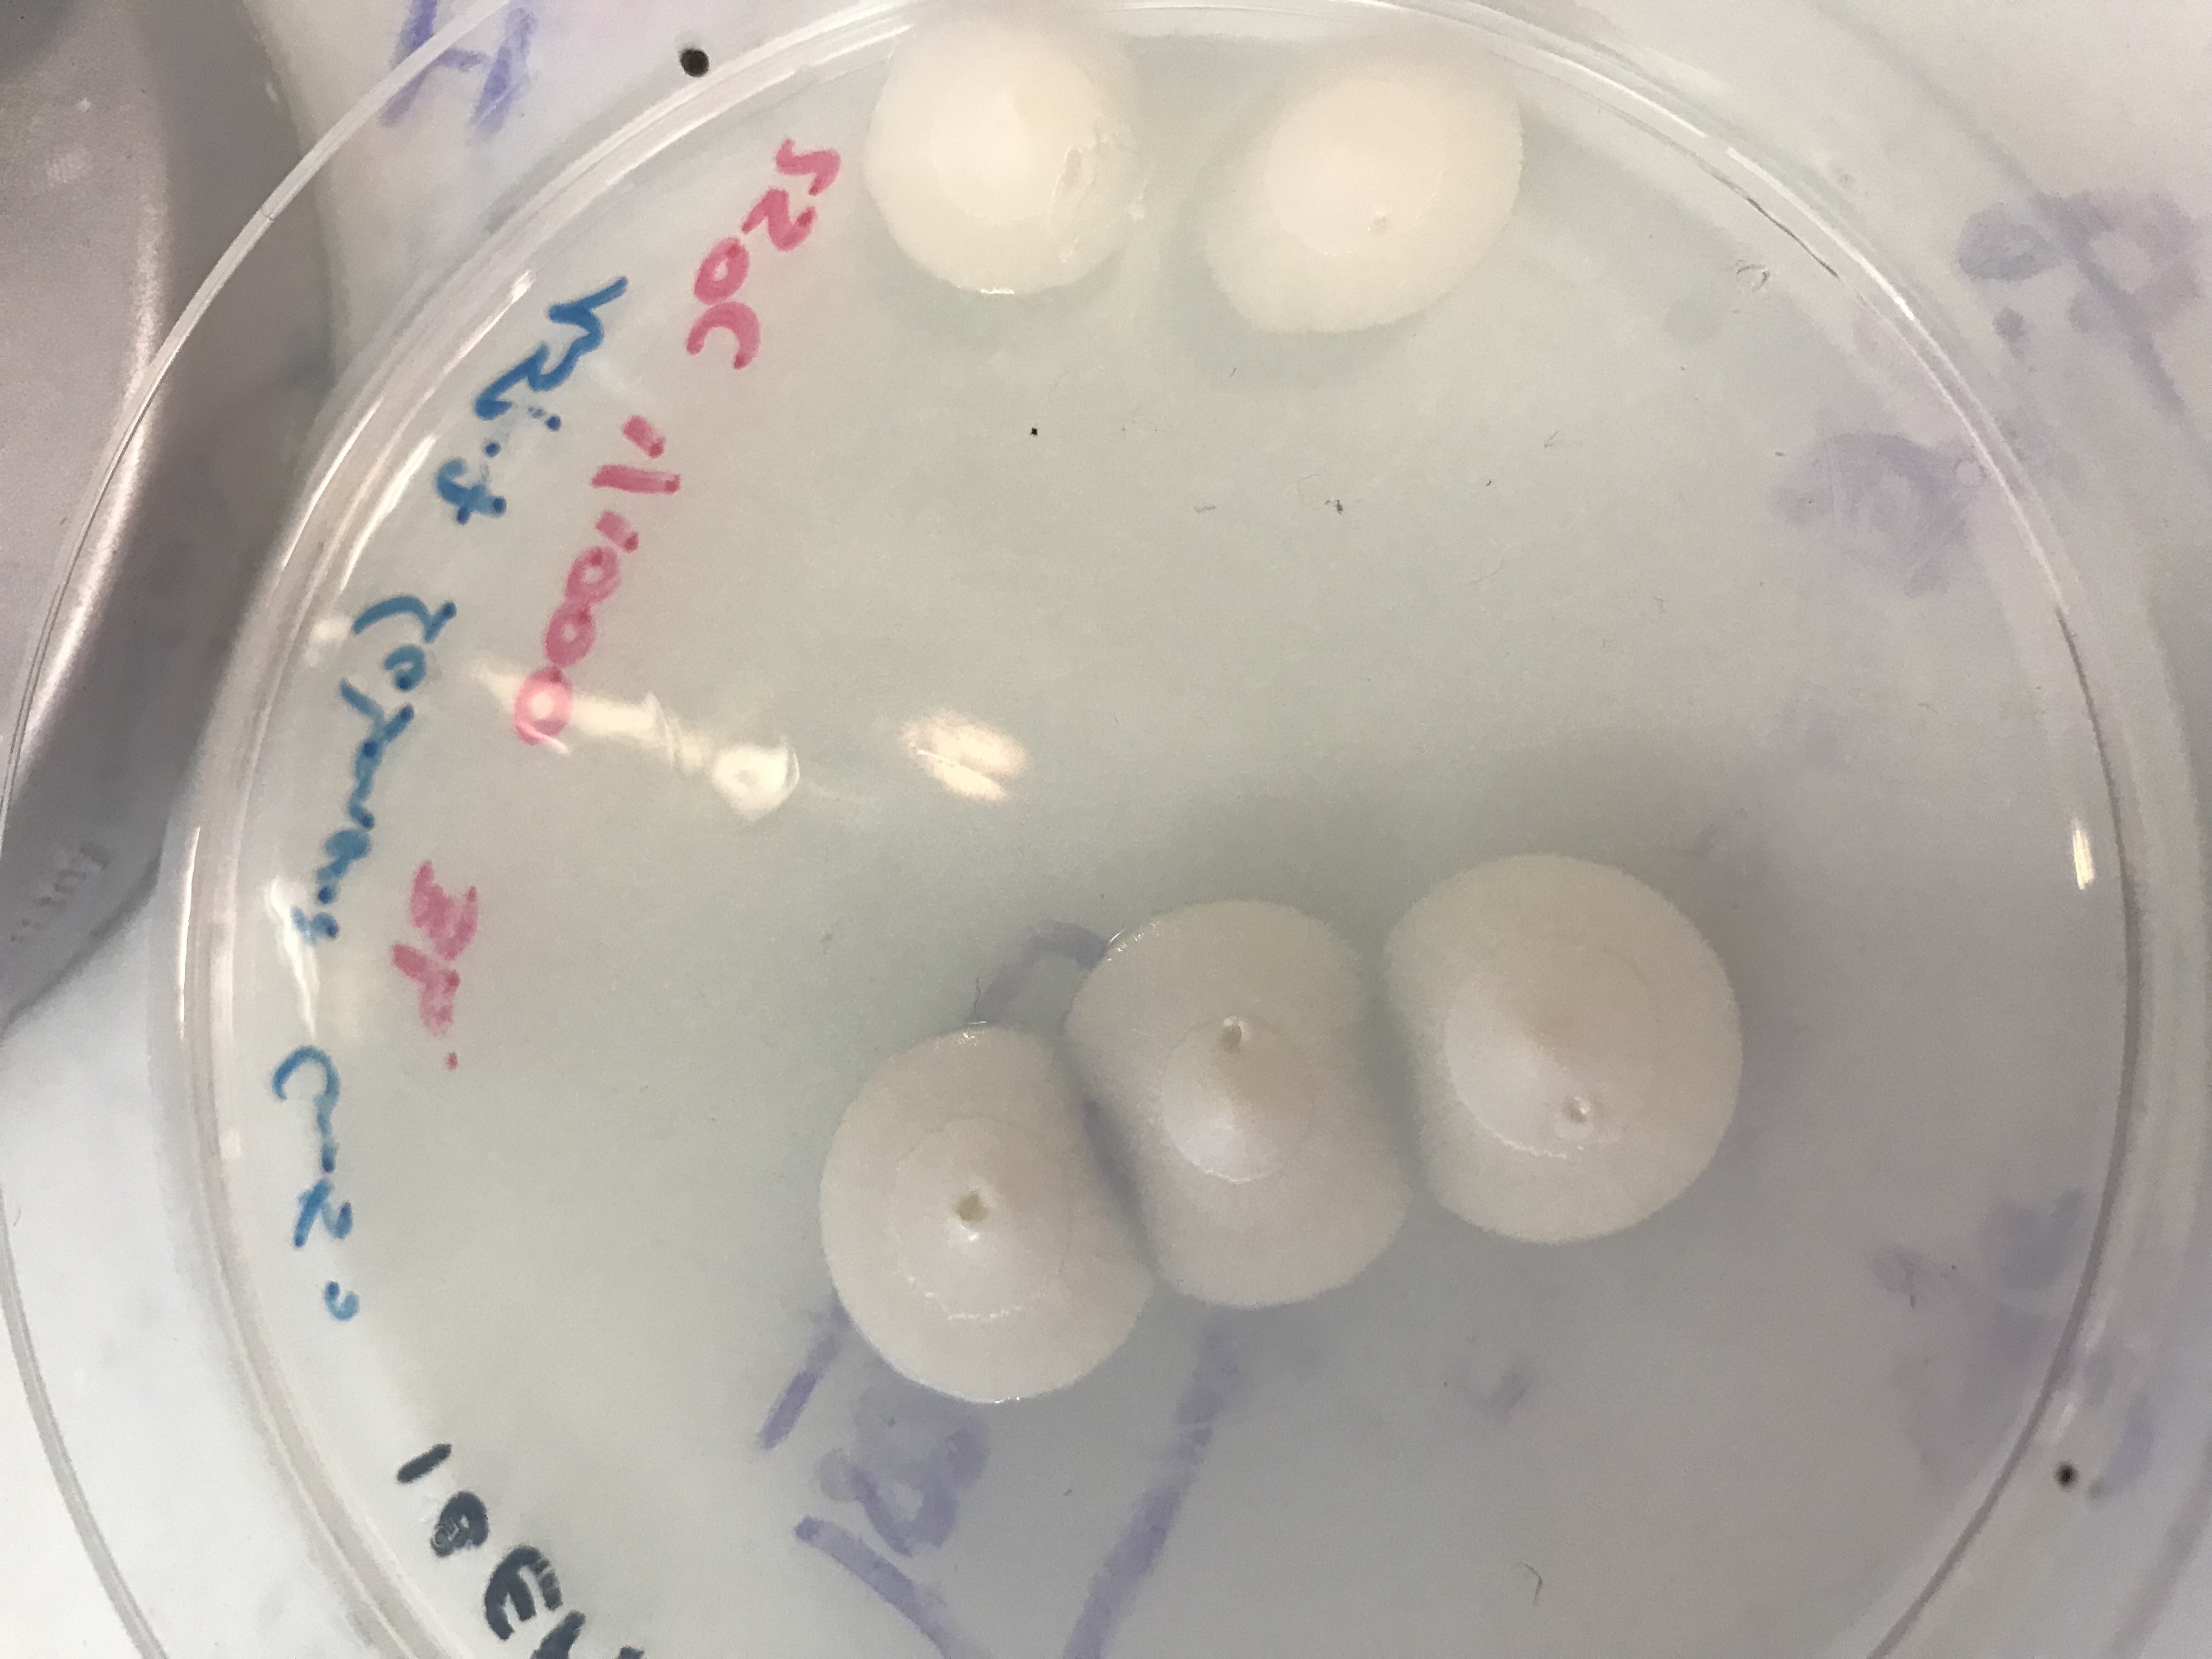
We made a serial dilution and let the fungus grow at three températures : 25°C, 30°C and 37°C. We obtained a lot of results but the culture medium and the most suitable temperature are the Sabouraud culture medium and 25°C. [3]
Killing insects with Beauveria bassiana
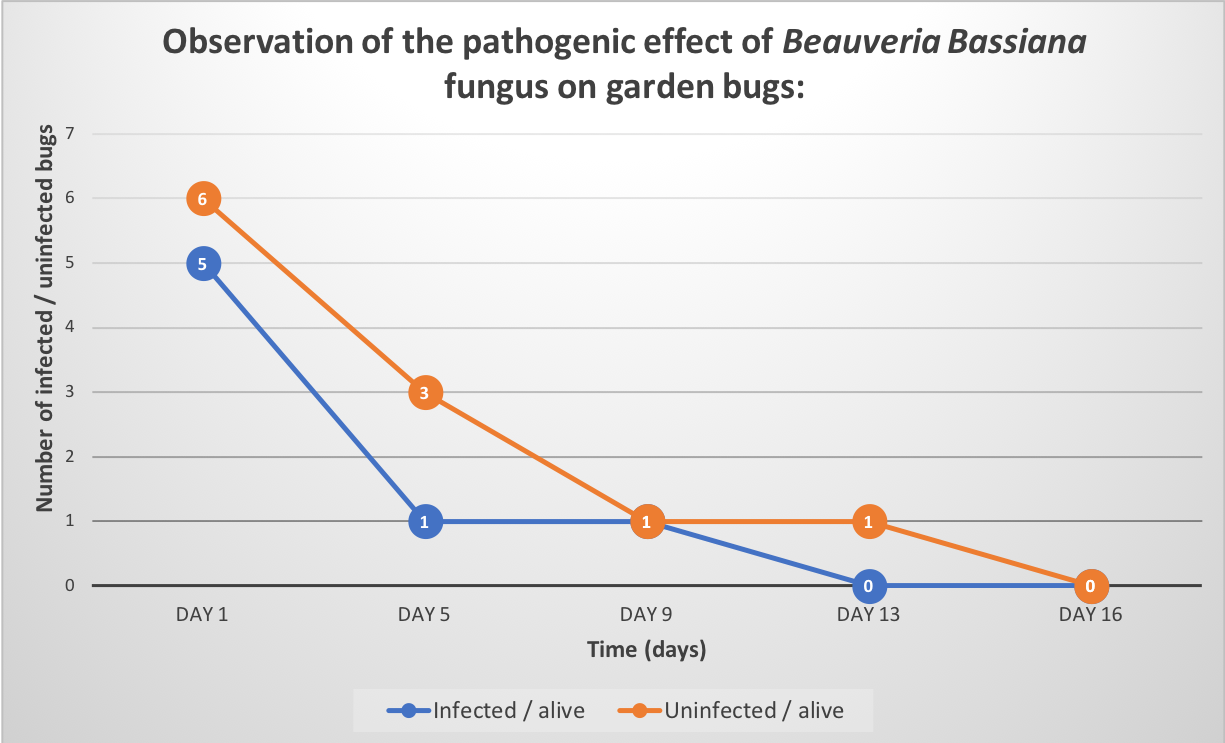
Secondly, we have tested Beauveria Sample on garden bugs with 4g of fungus sample diluted in 40ml of Tween 0,05% to confirmed that it was indeed Beauveria bassiana. We infected them by soaking and observed them for 2 weeks. Unfortunately, results obtained were inconclusive because we had problems keeping our control insect population alive.
However, we did observe mortality, and the infected bugs sprouted fungus a few days after the death of the insects. So, we decided to test our Beauveria Bassiana’s sample on bed bugs in real conditions.
Methionine gamma lyase
Methionine gamma lyase production
During these 3 months in the laboratory we managed to introduce a plasmid construct containing the LacI promoter inducible with IPTG (<bbpart>BBa_R0011</bbpart>), RBS + methionine-y-lyase (<bbpart>BBa_K1493300</bbpart>) and his-tag, inserted in a PSB1C3 vector. In order to test the production of the encoded protein, we did a SDS PAGE from several cellular supernatant as well as western blots. Regarding the his-tag, the latter has been added to methionine-y-lyase (<bbpart>BBa_K1493300</bbpart>) with the megaprimer PCR method. The part corresponding to methionine-y-lyase + his-tag is <bbpart>BBa_K2718005</bbpart>. The part that is used for the protein production is as follows <bbpart>BBa_K2718006</bbpart>.
To confirm the bands identified on SDS-PAGE corresponds to methionine-y-lyase, a western blot[4] with anti-his-tag antibodies was realized.
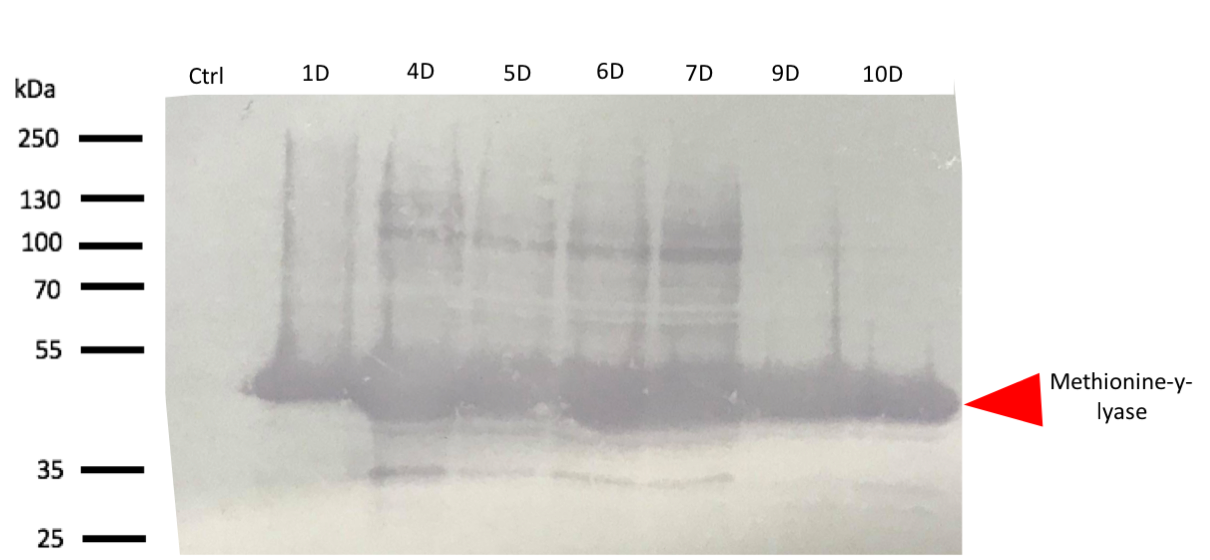
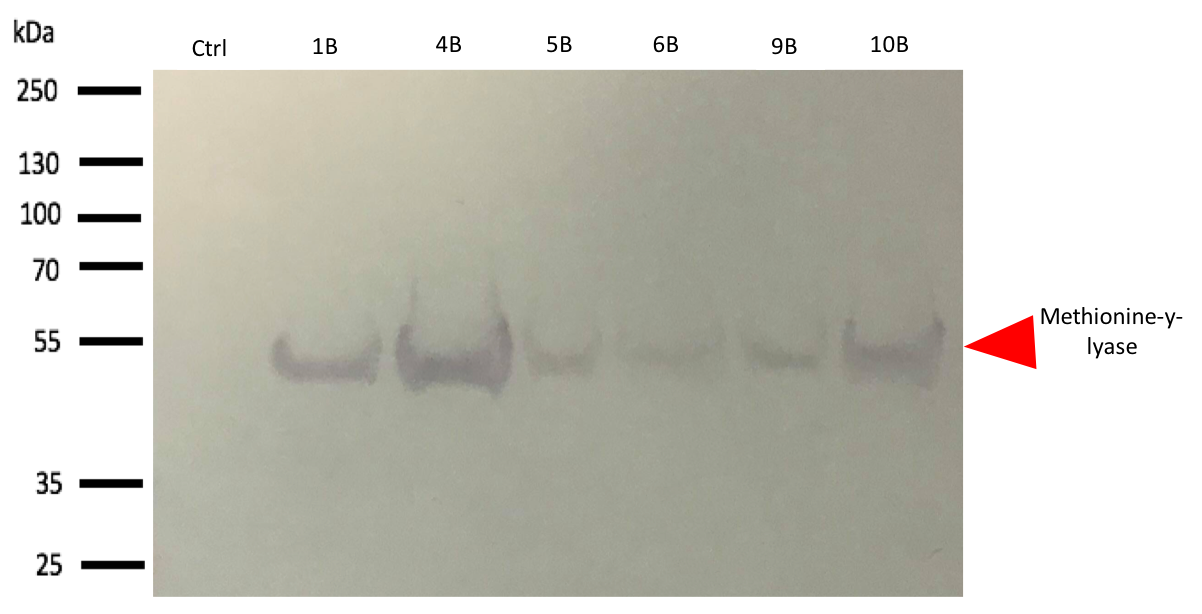
The western blot thus confirmed the band identified on the SDS-PAGE corresponded to the methionine-γ-lyase produced by E.Coli DH5α bacteria and by E.Coli BL21 bacteria.
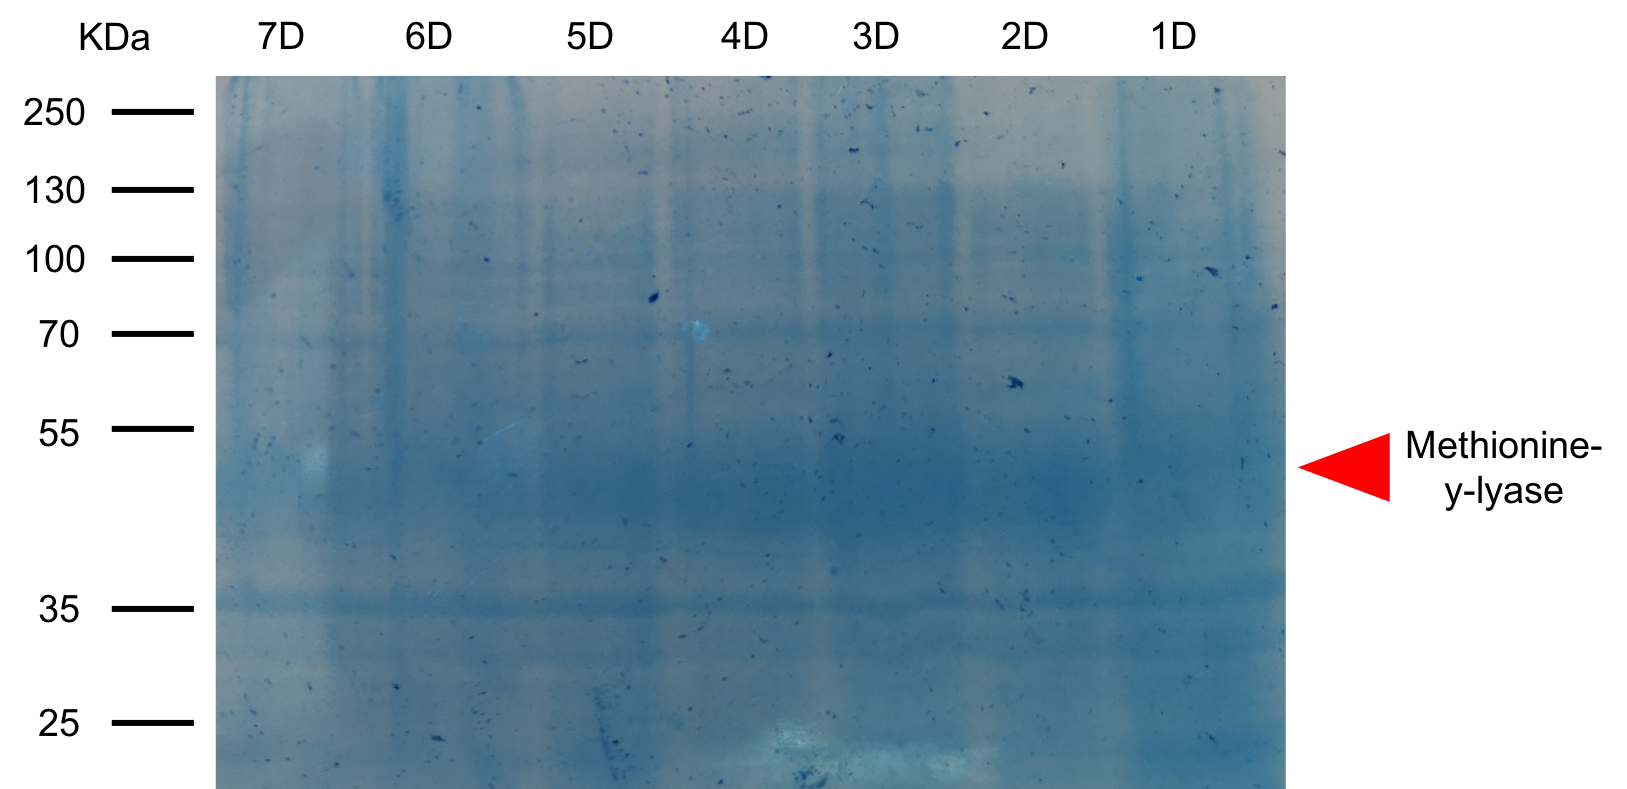
For this test, it used 2 differents strains of E. coli Dh5 alpha which is similar to the strain DH1[5], and a BL21 strain[6]. First, negatives controls are correct, there is no prodution of methionine-y-lyase with empty plasmid. Then, the bands to approximatively 47kDa[7], correspond to methionine-y-lyase molecular weight in both case . Moreover there does not seem to be any significant difference in protein production between the 4 samples when the temperature varies in the DH5 alpha case, whereas this parameter seems to influence production in BL21, since production seems less pronounced at 16 °C. Overall, the production of methionine-y-lyase is lower when the host is a BL21 strain compared to a production in a strain DH5 alpha. However, the methionine-γ-lyase protein is overproduced. After analyzing these results, the induction condition at 500 mM IPTG at 30 ° C is chosen for the rest of the experiments. This condition is the best in yield / time.
Methionine gamma lyase purification
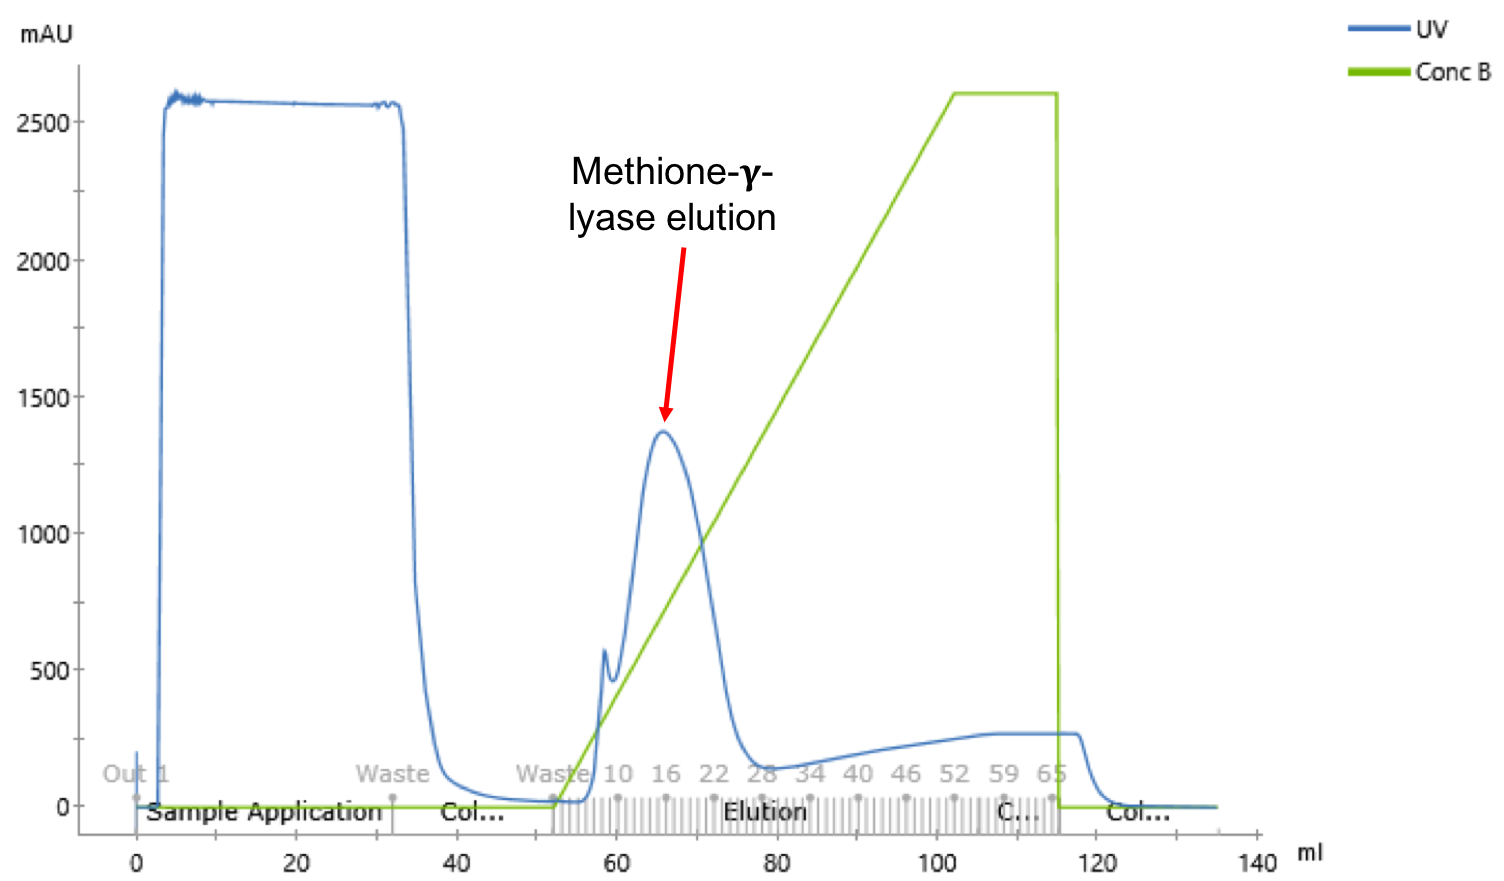
After having realized the methionine-γ-lyase production tests, the purification of the latter is realized in order to obtain pure protein fractions. For this, the E. coli DH5 alpha cell lysates transformed with the construct (BBa_K2718006) are purified. Purification of the protein is realized with pure AKTA pure® using a Ni Sepharose 6 column (HisTrap FF[8]). Akta Pure is a automated chromatography system for quick and easy purification. The fusion of the histine tag with methionine-y-lyase allows to specifically separate the methionine-y-lyase from the total proteins.
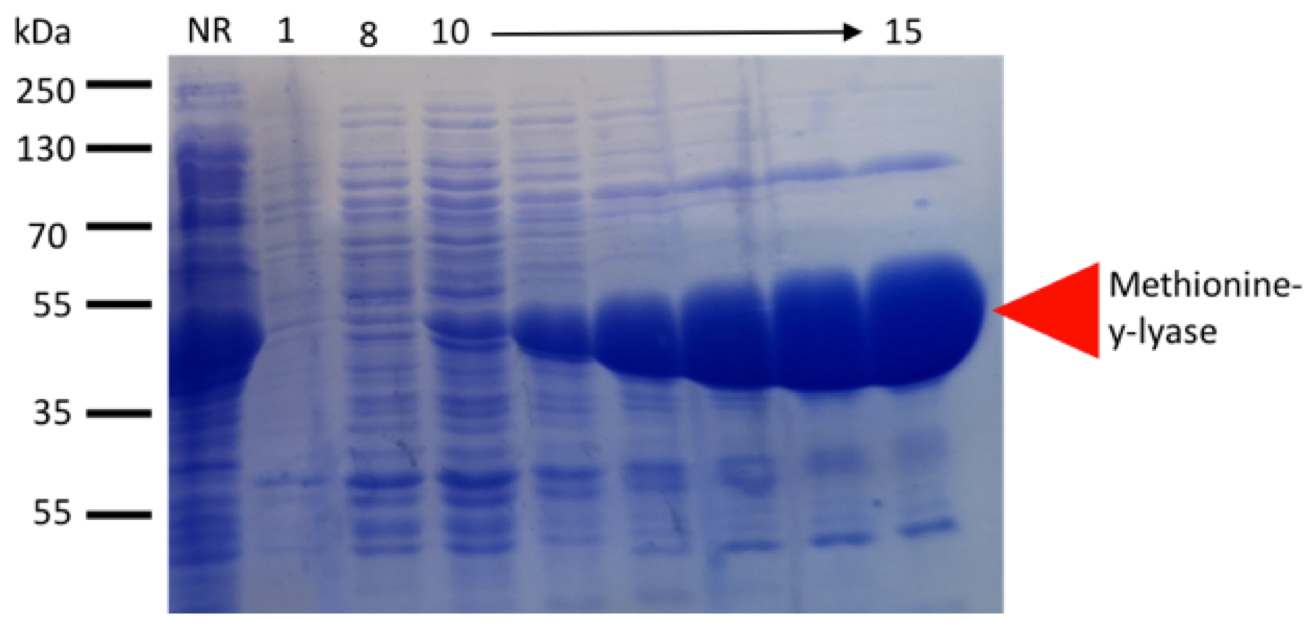
In figure 4, there are 2 elution peaks. The peaks are not correctly separed and MGL is eluted on second peak, so the first peak samples contain contaminants. To confirm that the elution peak corresponds to the methionine-γ-lyase, an SDS-PAGE of the fractions corresponding to the elution peak as well as the non-retention is realized (fig.5).The deposit on the SDS-PAGE of the no-retained fraction allows to check if our has been retained on the column [9].
After SDS-PAGE visualization (fig. 5), the histidine tag allow to purify the methionine-γ-lyase from the total proteins. An intense band is observable approximately 47 kDa corresponding to methionine-γ-lyase. However, the 47kDa band is observable in the no-restrained, it means that there was too much protein and the used column saturated with our sample. To have a perfect purification of the methionine-y-lyase, it is possible to realize an exclusion chromatography. After purification, a pool of fractions 11 to 26 is made. A volume of 15 ml of methionine-γ-lyase at 2.7 mg / ml is obtained. So for 1l of cell culture 40mg of protein is obtained. Now that the protein is purified, an activity test is done to check if the methionine is bioactive.
Methionine gamma lyase activity
To characterize the activity of methionine-γ-lyase, activity tests using DTNB is used. DTNB (5,5′-Dithiobis 2-nitrobenzoic acid) reacts with thiol group so for methionine-y-lyase, DTNB reacts with thiol group of methanethiol.
To realize a methionine-γ-lyase activity test, we were interested in the substrates as well as in the products of methionine-γ-lyase. We have seen from the enzymatic reaction of methionine that the main subtrate was L-methionine, the products were methanethiol which by oxidation was transformed into DMDS / DMTS and 2-oxobutanoate (see reaction).
By dosing of methanethiol by DTNB thus allows to determinate the activity of methionine-γ-lyase. The activity of methionine-y-lyase can be determined by dosing the second product of the reaction, 2-oxobutanoate, using the MBTH (3-Methyl-2-benzothiazolinone hydrazone hydrochloride hydrate). The MBTH reacts with alpha-keto of 2-oxobutanoate.
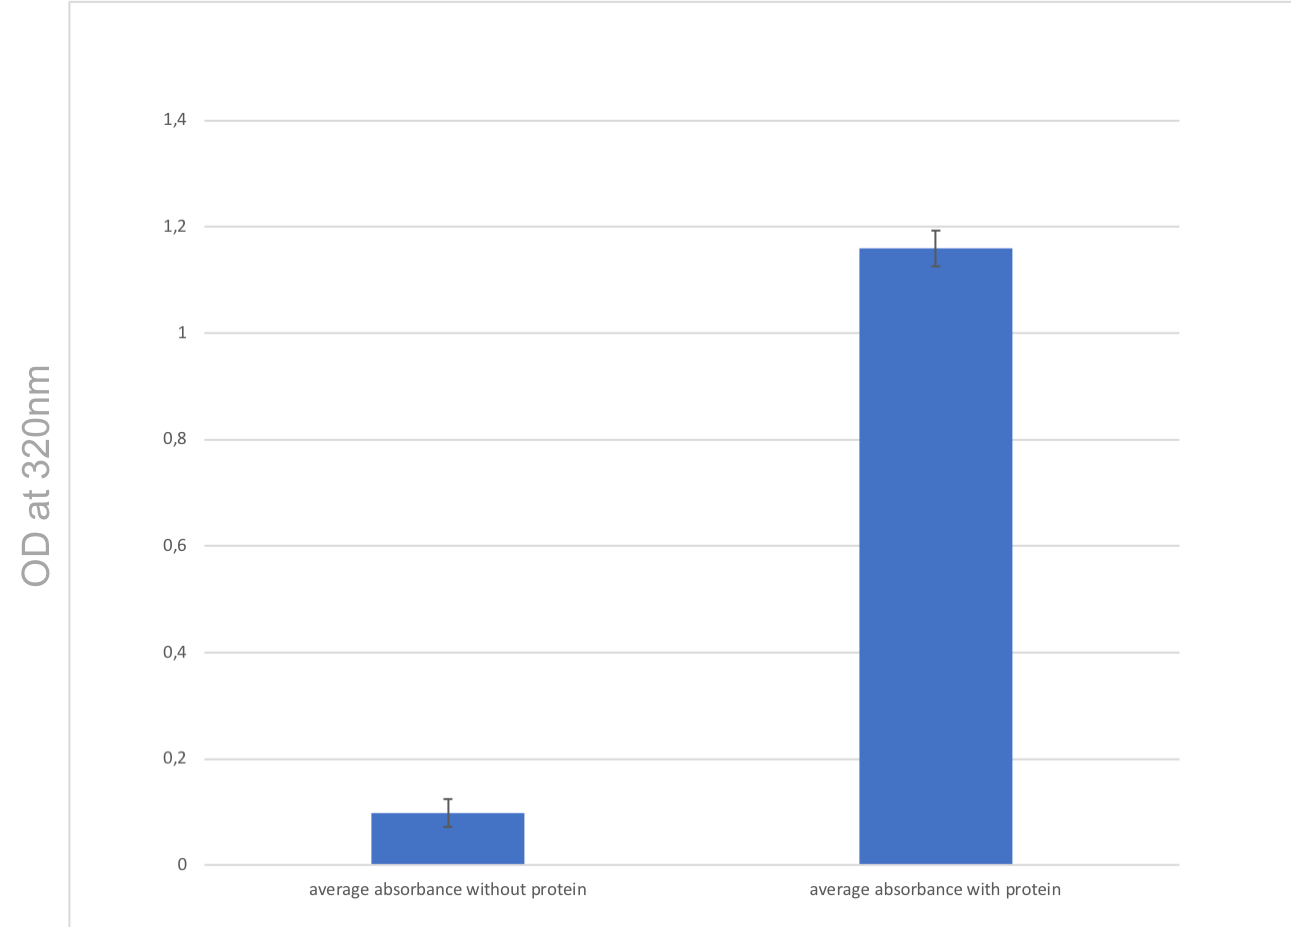
In Figure 6, we observe that when comparing condition 1 (L-methionine alone without protein) and condition 2 (L-methionine + methionine-y-lyase), there is a strong increase in absorbance by a factor 12. Condition 1 corresponds to a negative control.
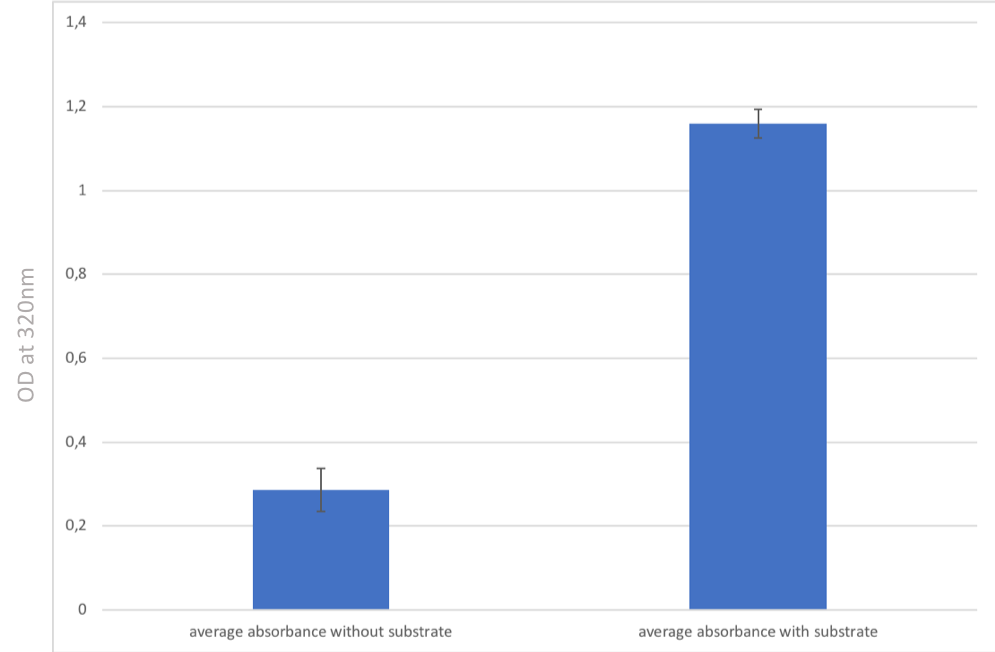
In Figure 7, we observe that when comparing condition 1 (protein alone without the substrate: L-methionine) and condition 2 (L-methionine + methionine-y-lyase), there is a strong increase in the absorbance aproximately of a factor 12. Condition 1 corresponds to second negative control as in Figure 6.
These large increases in the absorbance between the two conditions (FIG. 6 and FIG. 7) biologically indicate that methionine-γ-lyase transforms L-methionine into methanethiol. We can therefore deduce that methionine-y-lyase is bioactive.
Mandelate synthase
Mandelate synthase production
During the 3 months in the laboratory we managed to introduce a plasmid construct containing the IPTG promoter, the RBS and the hmaS gene, inserted in a PSB1C3 vector. In order to test the production of the encoded protein, we did a SDS PAGE from several cellular fractions [10].
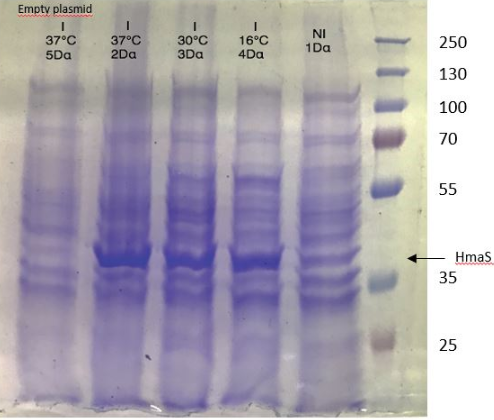
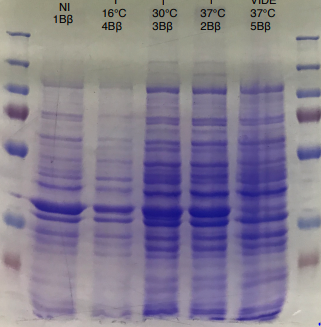
Figure 1 SDS-PAGE of HmaS production with induction (2, 3 and 4), without induction (1,NI) and with empty plasmid (5), into a DH5 alpha E.coli strain.
Figure 2 SDS-PAGE of HmaS production with induction (2, 3 and 4), without induction (1,NI) and with empty plasmid (5), into a BL21 E.coli strain.
For this test we used 2 different strains of E. coli Dh5 alpha which is similar to the strain DH1 [11], and a BL21 strain [12].
First, negative control that we made are as expected, there is no prodution of HmaS with an empty plasmid.
Then we can see bands at approximatively 37kDa, that correspond to HmaS molecular weight in both cases [13]. Moreover, there does not seem to be any significant difference in protein production between the 4 samples when the temperature varies, in the case of DH5 alpha, whereas this parameter seems to influence production in BL21, since production seems less successful at 16 °C. Overall, the production of HmaS appears to be lower when the host is a BL21 strain compared to a production in a strain DH5 alpha. However what we can say now is that we found what seems to be an HmaS overproduction.
Mandelate synthase purification
After HmaS production tests, and in order to obtain pure fractions of the protein, we tried to purify the protein from the cell lysate of a strain of DH5 alpha transformed with our constructBBa_K2718011. For this we did a purification on AKTA with a Resource Q anion exchange column[14].
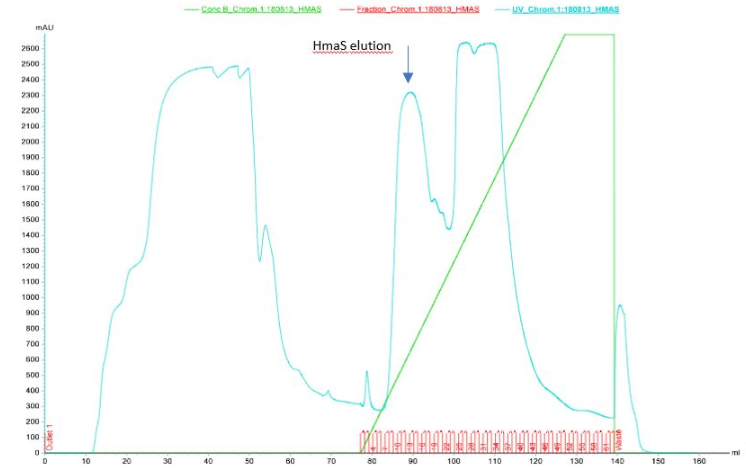
Figure 3 Elution of HmaS after purification by ion exchange column performed by Akta
During the first chromatography we can see 3 peaks in the elution profile which appear between 85 and 125 ml of solution B. One of them seems to be our protein however results are not perfect, because ion exchange chromatography is not a selective affinity technique for protein isolation. That is why we decided to do SDS-PAGE on the elution fractions to see if the protein is present (see figures 4a and 4b)[15]
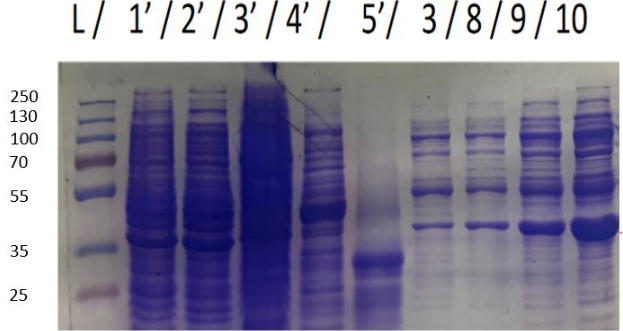
Figure 4a SDS-PAGE of eluate after purifiction L. Ladder , 1'Bacterial lysate ; 2'pellet of bacteria lysate ; 3' non purified fraction ; 4' flow through during protein injection ; 5' flow through during wash before elution ; 3,8,9 and 10 elution samples
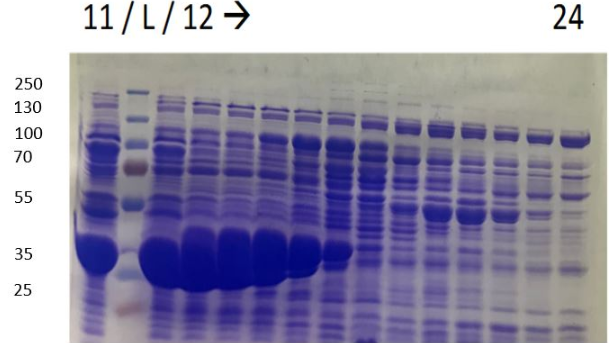
Figure 4b SDS-PAGE of eluate after purifiction L. Ladder 11 to 24 elution sample
The very intense spots, at approxomatively 37kDa, can be seen, which probably corresponds to HmaS. Nevertheless, the samples were not pure, others proteins were mixed with HmaS. However, what we can say is that HmaS is on fractions 8 to 17, which correspond to the second peaks on figure 3. In conclusion, we partly purifed HmaS. Moreover, we can improve this purification, by using other methods like size eclusion chromatography.
Mandelate synthase activity
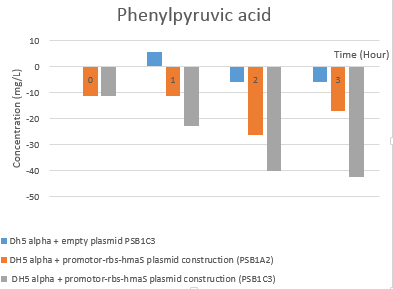
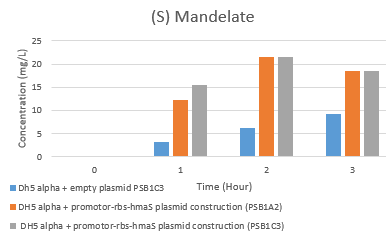
Then we tested the activity of our BBa_K2718011 biobrick. In order to test the mandelate synthase activity in our E.coli strain, we made an HPLC analysis of cell supernatents over 7h of cell culture as described in our protocols tab. The elution profils have been analysed and were compiled into several figures that can be found in the Notebook. All these data have been converted in order to substract the control values (DH5 alpha) and we have concentrated on the first 3h. During the exponential phase of growth we saw a significant production. The resultant graphs are shown here.
Fig 5e. Hplc test results: (S)-mandelate rate evolution
Fig 5f. Hplc test results: Phenylpyruvic acid rate evolution
The first thing that can be noticed is the global decrease in phenylpyruvic acid and increase in (S) mandelate concentrations. There is some mandelate production in the control strain possibly due to non-enzymatic degradation of the phenyl-pyruvate. We can conclude that there seems to be a (S) mandelate synthase activity, as the (S) mandelate rate are highter in our transformed strain than the E.coli strain with empty plasmid (in particular with the psb1c3 plamsid). However, we have not yet confirmed these results. In addition, the HPLC peak separation is not perfect, so a modification of the gradient parameters between solution A and B, as well as elution time, might improve the results.
Chitinase
Chitinase production:
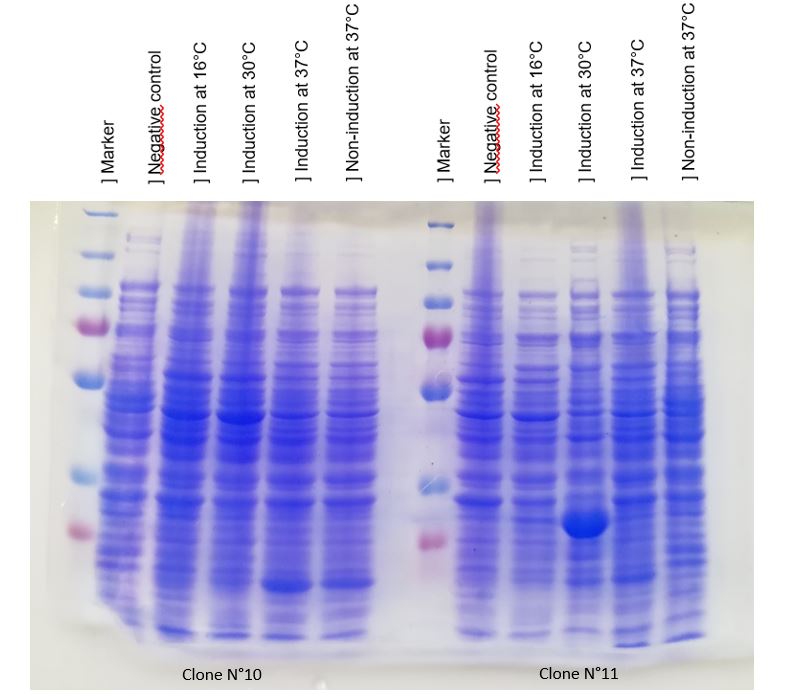
We managed to produce chitinase thanks to our construction BBa_K2718022. An inducible overproduction driven by pLac promoter was used to study chitinase production, induction experiments using IPTG showed the presence of the protein. We choose to produce chitinase by E. coli K-12 DH5-alpha strain. For this two strains two differents clones N°10 and N°11.
Figure 1: SDS-PAGE of chitinase produced by E. coli K-12 DH5-alpha (Ladder: 250kD, 130kD, 100kD, 70kD, 55kD, 35kD, 25kD, 15kD, 10kD).
As seen in Figure 1, a protein at the expected length (30 kDa) was overproduced at 30°C after IPTG induction in DH5alpha.
The un-induced cells show an low level of protein production.
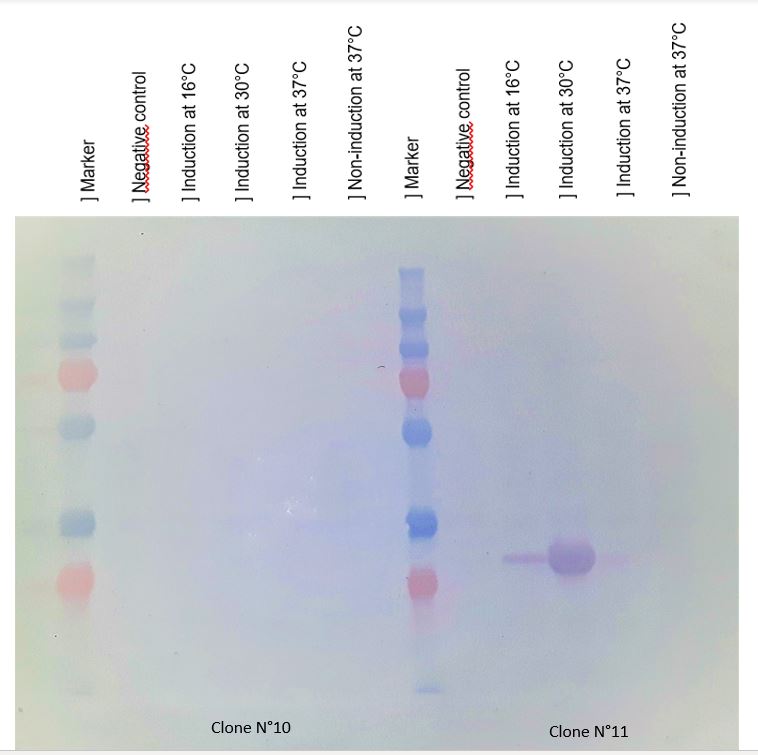
This overproduction should be the chitinase, but it strange that the clone N°11 wasn't able to produce much protein at 16°C and 37°C. We verified that the protein was chitinase with a western blot.
Figure 2 : Western blot with anti-HIS antibodies revelation
Chitinase production was best after IPTG induction (at 500 mM) at 30°C. This condition of culture will be used to produce in large quantity chitinase for purification and activity tests.
Chitinase purification:
Chitinase designed had a polyhistidine-tag which allows it to be specifically separated from the total proteins. A purification using a His-trap collumn was used to purify Chit1, on an Akta Pure automated chromatography system. The nickel-nitrilotriacetic acid column matrix allows a specific interaction between histidine residues and the bound metal ions of the nickel-nitrilotriacetic acid.
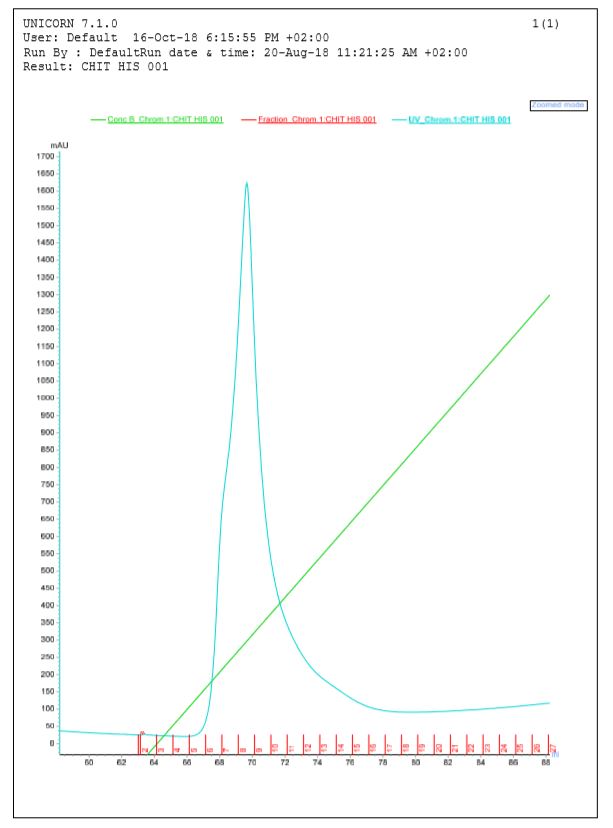
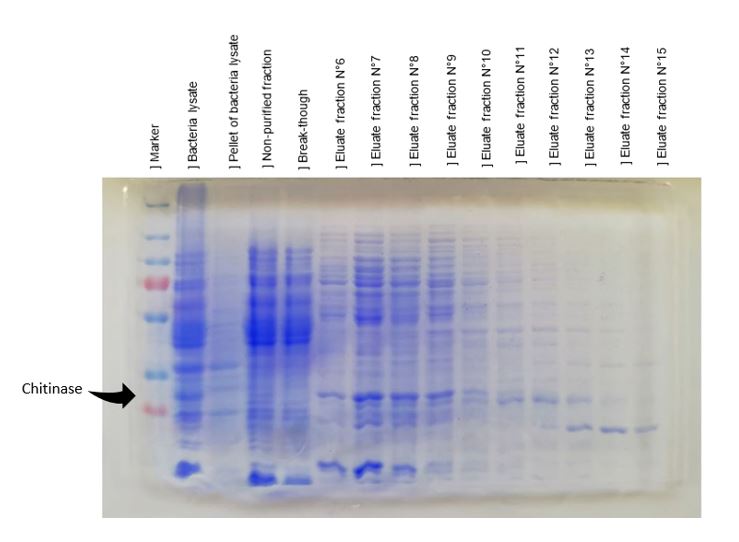
In figure 3, an elution peak corresponding to the tagged chitinase visible, but a slight curve at the start of elution peak perhaps indicates a contaminant peak. There isn't a separation of these two peaks therefore contaminant proteins and protein of interest are eluted togeather in the first samples. According to the elution profile and SDS-PAGE, chitinase is present in fraction 6 to 9, but these samples weren't completely pure, a lot of nonspecific proteins were recovered. Another purification is required for better purity, unfortunately we didn't have time to repeat the purification. But we prove here that chitinase should be purified thank to its polyhistidine tag.
Figure 3: Elution graph from chitinase purification
Figure 4: SDS-PAGE of polyhistidine-tagged chitinase purification produced by E. coli K-12 DH5-alpha, using a nickel-nitrilotriacetic acid matrix.
As shown in figure 4, a protein at 30 kDa corresponding at the chitinase is obtained in the bacterial lysate, in the non-purified fraction and in fractions N°6 to N°10. These fractions were pooled and used for activity tests. Numerous controls have been done,chitinase was produced without its peptide signal of secretion, so it will be contained in the cytoplasm, the absence of the band at 30 kDa in the pellet verify that chitinase wasn't contained in the membrane. Bacteria lysate confirmed the presence of chitinase at 30kDa; non-purified migration shows a low quantity of chitinase with all proteins contaminants; break-though sample didn't contain the protein target demonstrating that all chitinase was fixed on nickel-nitrilotriacetic acid matrix.
The results of chitinase purification prove that chitinase can be purified thanks to its polyhistidine-tag. But purification wasn't optimal and can be ameliorated because a lot of contaminants are isolated with chitinase. The nickel-nitrilotriacetic acid matrix column used was well-used, that can reduced its efficiency. For an optimal separation of chitinase, we should pool eluted fractions containing chitinase and purify to reduce the protein contaminants. But due to lack of time we continued with this purification to do activity tests.
Chitinase activity test:
Schales' procedure was used to test the chitinase activity. Schales' procedure is a colorimetric method commoly used for measuring the reducing sugars. Chitin is composed of sugar units of either N-acetyl-G-glucosamine. Chitinase degrade chitin producing N-acetyl-G-glucosamine. To monitor chitinase activity, the reducing sugars released after chitin hydrolyse are detected by a color diminution of the yellow Shales' reagent. This color diminution is translated by a absorbance diminution.
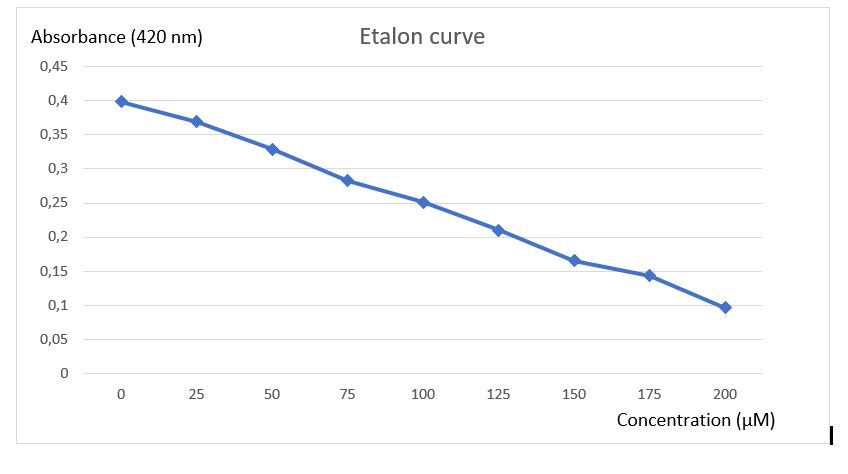
To analyse activity test results, an etalon curve have been done using the final product of chitinase reaction (N-acetyl-G-glucosamine), to know in which concentration of final product must be obtained after reaction to be detected by the method of Schales.
Figure 5: Etalon curve of N-acetyl-G-glucosamine after Schales's activity test.
A final curve has been obtain showing a absorbance diminution in function of increasing N-acetyl-G-glucosamine concentration. With this etalon curve, concentration of final product obtain after chitinase reaction can be determined. This results revealed the efficiency of Schales'procedure to detected N-acetyl-G-glucosamine to 0 at 200 uM.
Figure 6: Table of absorbance measurements of chitinase activity test
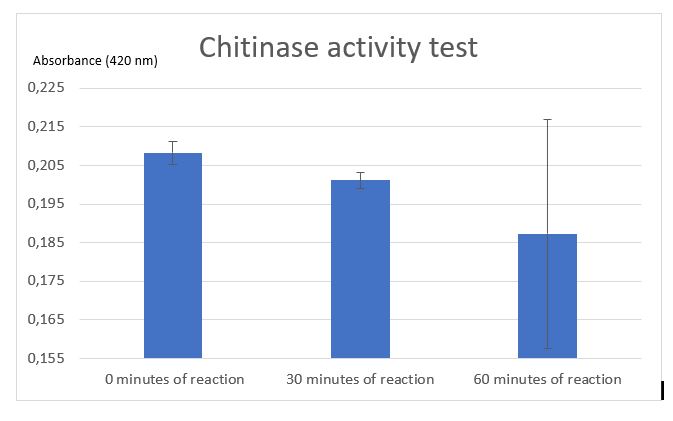
Figure 7: Chitinase activity test by Schales' procedure
According to figure 7, after 30 minutes of reaction a significant activity was mesured. But after 1 hour of reaction the standard deviation was unfortunately very large. One of the difficulties encountered with the assay was the chitin sample. Colloidal chitin is suspended in water, but made from partially hydrolysed shrimps shells and this was difficult to pipet and caused problems with reproducibility. We added a centrifugation step to the protocol but precipitated chitin sometimes became resuspended and altered the results. After centrifugation chitin wasn't really pelleted, it was easily removed. This problem with chitin pelets is the origin of the high standard deviation in the 1hour point.
Thanks to our standard curve, considering the results after 30 minutes, we can conclude that the initial rate of the reaction, our chitinase can released 125 uM of N-acetyl-G-glucosamine. An initial rate of chitin hydrolysis of 4 uM/min.
Figure 8: Table of measurements of controls for chitinase activity test
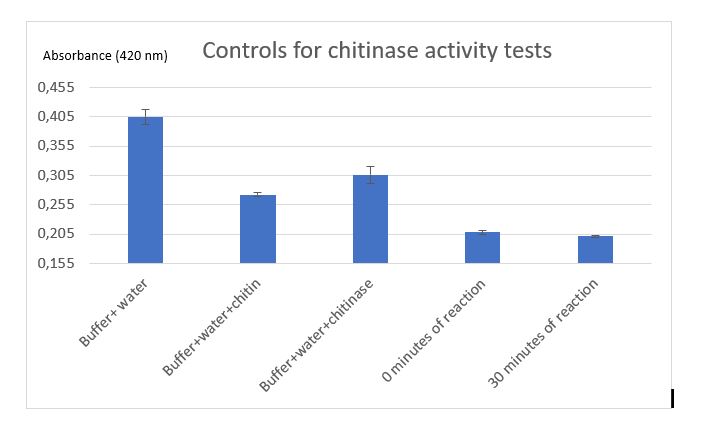
Controls were realized to be sure that the reduction of absorbance is due to chitinase reaction. A control with Schales'reagent and water show a hight absorbance by the colorimetric reactant, when chitin was added absorbance decreased that was expected because of chitin reducing sugar ends.
Figure 9: Controls for chitinase activity test
Trap prototype tests
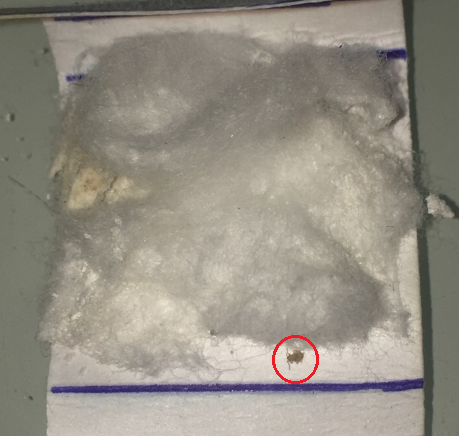
We decided to conduct field tests with a trap prototype a few weeks before the Giant Jamboree to test the efficiency of both units: Beauveria bassiana combined with adjuvants, and the pheromones efficiency. During one week, we put traps containing our fungus, the pheromones or both of them, in infested places with bed bugs. The protocol is available on our Protocols tab. The traps observation after recovery and freezing showed us that we caught a bedbug in one of our traps containing the pheromone cocktail and Beauveria bassiana. So we can conclude that the bedbugs do visit our traps.


