Team:BJRS China/Results
Results
Vector Construction
We got the gene of INP from BBa_K523013 sent by iGEM, and the gene of intimin, autotransporter and VHb from Chen Guoqiang Lab in Tsinghua Uniuersity. We used gibson assembly, goldengate and biobrick assembly to make our constructs with the pSB1C3 backbone. For each method we have built a standard procedure so that everyone can design the primers for construction alone by following the procedure. Thus we successfully built the vectors in need and used them to conduct the following experiments.
Test for surface display system
As mentioned in the design part, we used three kinds of surface display system named as INP, intimin and autotransporter respectively, and we linked them to the fluorescent protein to test their surface display ability. The constructed vectors were transformed to E.coli (BL21) to express the interest protein. Two methods were used to test the surface display ability, one of which is watching the distribution of fluorescence after cell lysis and the other one is super-resolution microscope examination. The results of INP, intimin and autotransporter are shown in figure 1, figure 2, figure 3 respectively.


In the cell lysis experiment we firstly adjusted the OD600 of all the interest overnight cultured bacteria to 1.0 and then lysed the cells using Ultrasonic Cell Disruptor. The results (fig.1A, 2A, 3A) showed that after cell lysis followed by centrifuge, both the precipitation and supernatant shows relative strong fluorescence signal in intracellular expressing GFP or mEos cells, while the signal was stronger in supernatant than in precipitation in surface displaying GFP or mEos cells. To further confirm this result, we removed the supernatant and observed that the signal in fluorescent protein surface displayed cell fragments was stronger than or the same as the intracellular expressed ones. This suggests that the surface displayed fluorescent protein were anchored to the outer membrane and being precipitated with the cell fragment, while the intracellular expressed fluorescent protein were solved in the supernatant.
From the microscopy examination(fig.1B, 2B, 3B) we can see that the intracellular expression of GFP or mEos displayed the rode-shape of E.coli, while the signal of surface displayed GFP or mEos showed the dotted pattern around the cells(as the arrows indicated), which suggests that the fluorescent protein was gathered and distributed at the surface of E.coli. Comparing the three kinds of surface display system we found that autotransporter showed the best potential of surface display among the three under the current construction(fig1,2,3).
From the autotranspoter surface display system, we found several interesting phenomes. One is that the longer and bigger the bacteria are, the more obviously the dotted distribution pattern around the bacteria could be seen(fig.4). One explanation was that the long bacteria have bigger surface area to let the displayed fluorescent protein depart from each other, while in the small bacteria, the surface displayed fluorescent protein were too crowded to show the dotted pattern. Another explanation could be that the long bacteria is more mature than the small one. In the small bacteria, the fluorescent protein was just generated but not transported to the surface yet while there is already enough time for the long bacteria to do the surface display part. The same phenome was also showed by INP surface display system(fig.1B).

Another interesting phenome was that some mEos loaded by autotransporter showed the departing tendency from the outer membrane of bacteria(fig.5). Allowing for the secretion function of autotransporter, we thought that the departing-like fluorescent protein may be excreted by the autotransporter, suggesting that the system may be not very stable. However, back to our project, as long as the VHb gathered around the bacteria, it could collect oxygen to increase the local oxygen concentration then to benefit the growth of bacteria. Thus, the autotransporter could be applied to our project.

Test for OxygenMAX system
We constructed intracellular expressing VHb vectors under the control of two promoters with different strength(J23104 and J23110), and the surface displaying VHb via INP vector under the control of J23104 promoter(fig.6). We transforms the three constructs to E.coli(DH5α) and measured their growth curve.

Firstly we compared the growth curve of intracellular expressing VHb bacteria and empty vector transformed bacteria to see if the VHb works(fig.7). From the result we can see that both the two VHb expressed bacteria grew better than the wildtype bacteria, mainly presented on the maximal bio-mass at platform, suggesting that the VHb successfully worked on improving the growth of bacteria.

Comparing the growth curve of the two VHb expressed bacteria we can see that the J23104 drived expressing of VHb can improve the growth of bacteria in a higher level.Allowing for that the expressing strength of J23104 is about twice stronger than J23110(characterized by iGEM2006_Berkeley), this result suggested that the more VHb expressed, the greater bacteria biomass would be gain at the platform, and that the expression strength of J23104 is not yet too strong to bring much burden to the bacteria. So in the future we are supposed to test several stronger promoter to find the best expression level of VHb.
Next we compared the growth curve of intracellular expressing VHb bacteria and surface displaying VHb bacteria(fig.8).

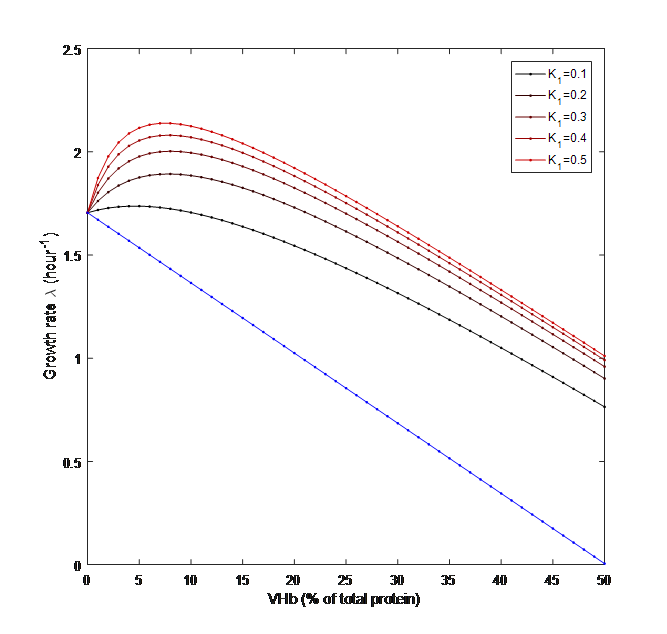
From this result we can see that with the same expressing strength, the growth rate of INP-VHb transformed bacteria is higher than VHb intracellular expressing bacteria, which fitted our modeling result(fig.9 modeling on the exponential phase, K1 represents the gathering rate of oxygen by VHb), while the maximal bio-mass at platform is lower and had no difference with the control group. So maybe the surface display of VHb would mainly affect the growth rate of bacteria but do little to the biomass for it’s dissociation from the respiratory chain.
However, this result is still too weak to support this conclusion, so in the future we will adjust the expression level of surface displaying VHb to see their effects on the growth curve both in the growth rate and the maximal biomass. Also, we will apply the intimin and autotransporter to this system to test the effect of VHb on the growth ability of bacteria under different surface display system.
Moreover, the difference between the growth curves was not very significant, and we thought maybe the normal condition contained enough oxygen so that the bacteria can grow well themselves. So in the future, we are supposed to optimize the experimental condition such as creating a low-oxygen content environment and so on.