Team:HFLS ZhejiangUnited/Results
Experiment
As illustrated in DESIGN page, we constructed four working plasmids, including BBa_K2890005, BBa_K2890006, BBa_K2890007, BBa_K2890008 . Among them, the BBa_K2890005 part did not constructed successfully, but the other three did.
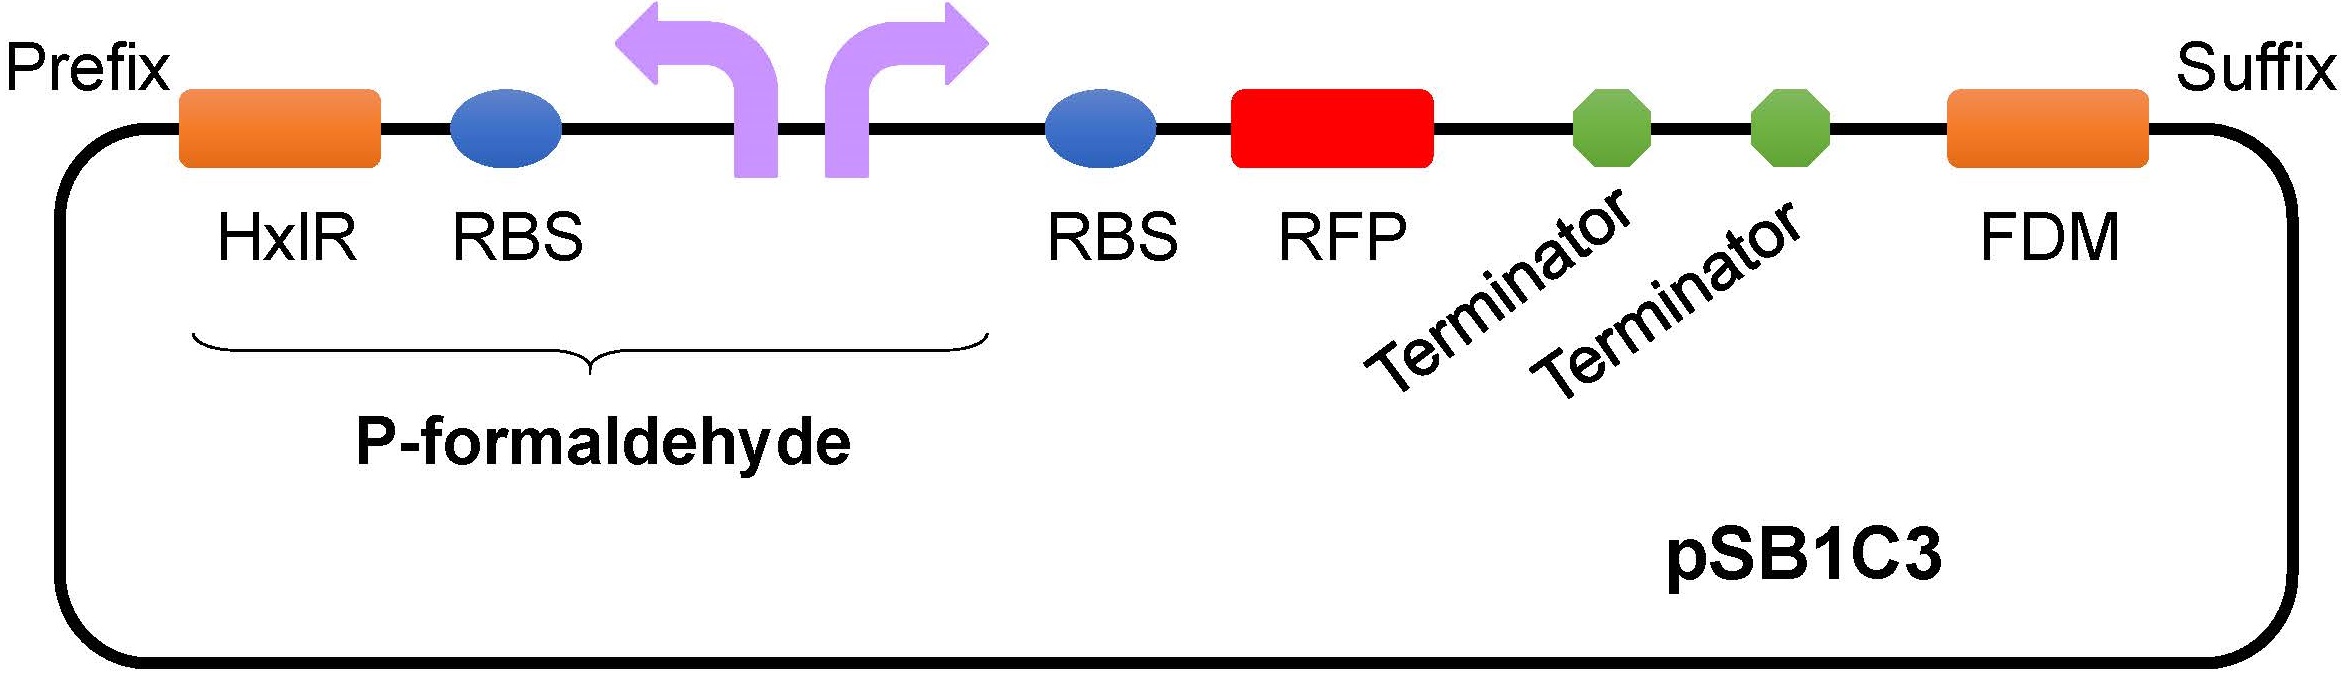
After formaldehyde-induced expression, it was found that BBa_K2890007 and BBa_K2890008 whose formaldehyde promoter is frmR had no obvious red fluorescent protein expression. The plasmid containing HxlR worked well and finally be selected as the working plasmid of our project (BBa_K2890006). The composition of subpart of BBa_K2890006 is shown in Figure 1.
Figure 1 Composition of part BBa_K2890006.
Methods:
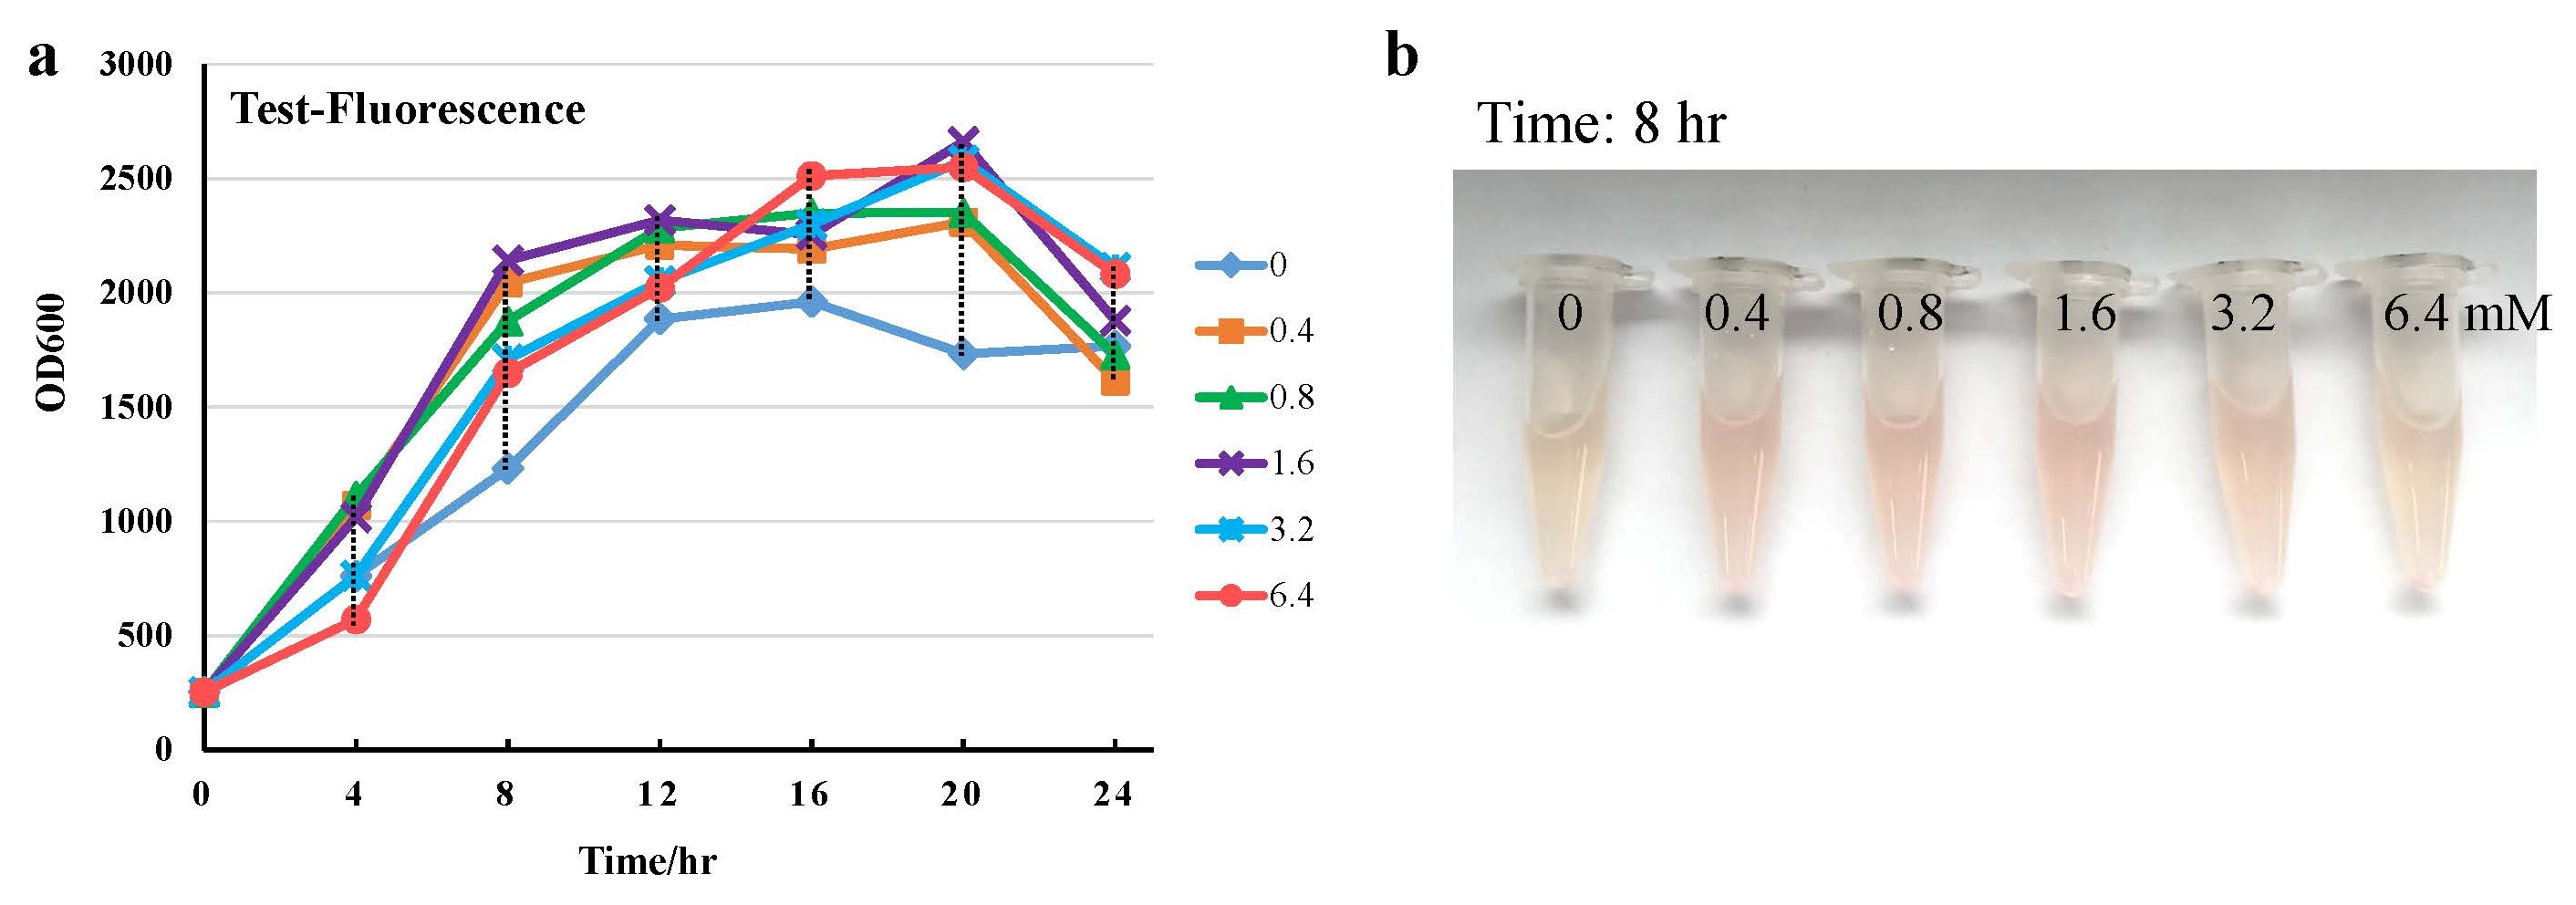
The E.coli BL21 consisting of part BBa_K2890006 was as the TEST group, while the same strain E.coli containing eRFP gene was as the CONTROL group. The two groups were cultured at different concentrations of formaldehyde (0, 0.4, 0.8, 1.6, 3.2, 6.4 mM) under 37 °C and sampled every four hours for OD600 and Fluorescence detection. Using LB medium (added 30μg/mL chloramphenicol) as blank control.
Results and Discussion:
As shown in Figure 2a, we can clearly see in the growth curve that as the concentration of formaldehyde increases, the growth curve of the control group decreases significantly, and the growth of the transferred eRFP bacteria is inhibited when the formaldehyde concentration rises to 6.4 mM. On the other hand, the bacteria almost stopped growing. While, comparatively, the growth curve of TEST group is basically normal and, as the concentration of formaldehyde increases, gradually slows down.
Compared the TEST group with CONTROL group, it is obviously revealed that the tolerance of bacteria to formaldehyde is spectacularly strengthened after adding this part (BBa_K2890006), which proves the degrading potential to formaldehyde.
Figure 2 Growth curve of Escherichia coli under different formaldehyde concentrations: (a) control group, (b) test group.
We can quantify the production of eRFP by means of measuring the fluorescence intensity under excitation wavelength of 575 nm. As shown in Figure 3a, with the extension of culture time, the fluorescence intensity of eRFP gradually increased which indicates that the expression level of eRFP in the medium gradually increased. In other words, the formaldehyde detection function of this working system was working normally.
Besides, as shown in Figure 3b, when the formaldehyde concentration is between 0-1.6 mM, the fluorescence intensity of eRFP is positively correlated with the formaldehyde concentration after culturing for 8 hours. However, after culturing for same times, the fluorescence intensity of eRFP is negatively correlated with the formaldehyde concentration when the concentration exceeds 1.6 mM. It is proved that the formaldehyde degradation function of this working system was working as we expected.
Figure 3 Curve of fluorescence intensity and culture time (a) and photos of E. Coli after culturing for 8 hours (b) under different formaldehyde concentrations.
Results