Team:HK HCY LFC/Model
Model
Mathematical models are used to test for the specificity and sensitivity of our DNA nanostructure.
Four setups are used for comparing the specificity of the DNA nanostructure to target RNA oligos, details of the four setups are shown below:
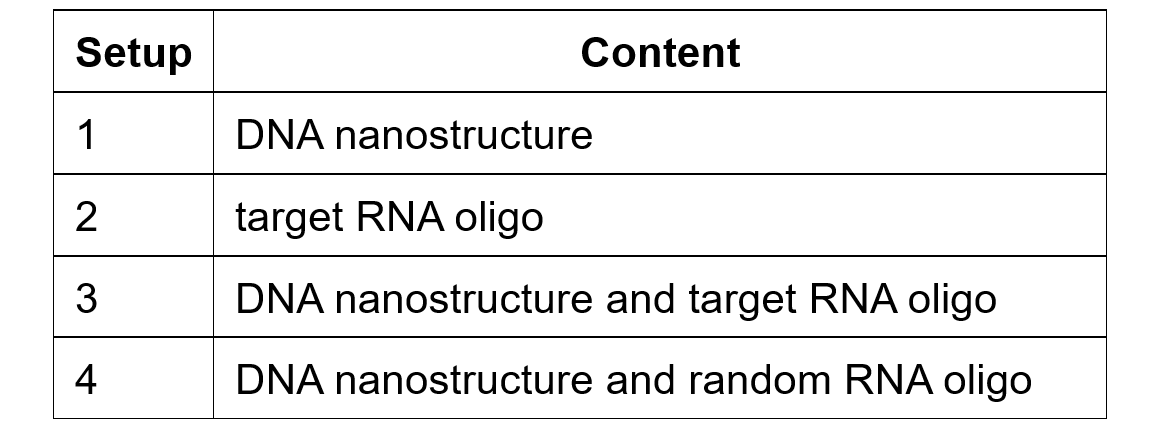
Null hypothesis (H0): G-quadruplex is formed in all circumstances
Alternative hypothesis(H1): G-quadruplex is formed only when the DNA nanostructure binds with the target RNA oligos (miRNA 25)
Result
The following graph show the absorbance at 415 nm among these four set-ups:
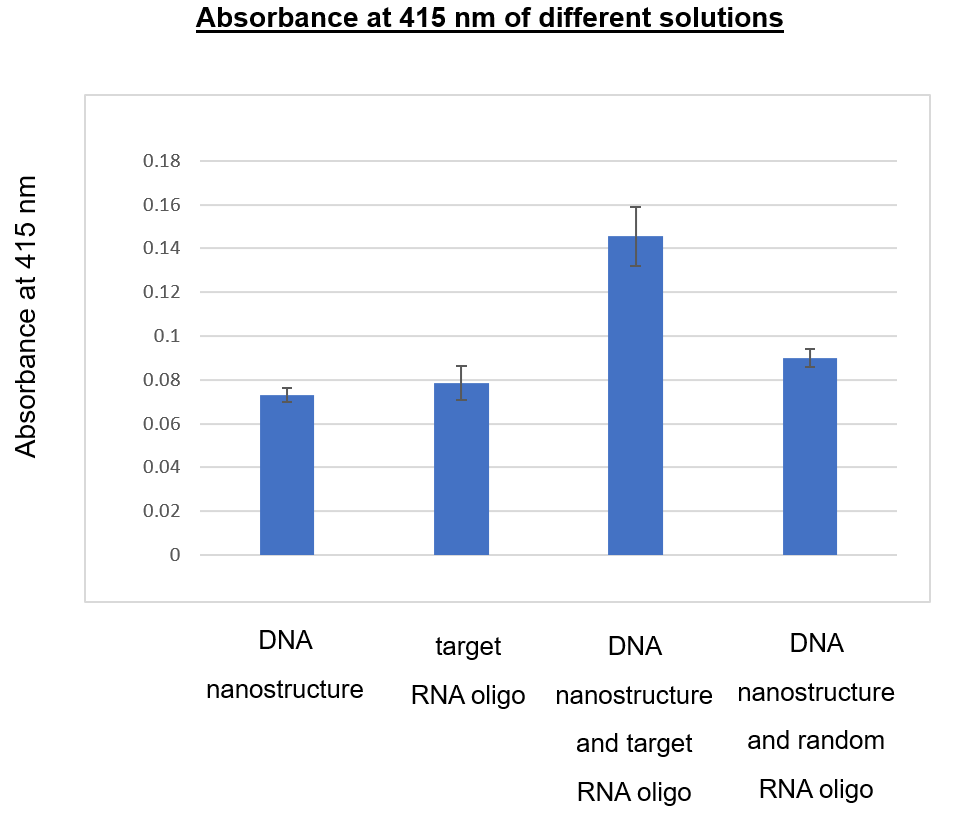
The mean absorbance at 415 nm for DNA nanostructure and target RNA oligo (0.1457) is significantly higher than the other controls (DNA nanostructure: 0.073; target RNA oligo: 0.09; DNA nanostructure and random RNA oligo: 0.079) with a p < 0.05 using One-way ANOVA analysis.
A statistical model of one-way analysis of variance (ANOVA) is used to determine if there is statistically significant difference between the means of the four setups shown above. Results show that highest absorbance is obtained in setup 3 (mean absorbance = 0.1457, p value <0.05). When comparing to the setup 1 (mean absorbance = 0.073) and 2 (mean absorbance = 0.09), it indicates that the increased in absorbance is due to the formation of G-quadruplex upon the binding between the DNA nanostructure and the target RNA oligo. The G-quadruplex formed then binds to the hemin, the hemin mediated catalytic reaction catalyzed the oxidation of ABTS in the presence of H2O2. While comparing the setup 3 and 4 (mean absorbance = 0.079), it shows that G-quadruplex is not formed when the DNA nanostructure binds with the random RNA oligo, the DNA nanostructure is specific to the target RNA. From the above result, the null hypothesis is rejected, and G-quadruplex is formed only when the DNA nanostructure binds with the target RNA oligos.
In addition to the specificity test on the DNA nanostructure to our target RNA oligo, the sensitivity of our DNA nanostructure is tested with different concentration of target RNA oligo ranged from 0 nM to 200 nM. Pearson correlation and linear regression analysis are used to determine if the two variables (concentration of RNA oligos and the absorbance at 415 nm) are significantly linearly related.
Result
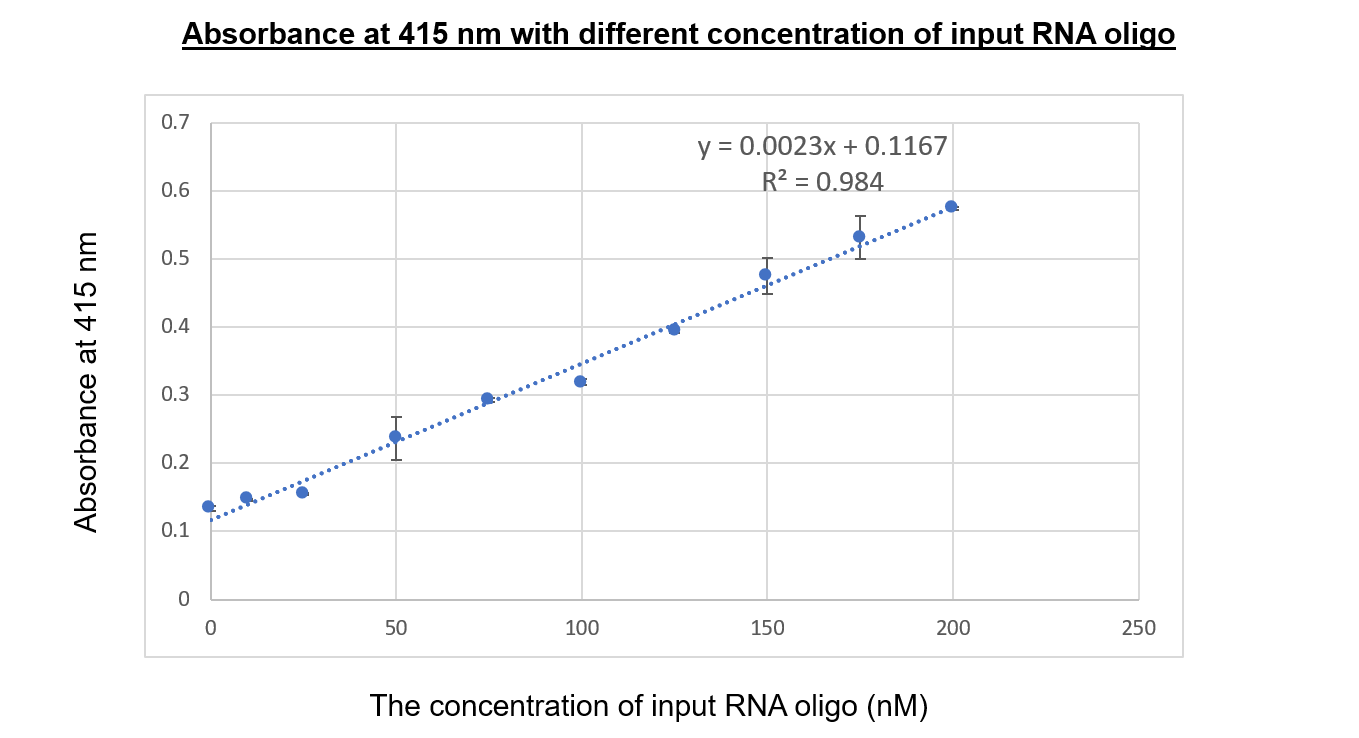
Using the linear regression analysis, the absorbance at 415 nm under different concentration (nM) of input RNA oligo is shown above with R2 = 0.984 and p < 0.05.
First, Pearson correlation analysis is used to measure the correlation between the concentration of RNA oligos and the absorbance at 415 nm.
H0: There is no relationship between the concentration of RNA oligos and the absorbance at 415 nm
H1: The concentration of RNA oligos and the absorbance at 415 nm are related
For the graph shown above, the two variables are positive correlated to each other with p value <0.05. Second, to test whether the absorbance is affected by the concentration of RNA oligos and to predict values of absorbance based on the concentration of RNA oligo, a linear regression analysis model is used.
H0: There is no prediction on absorbance at 415 nm by concentration of RNA oligos
H1: Prediction on absorbance at 415 nm can be obtained based on the concentration of RNA oligos
From the above graph, the information is as follow:
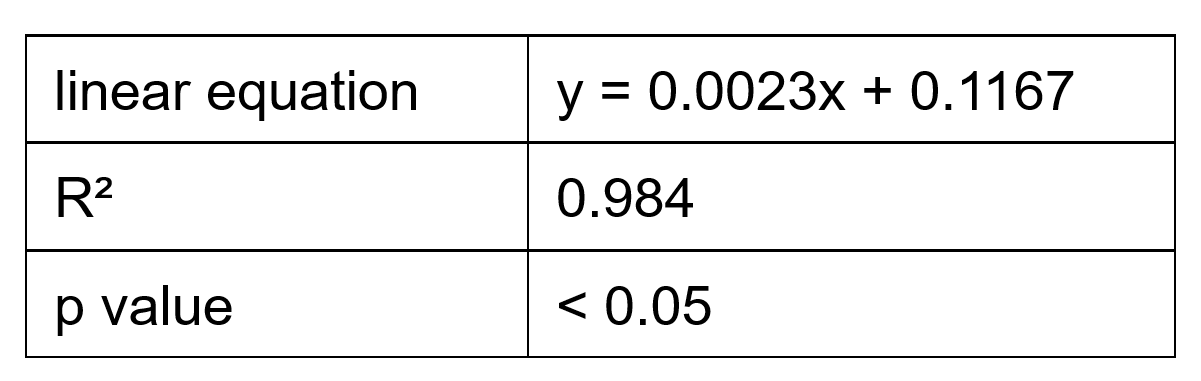
From the above result, normality test is passed. The null hypothesis of both Pearson correlation and linear regression are rejected after statistical analysis. The absorbance at 415 nm can be strongly predicted due to the change of concentration of RNA oligo with R2 = 0.984 and p value < 0.05.
Using the above information, the limit of detection (LOD) which indicates the smallest concentration of RNA oligos that can be reliably measured by an above procedure can be obtained.
The LOD is calculated as follows:
CLOD is the concentration LOD,
sylx : standard error of regression (SSE), and
b : slope of regression line.
The SSE obtained is 0.011212, the slope is 0.0023, thus the LOD is calculated as
3.3(0.011212) ÷ 0.0023 = 14.62 nM
As a result, the lowest concentration of RNA oligos which can be detected by our DNA nanostructure is 14.62 nM.


© IGEM HCYxLFC 2018 - All Rights Reserved.