Team:LZU-CHINA/Results
3.Exosome-booster stable cell line construction & function
4.miR attacker stable cell line construction and function verification
5.Functional verification of the induced promoter
RETURN TOP
On this page you can find out all the experiments result, including the results tested in the lab.

Parts and plasmid construct
1. Gel electrophoresis experiments
Here are some of the agarose gel electrophoresis results of our experiments when we construct parts:

Figure1. Three genes of exosome booster (hSDC4, Steap3, nadB) were detected by agarose gel electrophoresis. These three genes could help to enhance cell to secrete exosome.

Figure2. Here is a gel electrophoresis of three microRNAs we used as attacker to inhibit gastric cancer cell (miR-135b-3p; miR769-5p; miR-942-5p )

Figure3. Four inducible regulatory sequences (Biotin induced system: BirA-VP16; Hypoxia induction system: pHRE-miniCMV; Galactose inducing system: pGAL1; Tetracycline induction system: pTRE) are used to regulate microRNA and exsome booster expression.
2.Clones and plate
We transformed parts connected to pSB1C3 into E.coli DH5alpha, spread in chloramphenicol tablets and cultured it overnight under 37℃.

Figure4. It is a typical figure that bacterial clones were grown on chloramphenicol plate.
Exosome-booster stable cell line construction & function

1. Exosome-booster stable cell line construction

Figure5. PCDH plasmid with exosome booster and CopGFP reporting system was transfected into HEK293T cells stably, and fluorescence before and after transfection was detected by inverted fluorescence microscopy. Figure A is the HEK293T cells of the untransformed plasmid, while figure B is the HEK293T cells of the transformed exosome booster. It can be observed that transfected cells can be stimulated to produce intense fluorescence. Figure. C and D were the fluorescence images of the control group at 100 times (figure. C) and the experimental group (figure. D).
2. Transmission electron microscopy (TEM) detection
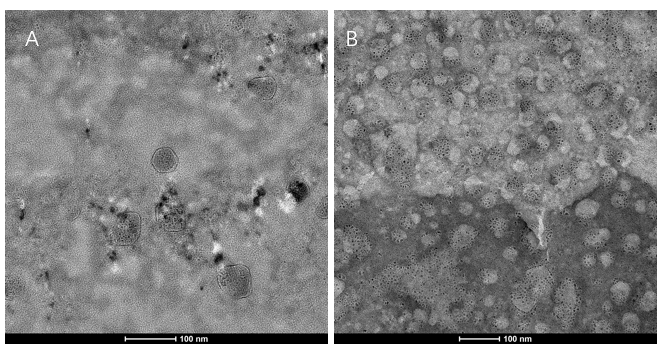
Figure6. We extracted exosomes from HEK293T cell and negatively stained it with phosphotungstic acid. Subsequently, we use TEM to detect it in 100nm. The experimental results demonstrated that HEK293T expressed exosome booster genes (figure B) could dramatically increase its exosome secretion compare with control cell (figure A)
3. NTA analysis

Figure7. The NTA analysis refers to the nanoparticle tracking analysis. The experimental results showed that HEK293T cell overexpressing exosome booster had significantly higher granules numbers at 100nm and 250nm than the control cell (about 23 times as much as the control cell). This indicates that exosome booster can increase the number of exosomes secreted by 293T cell.
4. Western Blotting to validate the expression of exosome booster genes
Protein sample extracted from engineering HEK293T cell was divided into two parts. One was used for staining to verify the presence of protein.

Figure8. The staining results indicated that the protein was extracted from engineering HEK293T cell. Another sample was used to do wester blotting to validate whether the exosome booster gene express or no.

Figure9. The WB result showed that all three exosome booster genes were successfully expressed in HEK293T. Because nadB is derived from bacteria, there's no corresponding antibody. We added 6 histidine at the 3 'end of the nadB's coding site and used histidine antibodies for its detection.
5. Confocal microscopy analysis of exosome uptake experiments

Figure10.To detect whether exosomes can enter gastric cancer cells, we used confocal microscopy to observe the uptake of gastric cancer cells MKN45 and SGC7901 exosomes. First, exosomes were extracted from 293T cells and stained with PKH26 exosomes (red fluorescent dye). The MKN45 and SGC7901 cells were stained with a FITC dye. Exosomes and gastric cancer cells were incubated together for 6 hours. Subsequently, the uptake of exosomes by gastric cancer cells was examined by fluorescence confocal microscopy. Figure. A and C indicate that gastric cancer cells MKN45 and SGC7901 can ingested exosomes. Figure. B and D showed the cytoskeletal structures of MKN45 and SGC7901 in gastric cancer cells detected by β-tubulin antibody.
miR attacker stable cell line construction and function verification

1. The transfection effect of miR overexpressing plasmid was detected by florescence

Figure11. miR-135b-3p overexpression vector was transfected into human embryonic renal epithelial cell line HEK293T, gastric cancer cell line MKN45 and SGC7901 through lentivirus. The cells were transfected by puromycin screening. Figure A-C shows the transfection efficiency through the mRFP reporting system under an inverted fluorescence microscope at 40 times objective lens. The results showed that miR-135b-3p expression plasmid was successfully transfected into cells and expressed. Figure D-F is the observation result under 100 times objective lens.
2. Using cell wound scratch assay to analyze cell migration

Figure12. We examined the effects of miR-135b-3p on gastric cancer cell lines MKN45 and SGC7901 through scratch test. It can be observed from the experimental results that the control gastric cancer cells almost healed after 24 hours of scratch, while miR-135b-3p significantly inhibited the migration ability of gastric cancer cell lines MKN45 and SGC7901.
3. Using CCK8 (Cell Counting Kit-8) experiment to detect cell proliferation.

Figure13. Because the cck-8 reagent can be reduced by dehydrogenase in the cell's mitochondria to form a highly water-soluble yellow formazan. The amount of formazan is directly proportional to the number of living cells. Therefore, we used cck-8 to detect the number of living cells. Because 450 nm is specific absorption peak of formazan, we used Abs 450 to detect formazan. The results showed that overexpression of miR-135b-3p could significantly reduce the number of gastric cancer cell MKN45.

Figure14. As shown in the previous experiment, overexpression of miR-135b-3p significantly reduced the number of gastric cancer cell SGC7901. The decline in the number of cells on the fifth day may be due to the depletion of nutrients in the cell culture medium.
4. Using transwell experiment to analyze cell invasion ability.

Figure15. The tanswell chamber is divided into two parts by polycarbonate film and matrix glue. Tumor cells were added to the upper compartment and culture medium was added to the lower compartment. Due to the high nutrient content of the lower compartment, tumor cells will pass through the matrix glue and migrate down the chamber. The results showed that overexpression of miR-135b-3p inhibited the invasion of gastric cancer cell MKN45.

Figure16. Cancer cells need to secrete protease to digest the stromal glue before they can pass through the compartment. We measured the number of cells in the lower chamber using the cck-8 reagent. The results show that overexpression of miR-135b-3p inhibited the invasion of gastric cancer cell SGC7901.
5. Flow cytometry(FCM) shows cell cycle was inhibited by miR-135b-3p

Figure17. The effect of overexpression of miR-135b-3p on the cell cycle of gastric cancer cell line MKN45 was analyzed by using flow cytometry. A complete cell cycle includes the M phase (cell division phase) and the interphase. Interphase is divided into phase G1 (early DNA synthesis), S (DNA synthesis) and G2 (late DNA synthesis). As we can be observed from this figure, the number of cells in the G1 phase of MKN45 cells overexpressing miR-135b-3p increased, while the number of cells in the G2 phase decreased. This indicated that miR-135b-3p affected the DNA synthesis of gastric cancer cell MKN45, i.e. S phase.
Functional verification of the induced promoter


To be able to regulate our exosome enhancement genes and expression genes. We designed different control systems. The hypoxia-inducible regulatory system regulates three exosomes. The biotin-inducing system regulates the expression of miR-135b-3p. The tetracycline induction system regulates miR-942-5p.The galactose regulatory system regulates miR-769-5p.Hypoxia induction system was constructed in HRE293T and MGC803 cells, and biological induction regulation system was constructed in 293T cells.
1. Detection of pHRE promoter

Figure18. We tested the induced expression of pHRE (5 reapts) with CopGFP. CoCl(II) is used to create anoxic conditions. The effect of pHRE in HEK 293T cells was detected in the left image, and the experimental results showed that the fluorescence intensity of CopGFP gradually increased with the increase of CoCl(II) concentration. At the concentration of 500uM, the fluorescence intensity decreased significantly. This is the result of high concentrations of CoCl(II) inhibiting cell activity. A similar effect was observed in MGC803 cells. In addition, the fluorescence intensity of MGC803 is generally lower than that of HEK293T, which may be due to the poor expression efficiency of MGC803 as a differentiated cell.
2. Detection of biotin inducible system

Figure19. The function of biotin-inducing system was tested by HEK 293T. We first stably transfected the vector that expressed birA-VP16 gene driven by pEF1a promoter into HEK 293T cells. The plasmid with the O-miniCMV-mRFP element is then transferred to the engineering 293T cells. The result of the left figure is that the mRFP expression level of engineered HEK293T cells was measured at 4h under different biotin concentrations. At the same time, fluorescence intensity of mRFP was measured at different times at the concentration of 100uM biotin (right figure). From the experimental results, the mRFP fluorescence intensity gradually leveled off at when incubated for about 40 hours.
Reference
1.Sipponen, P., Kekki, M., Haapakoski, J., Ihamäki, T., & Siurala, M. (2010). Gastric cancer risk in chronic atrophic gastritis: statistical calculations of cross-sectional data. International Journal of Cancer,35(2), 173-177.
2.Zhu, Z. (2018). [2017 hotspots review and outlook on gastric cancer surgery in china]. Zhonghua Wei Chang Wai Ke Za Zhi, 21(1), 7-14.
3.Zhang, Z. Y., Zheng-Qi, W. U., & Wang, H. J. (2009). An analysis of gastric cancer detection and epidemicity in high incidental area with gastric cancer,wuwei city,gansu province. China Cancer, 19(3), 194–201.
4.Chan, S. L., & So, J. B. (2016). Gastric cancer therapy.
5.Xing, X., Guo, J., Wen, X., Ding, G., Bo, L., & Dong, B., et al. (2017). 6.Analysis of pd1, pdl1, pdl2 expression and t cells infiltration in 1014 gastric cancer patients. Oncoimmunology, 7(3), e1356144.
7.Xing, X., Guo, J., Wen, X., Ding, G., Bo, L., & Dong, B., et al. (2017). 8.Analysis of pd1, pdl1, pdl2 expression and t cells infiltration in 1014 gastric cancer patients. Oncoimmunology, 7(3), e1356144.
9.Microenvironmental pH is a key factor for exosome traffic in tumor cells J. Biol. Chem., 284 (2009), pp. 34211-34222
10.Mosesson, G.B. Mills, Y. Yarden Derailed endocytosis: an emerging feature of cancer Nat. Rev. Cancer, 8 (2008), pp. 835-850
11.Lespagnol, A. et al. Exosome secretion, including the DNA damage-induced p53-dependent secretory pathway, is severely compromised in TSAP6/Steap3-null mice. Cell Death Differ. 15, 1723–1733 (2008).