Team:Macquarie Australia/PartsValidation
The chlorophyll A biosynthesis pathway was built from two composite parts. Assembly was confirmed by restriction enzyme digest and sequencing.
This large 9.3kB biobrick of 5 genes is the 1st step of the Chlorophyll biosynthesis pathway. Standard assembly of trc-ChlI1-ChlI2-ChlD and trc-ChlH-GUN4 was performed in a CAM biorick backbone. The single and double digest of this Mg-chelatase plasmid is shown in lanes 2 and 3 of Figure 1, respectively.
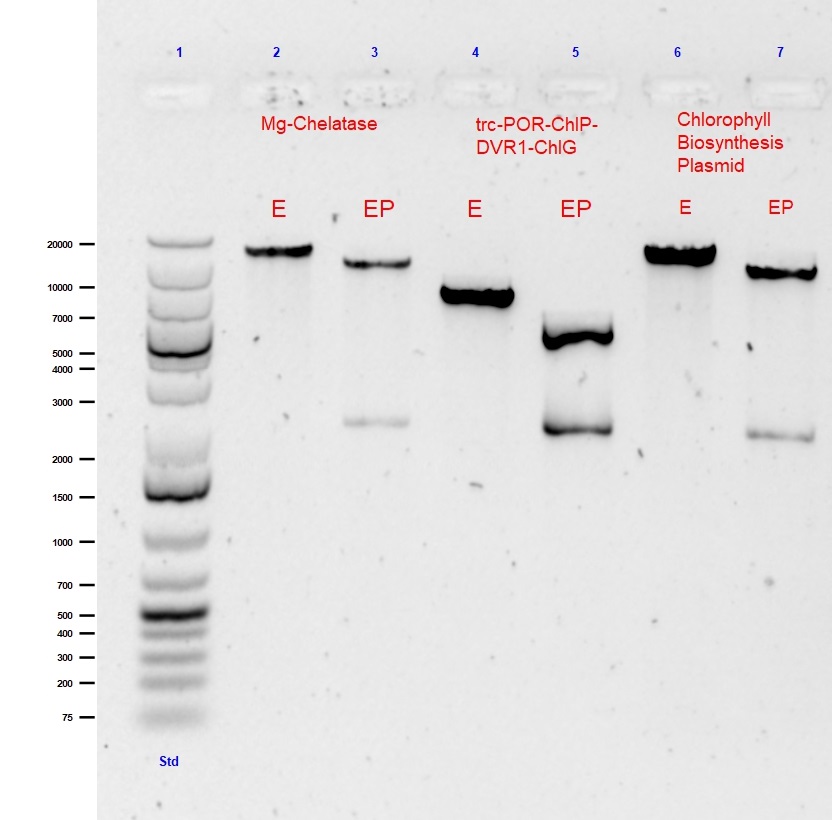
Fig. 1 Agarose gel (0.5%) electrophoresis with GelRed of single (EcoR1) and double (EcoR1 with PstI) digests of submitted composite parts: Mg-Chelatase plasmid (9513bp), trc-POR-ChlP-DVR1-ChlG (4604bp) and Chlorophyll A Biosynthesis pathway (18352bp).
Using a fluorescence spectroscopy assay we checked for production of Mg-PPIX using our induced Mg-chelatase plasmid. The sample was excited with an excitation wavelength of 420nm. Purified proteins of Mg-chelatase (provided by our advisor Professor Robert Willows) was used as a positive control. A peak appearing at 595nm shows successful production of Mg-PPIX, as demonstrated by our positive control (Figure 2). We assayed our induced Mg-chelatase plasmid by adding purified individual protein subunits of Mg-chelatase to see if the expression of any individual gene was limiting. No added individual protein subunit demonstrated an enhancement on the expression of our Mg-PPIX using our Mg-chelatase plasmid. We proceeded to test with adding higher concentrations of ChlI1 and ChlD. This yielded similar results. Our findings are also supported by the qPCR expression results provided by our collaboration with NTU iGEM team that showed an almost complete lack of expression of our genes before and after induction compared to the chloramphenicol control See here. We are continuing to investigate the reasons for this unexpected lack of expression.

Fig. 2 Fluorescence spectroscopy assay of Mg-Chelatase verified proteins (Positive control). Excitation is at 420nm was used to view Mg-PPIX formation. Mg-PPIX was seen at a wavelength of 595nm.
The second large 4.7kB biobrick construct called “PPDG” was created as the final part of our Chlorophyll A biosynthesis. This composite part was created to convert photoxidative PChlide to Chlorophyll A. This part allows for stability of our light triggered vesicle formation system. This part was formed using Standard assembly of trc-POR-ChlP and DVR1-ChlG into a CAM backbone.The single and double digest of this trc-POR-ChlP-DVR1-ChlG plasmid is shown in lanes 3 and 4 of Figure 1, respectively.
The final construct is the assembly of the whole “CBP Biobrick”. It 18.3kB composite part, pieced together using all 14 genes into the CAM backbone. This part was formed using Standard assembly of previously assembled Mg-chelatase plasmid BBa_K2664006 and lac-CTH1-ycf54-ChlM-trc-FNR-fdx-trc-POR-ChlP-DVR1-ChlG plasmid BBa_K2664007.The single and double digest is shown in lanes 6 and 7 of Figure 1, respectively.
The POR gene with the trc promoter showed a high level of inducible expression by IPTG within the KAN backbone (Figure 3). The POR protein is seen clearly at the expected size of 40 kDa. This result validates the expression of POR under the new trc promoter.

Fig. 3 SDS-PAGE gel of trc-POR overexpression with IPTG. POR was identified at 40kDa in both soluble lysate (Lane 3) and insoluble pellet (Lane 4).
Protochlorophyllide (Pchlide) was extracted from barley (Figure 3) and used as a substrate for to assess the function of the expressed POR. The barley extracted Pchlide was added to the lysate of the IPTG induced- E.coli containing the trc-POR construct. The mixture was incubated for varying times (0 to 30 mins) then placed in a spectrophotometer. As shown in Figure 4, an absorbance at 627-630 nm shows the presence of protochlorophyllide. An absorbance peak at 665-670 nm would be expected for POR activity but this could not be seen.We believe a lack of a POR peak at 665-670nm may be due to the presence of other cell proteins in the crude cell lysate that interfere with our assay. Literature on this assay has stated that the assay requires purified POR protein (Townley et al, FEBS Letters 422: 19-22 1988). We continue to work on the purification of our expressed protein using chromatography methods.

Fig. 4 UV vis spectrum of our purified protochlorophyllide from barley. Protochlorophyllide is observated at a peak of 437nm and a maxima of 1.8.


