Excess soluble phosphates are the result of excess Bacillus subtilis (and other phosphate solubilizing bacterias) in soil. Bacteriocins present a natural and effective way of inhibiting growth of B. subtilis, but we must first know how fast the B. subtilis in soil is growing as well as how much to kill. To start, we researched the growth of B. subtilis, as well as bacteria in general, to get an idea of how our target grows in soil. As we were unable to find any literature that specifically models the growth of bacteria in soil, we decided to create a modified basic growth curve of B. subtilis by considering the most important soil factors that would affect its growth. After consulting with soil microbiomes expert Professor Young of National Chung Hsing University, we determined the factors that influence B. subtilis growth the greatest are temperature, pH and salinity. To model the effects that these different conditions have on B. subtilis growth, we observed the relationship between each individual factor (Temperature, pH, and Salinity) and B. subtilis.
Team:NCTU Formosa/Dry Lab/Growth Model


Temperature to Bacteria Growth Curve
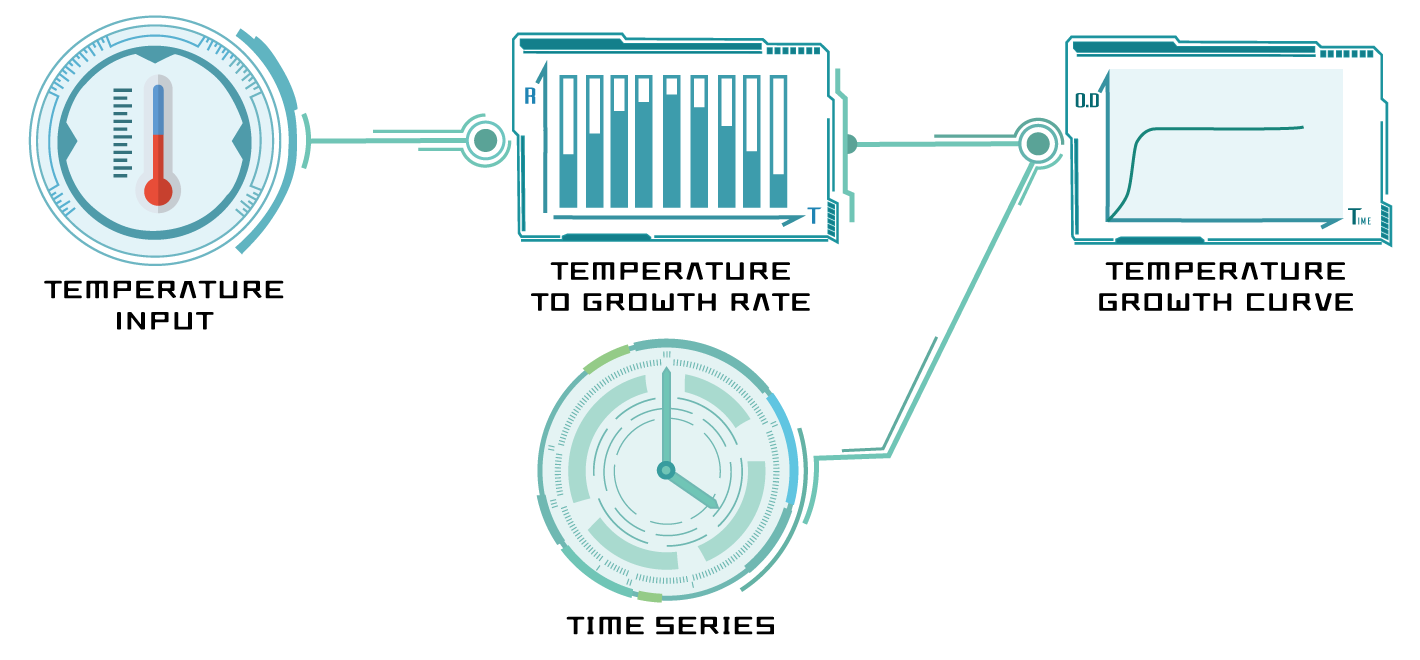
For temperature, we began with the Ratkowsky equation, which describes effect of temperature on general bacterial growth rate, modeled as
To simulate the growth of B. subtilis under certain conditions, we use Logistic regression function here
Then we combine the growth rate under certain condition with Logistic regression function
Symbol |
Unit |
Explanation |
|---|---|---|
$R_{temp}(T)$ |
[O.D.600nm/sec] |
Bacterial growth rate under different temperature |
$T$ |
[K] |
The input temperature value |
$T_{max}$ |
[K] |
Maximum heat resistance |
$T_{min}$ |
[K] |
Minimum heat resistance |
$t$ |
[min] |
Time |
$A$ |
[O.D.600nm/sec] |
Initial bacterial growth rate |
$B$ |
[O.D.600nm/sec] |
Maximum bacterial growth rate |
$C$ |
[O.D.600nm] |
Maximum amount of bacteria under certain conditions |
To modify this curve into a B. subtilis-specific model, we cultured B. subtilis under different temperatures to identify the unknown parameters a and b.
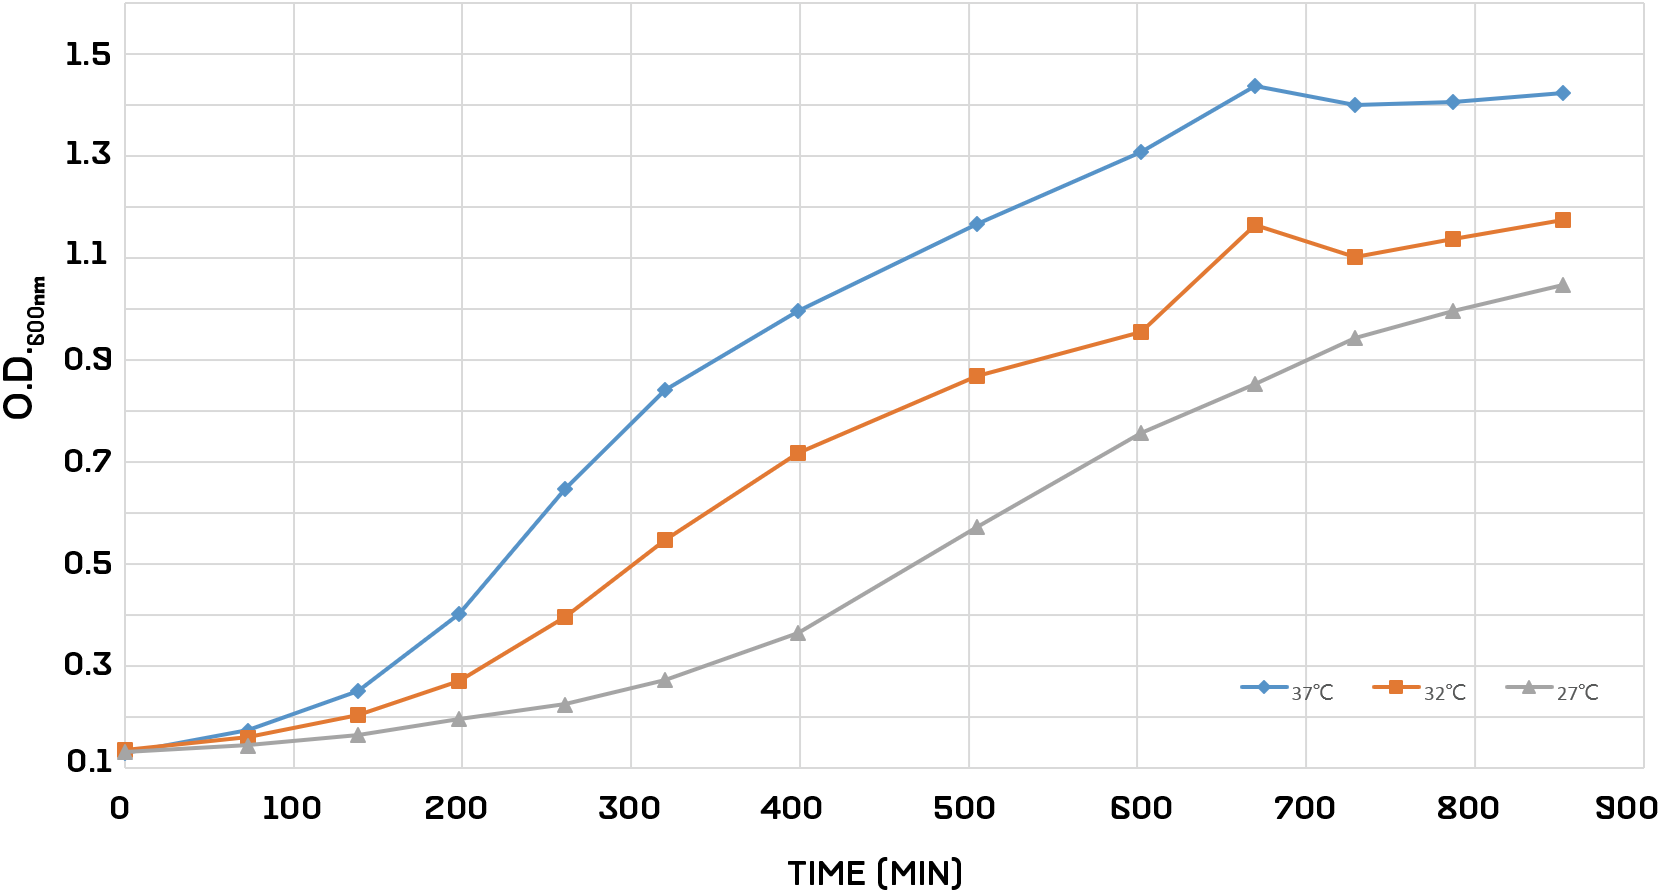
From this, we got the parameters a and b
Our final equation models how B. subtilis grows under different temperature conditions.
pH to Bacteria Growth Curve
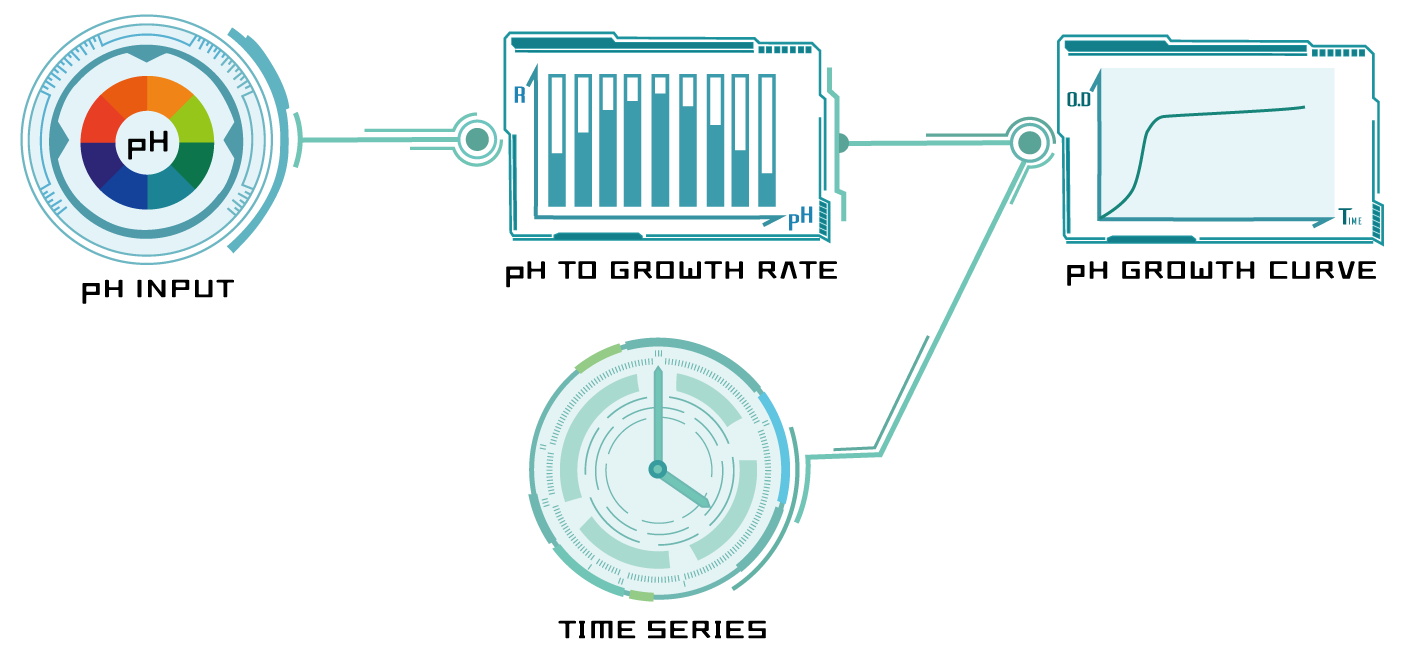
As with temperature, the pH model began as a general equation describing bacterial growth rate under different pH values. We started with the cardinal pH equation
To simulate the growth of B. subtilis under certain conditions, we use Logistic regression function here
Then we combine the growth rate under certain condition with Logistic regression function
Symbol |
Unit |
Explanation |
|---|---|---|
$pH$ |
None |
The input pH value |
$pH_{max}$ |
None |
Maximum pH value resistance |
$pH_{min}$ |
None |
Minimum pH value resistance |
$pH_{opt}$ |
None |
Optimized pH value |
$t$ |
[min] |
Time |
Again, we cultured B. subtilis in different pH solutions to find the parameter values specific to our target.
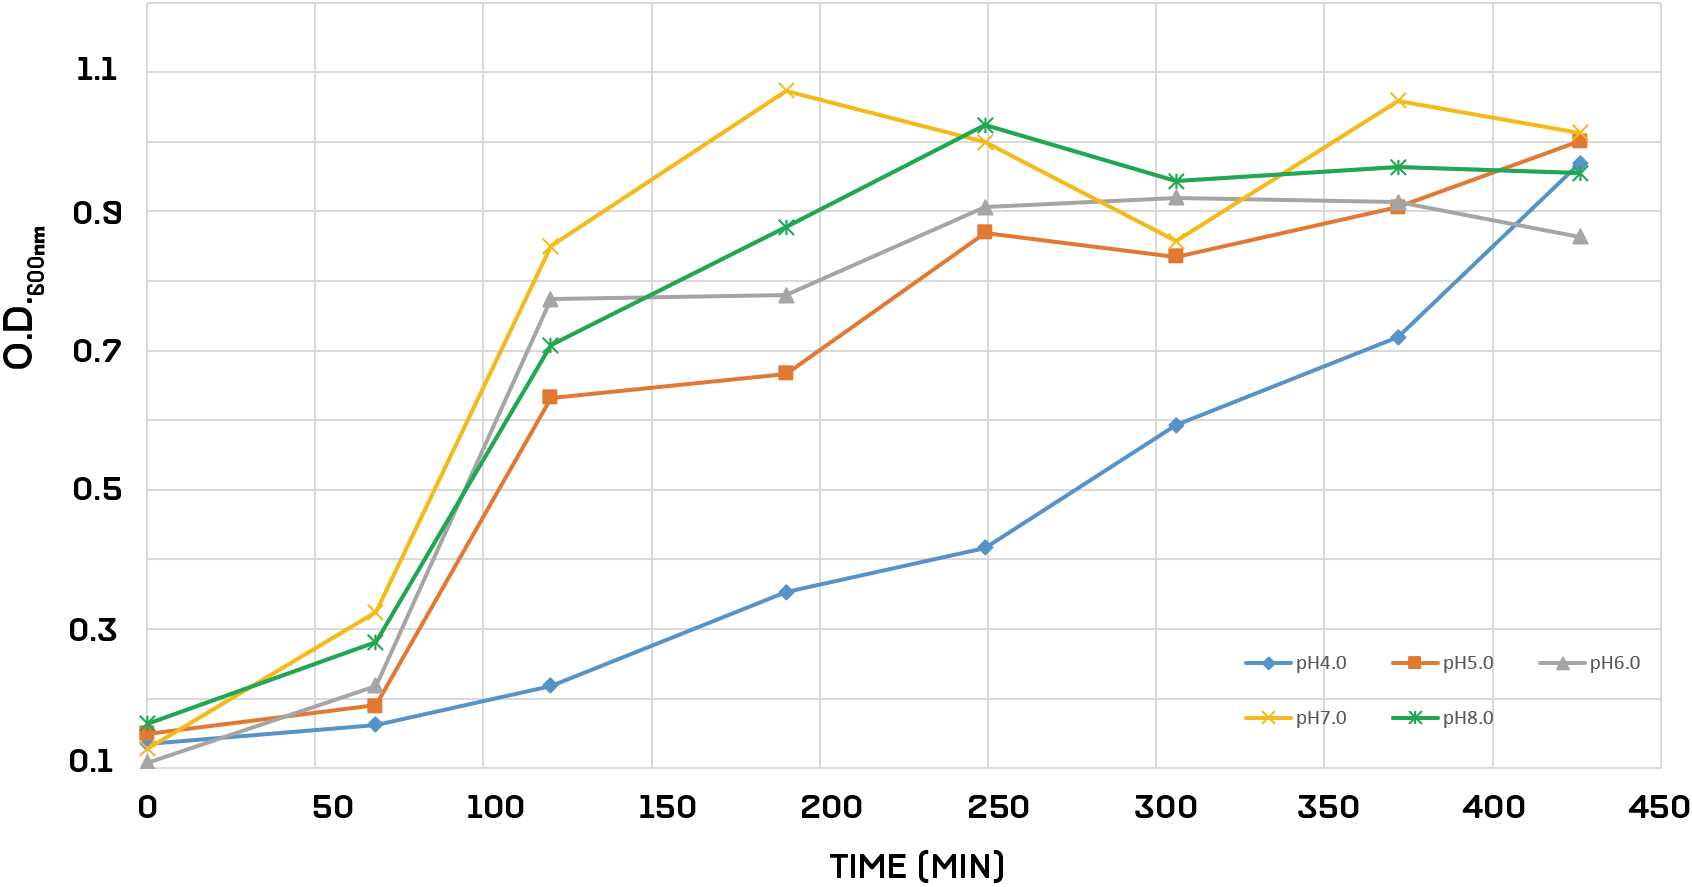
From this, we got the parameters c, d, and e
This model accounts for any effects that changes in pH may have on B. subtilis growth in soil.
Salinity to Bacteria Growth Curve
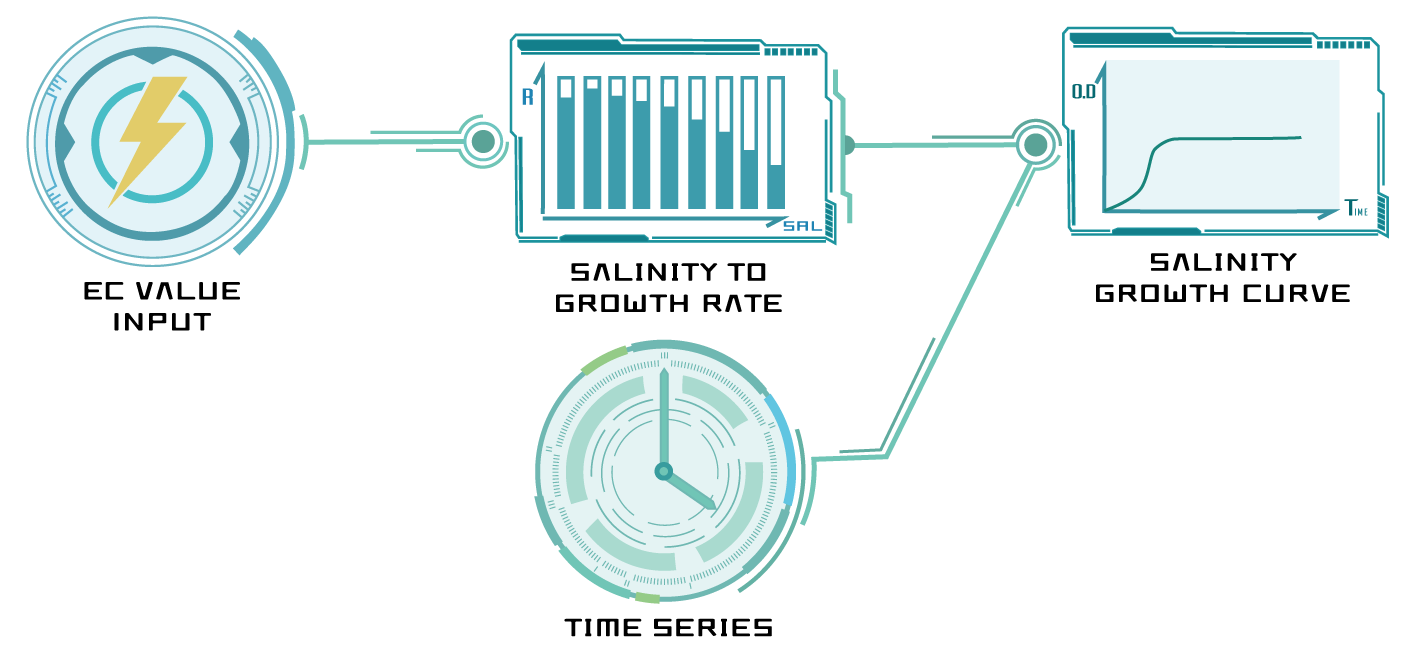
For salinity, we discovered that a simple logistic growth curve was enough to serve as our base equation. According to our references, we derived the equation describing bacterial growth rate under different salinity, model as
To simulate the growth of B. subtilis under certain conditions, we use Logistic regression function here
Then we combine the growth rate under certain condition with Logistic regression function
Symbol |
Unit |
Explanation |
|---|---|---|
$sal$ |
[mM] |
The input salinity |
$t$ |
[min] |
Time |
Culturing B. subtilis in different salinities to yield the specific parameters in salinity equation.
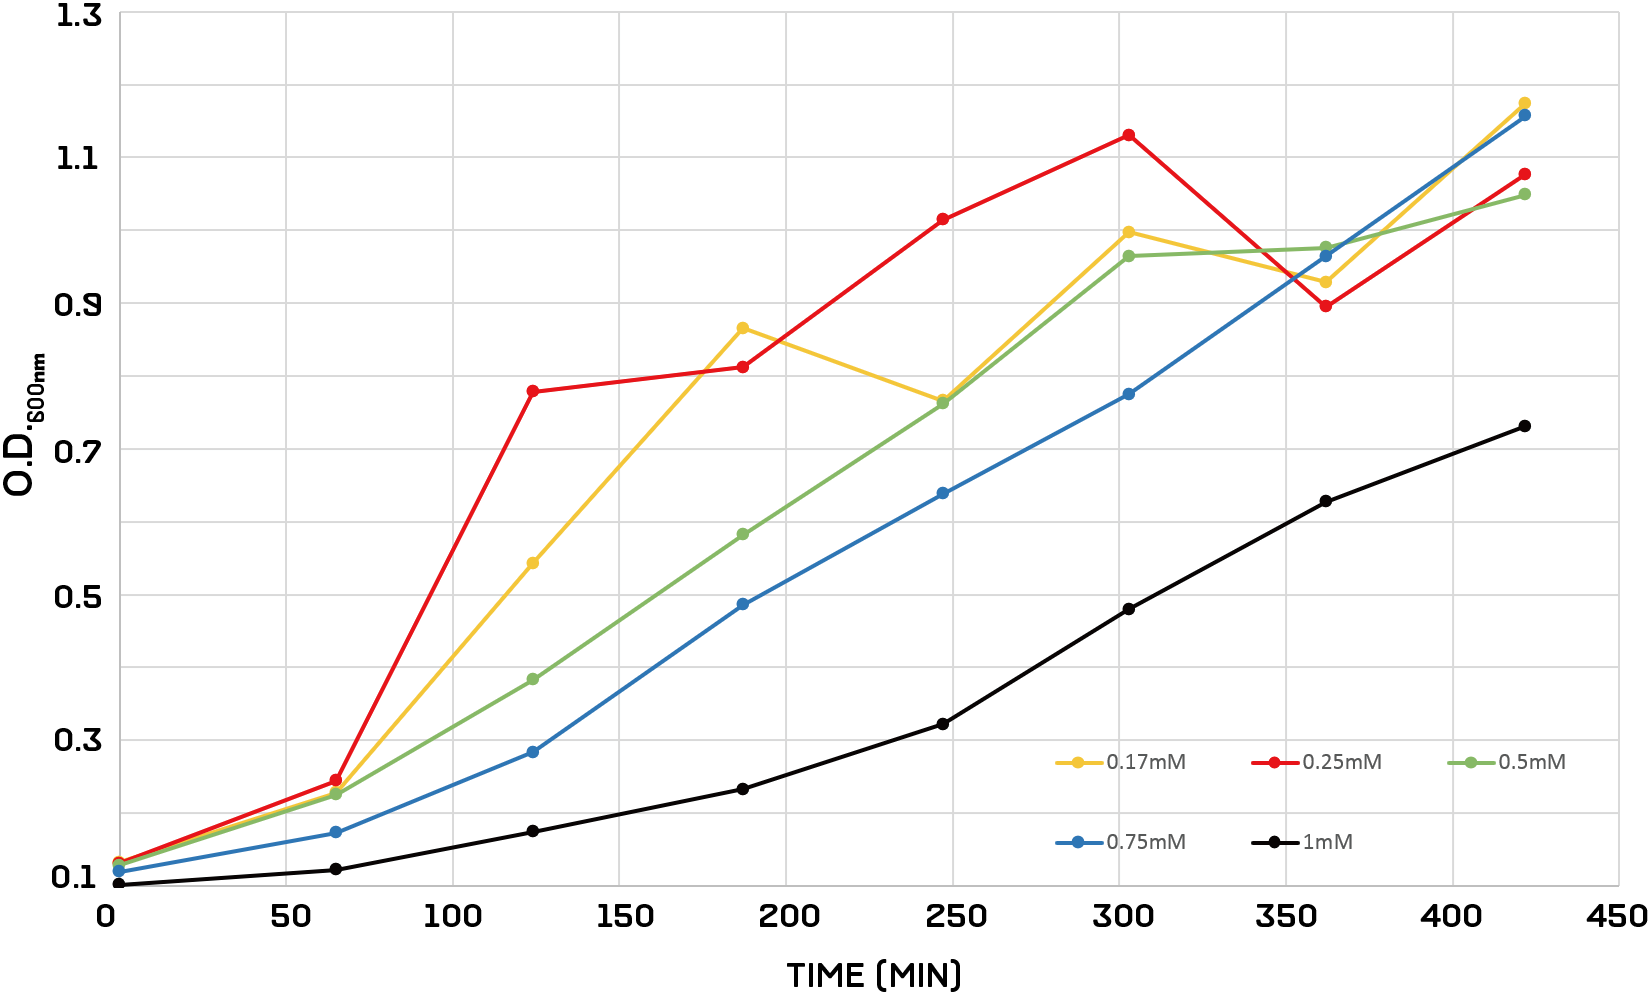
Thus, we got the parameters as following
This yields the final piece of our bacterial soil growth model, and explains any consequences of shifts in salinity of our soil.
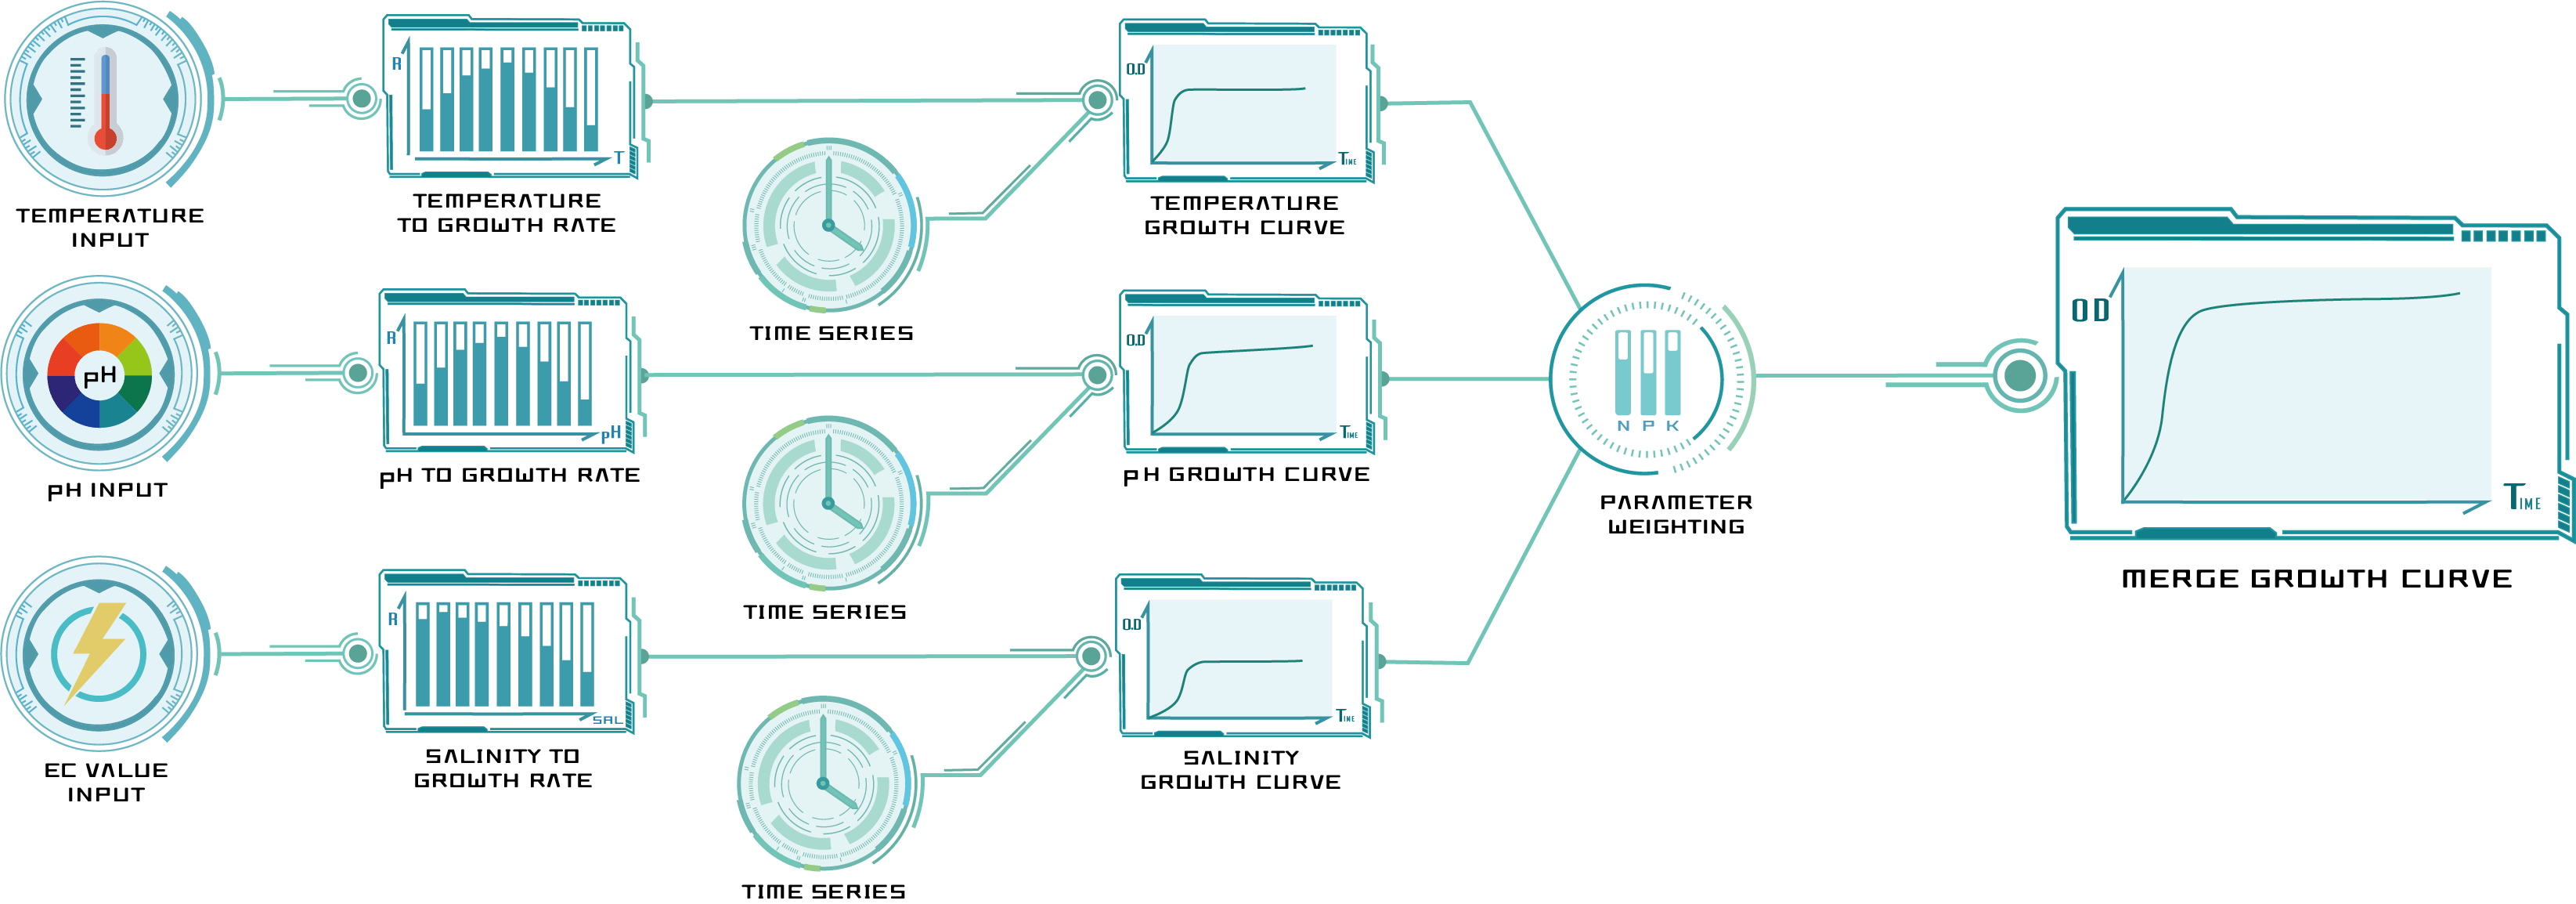
Complete Growth Curve Model
With our three factors all accounted for, we needed to identify the weights of each factor ($\alpha,\beta,\gamma$) before merging the equations we found into one model. To do this, we randomly selected 3 sets of different temperature, pH and salinity.
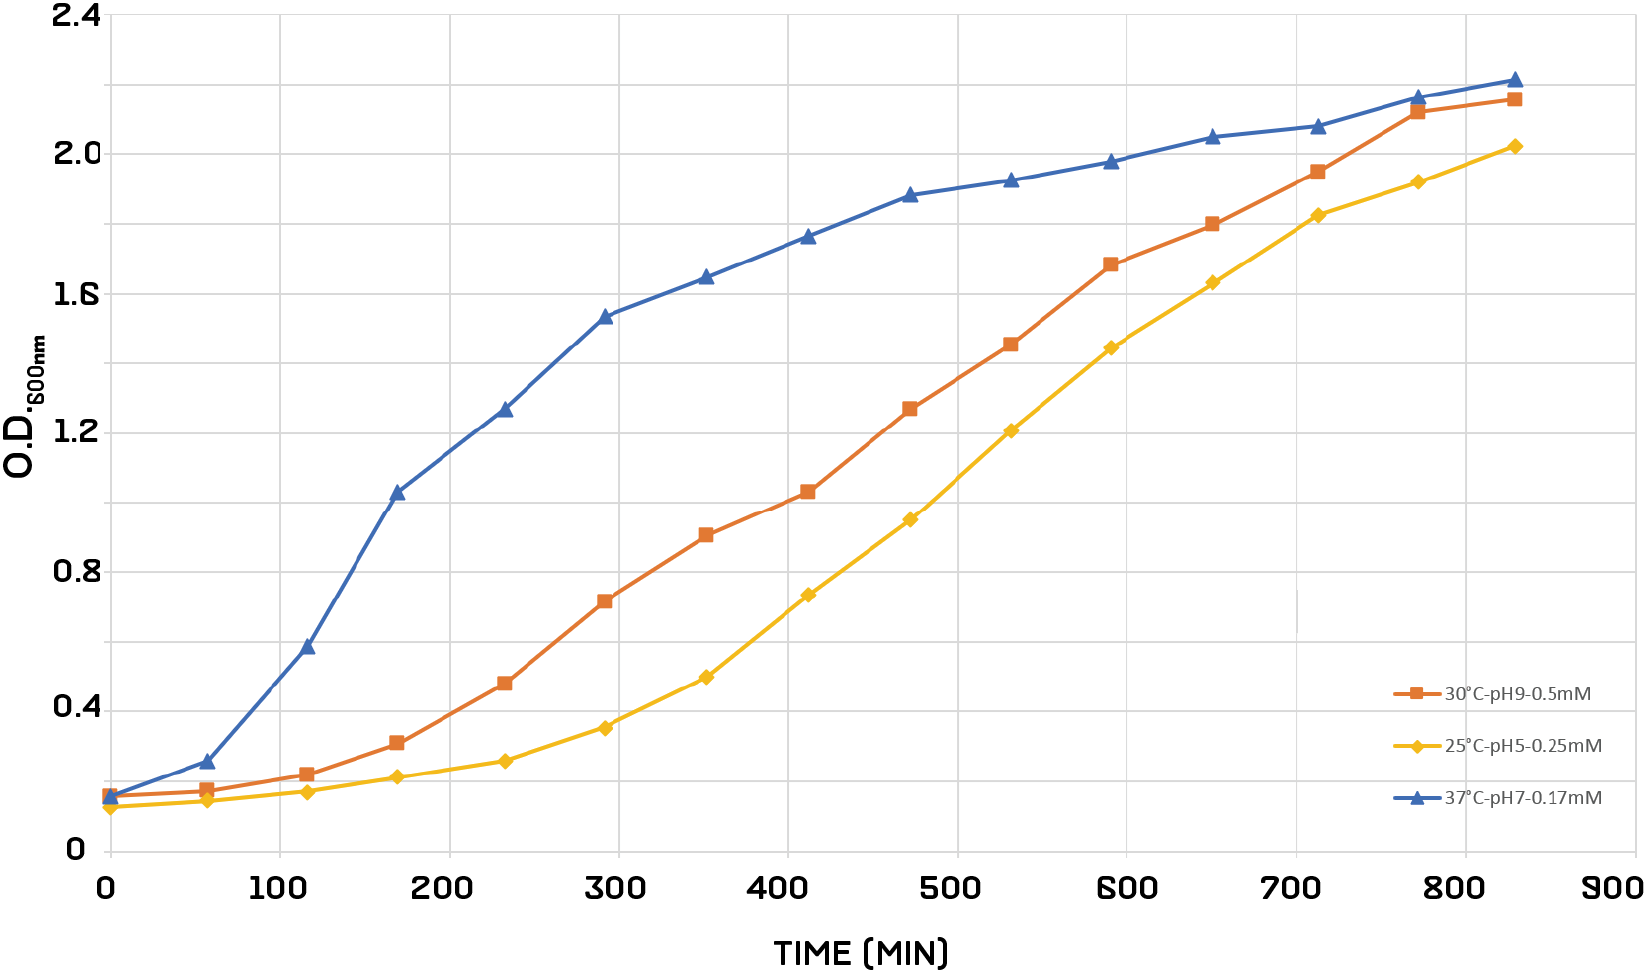
Finally, we input the growth results into Simulink program, model as
Through this we could determine how much impact each factor has on B. subtilis growth relative to the other two factors and adjust the parameters accordingly. Our resulting combined model has the ability to predict B. subtilis growth rate under a wide range of temperature, pH and salinity.
Bacteriocin Inhibition Prediction Model
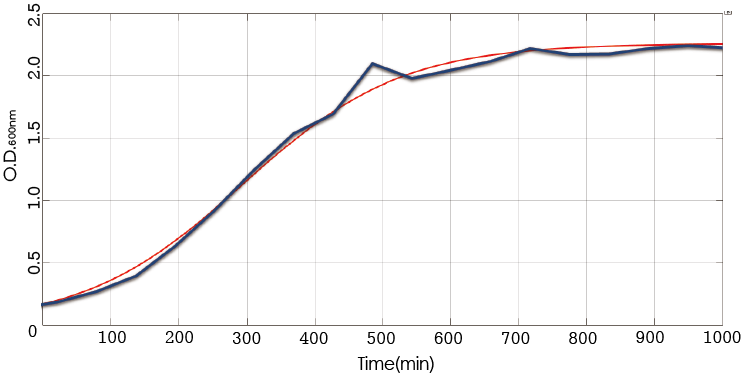
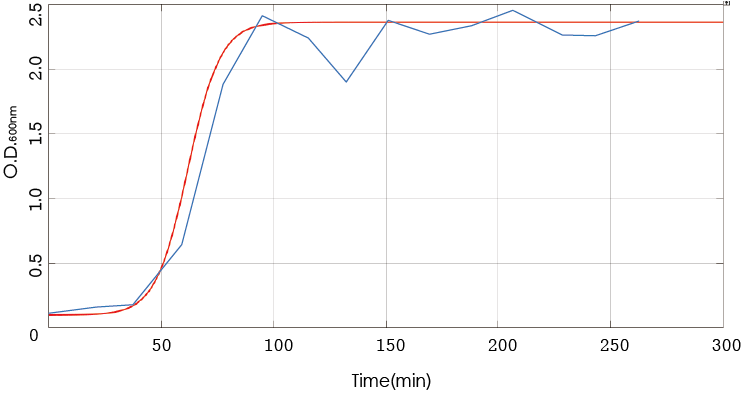
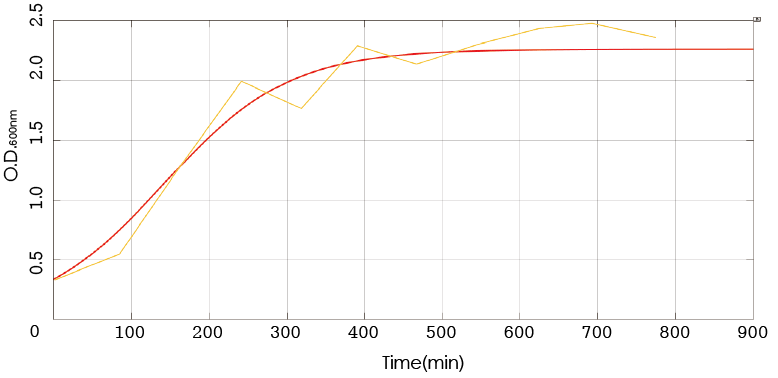
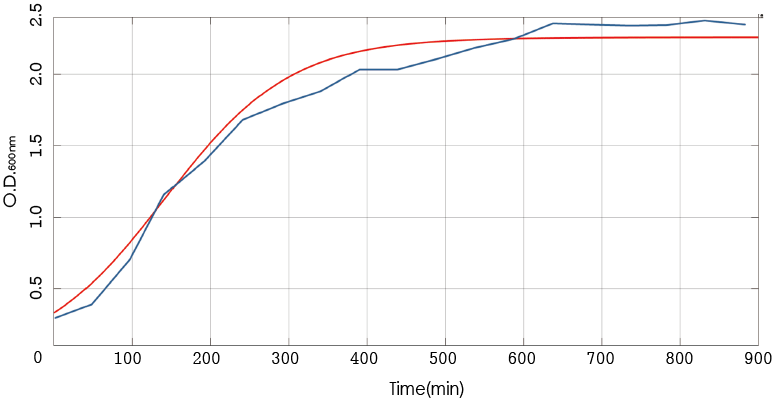
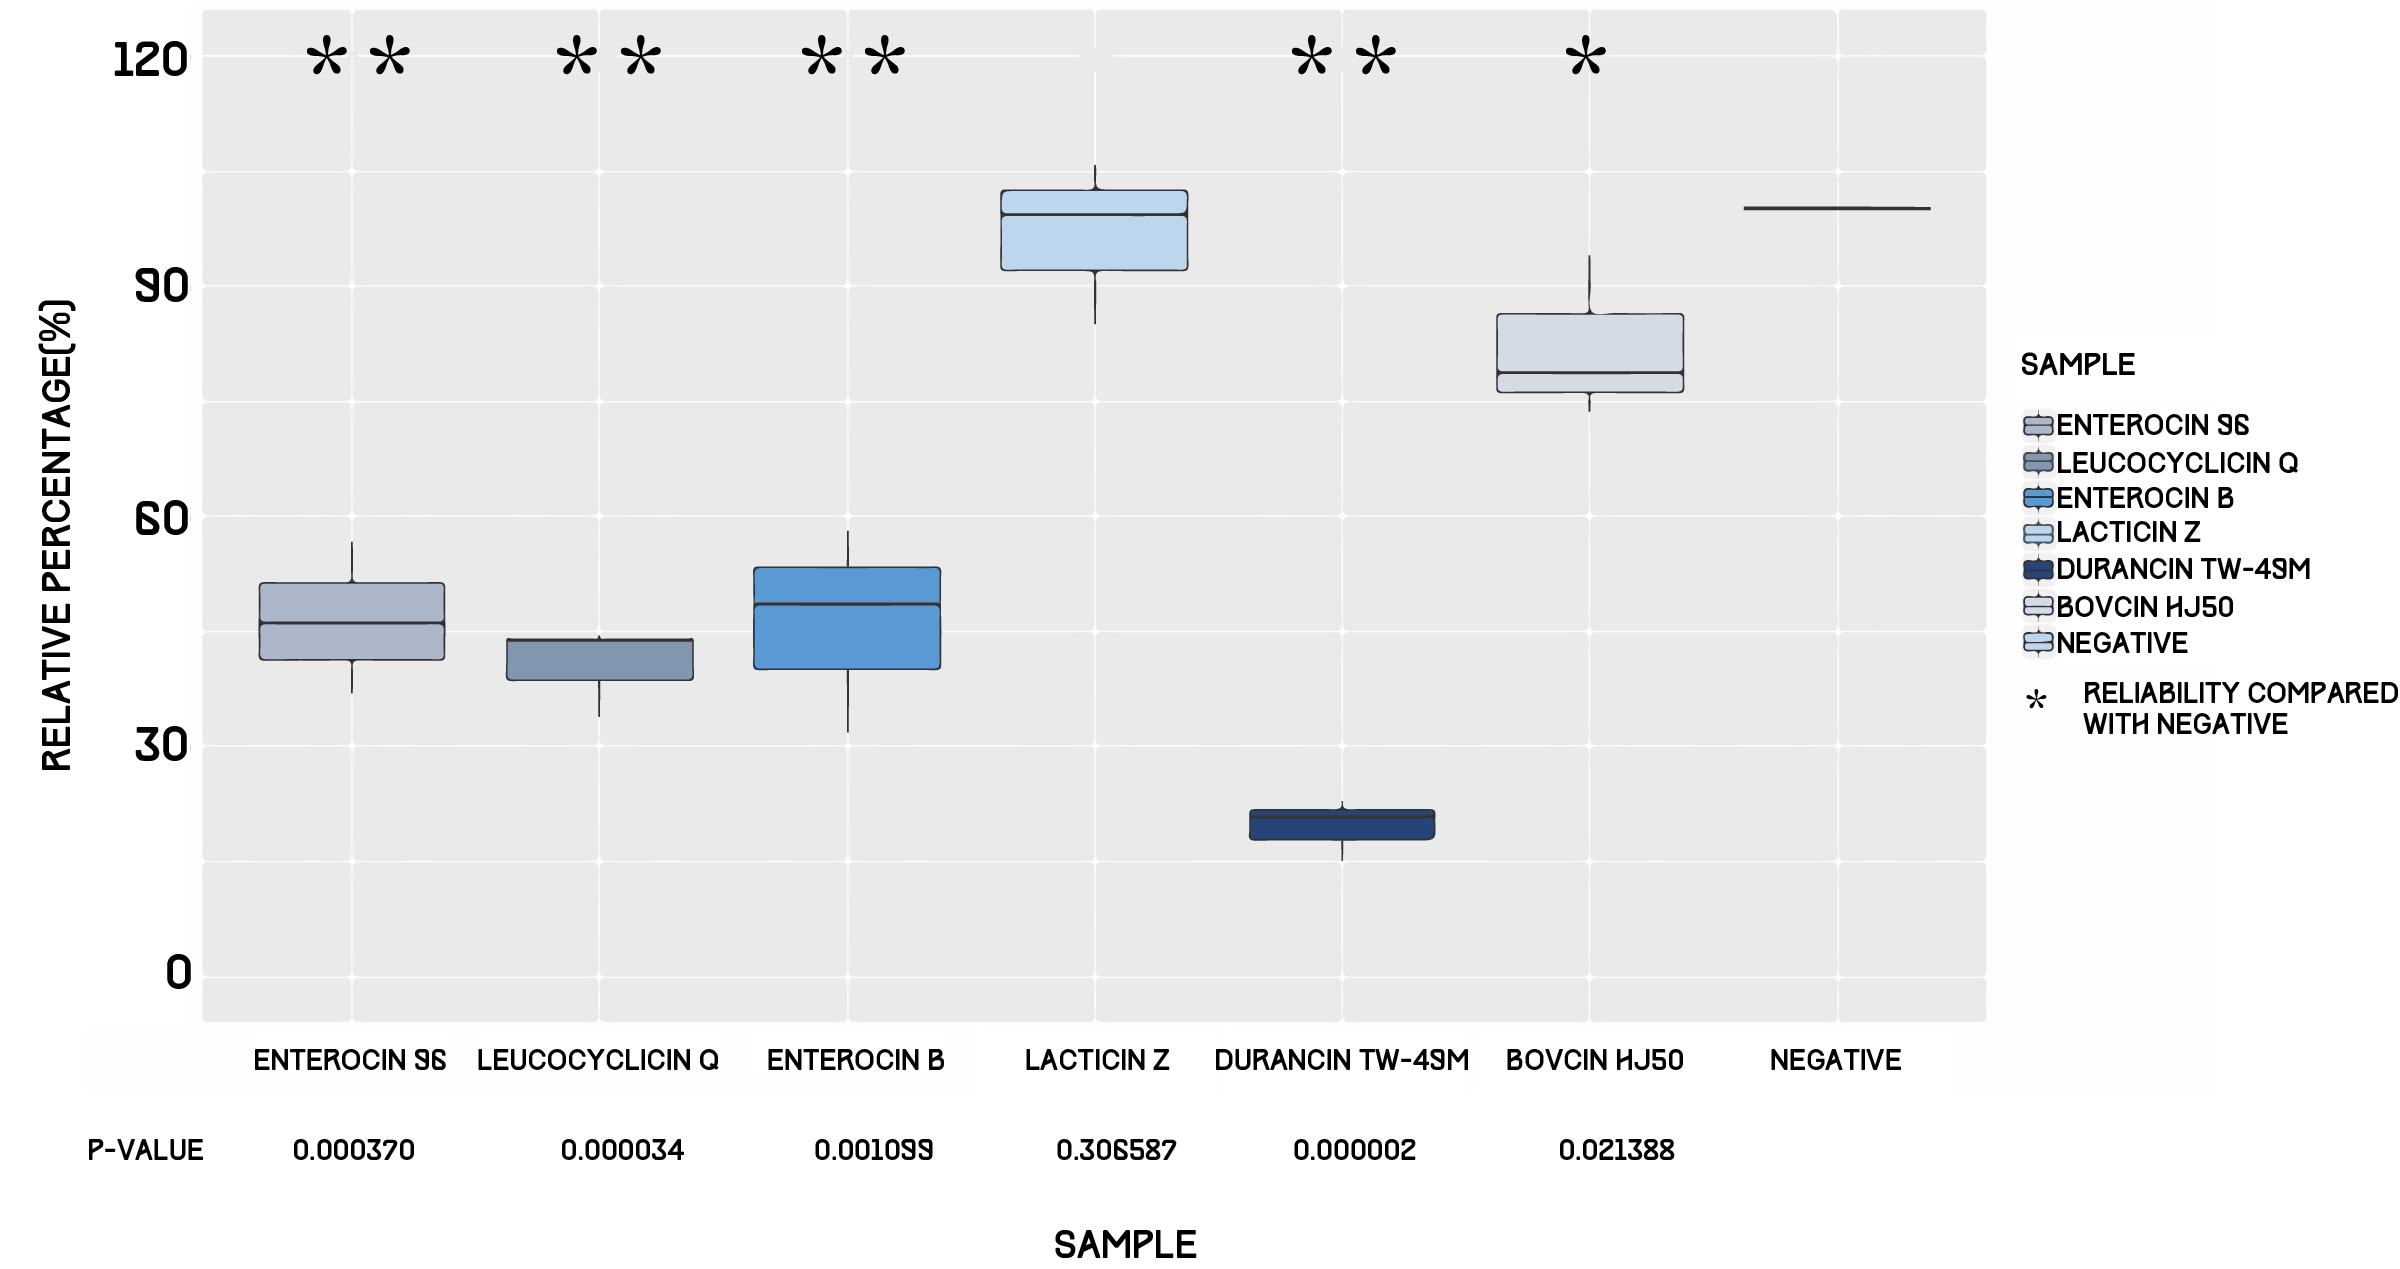
Once we finished assessing the functionality of our bacteriocins, it was time to model the relationship between concentration of antimicrobial peptide and amount of B. subtilis inhibited. From our Functional Analysis experiments, we were able to produce a predicted curve of B. subtilis – that is, how B. subtilis would grow when we added a theoretical amount of bacteriocins to the medium. We then prepared four concentrations of Enterocin 96 and added them to medium, using three sets of results to calibrate the rough model. Finally, we graphed the calibrated curve below and overlaid the fourth set of data. The results indicate that our prediction of bacteriocin effect is quite accurate. With this, we are able to know exactly what concentration of bacteriocin to use to inhibit a desired amount of B. subtilis in soil.
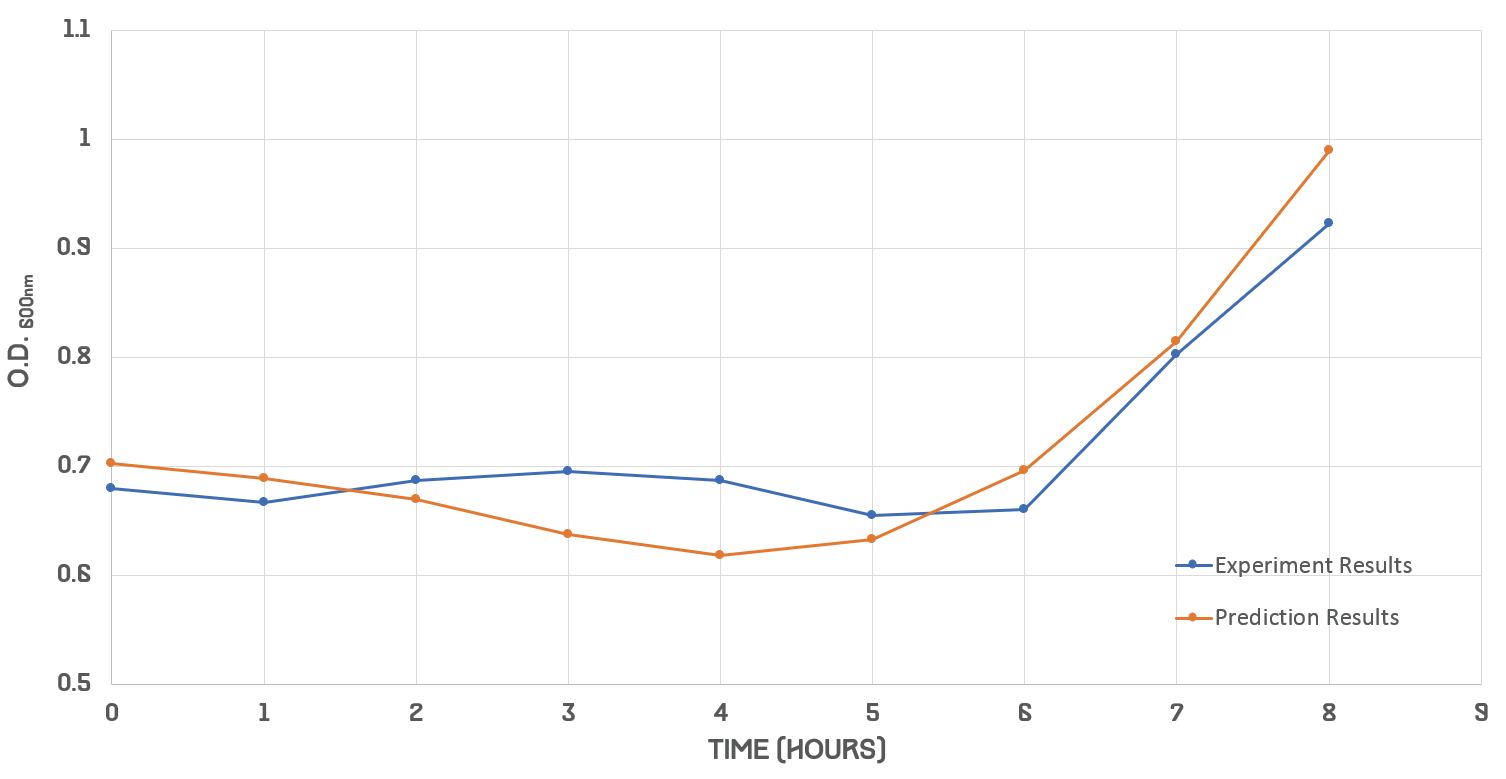
After calibrating our model from experiment datas, this test result shows high accuracy of prediction.
References
1. Ishimine, Y., et al. (2004). "Effects of planting date on emergence, growth and yield of turmeric (Curcuma longa L.) in Okinawa Prefecture, Southern Japan." 48(1): 10-16.
2. Krulwich, T. A., et al. (1985). "Buffering capacity of bacilli that grow at different pH ranges." Journal of Bacteriology 162(2): 768-772.
3. Lambert, R. J. (2011). "A new model for the effect of pH on microbial growth: an extension of the Gamma hypothesis." J Appl Microbiol 110(1): 61-68.
4. Ratkowsky, D. A., et al. (1983). "Model for bacterial culture growth rate throughout the entire biokinetic temperature range." J Bacteriol 154(3): 1222-1226.
5. Rousk, J., et al. (2011). Bacterial Salt Tolerance is Unrelated to Soil Salinity Across an Arid Agroecosystem Salinity Gradient.