Team:NEU China B/Model


Modeling
Mathematical Model
Overview
In the following article, we described the process of building our model. During the construction, we aimed to build a model by combining the data fitting principle in mathematical modeling with the help of MATLAB through multiple experiments, and obtain a relatively successful fitting formula after multiple optimizations, so as to reflect the data trend reasonably.
During the experiment, we firstly controlled the consistency of the concentration of the bacterial liquid to reduce the experimental bias. There were 3 groups of experimental statistic, we recorded three kinds of variables: the independent variable —concentration of lactic acid ([lactate]),time of reaction (t), the dependent variable —intensity of fluorescence (Fluorescence). On the basis of reasonable hypothesis and correlative coefficient test, according to the fitting of known data, we got the functions and function curves that could reflect data trend reasonably. These curves illustrated the functional relationship between the fluorescence intensity of the dependent variable and the independent variable.
How do we derive this model?
(1) According to some reasonable assumptions given in professional knowledge, we believed that function got according to data may be a non-linear function between the dependent variable and the independent variable, since the addition of lactate and IPTG would tend to influence the growth rate of the organism, and the lactate into the cell and the AI-2 generated by the Luxs catalysis also need to be of a certain and unequal time, so that the whole reaction process did not constitute linear function requirements. So we hypothesized that they are polynomial functions.
(2) Under each reasonable hypothesis, MATLAB was used to perform corresponding fitting. According to the correlative coefficient R to test the fitting effect, the fitting function formula that reasonably reflected the data trend can be obtained after continuous optimization.
T7- lldPRD operon promoter-GFP
[IPTG]=1 mM
t=0 min Relative Fluorescence= 1.496 t^3 - 8.148 t^2 + 10.31 t + 8.919 R2= 0.1473
t=5 min Relative Fluorescence= 9.304 t^3 - 49.68 t^2 + 63.56 t + 22.25 R2= 0.9464
t=10 min Relative Fluorescence= 1.286 t^3 - 12.36 t^2 + 19.78 t + 29.03 R2= 0.9986
t=20 min Relative Fluorescence= 17.26 t^3 - 83.37 t^2 + 96.5 t + 19.91 R2= 0.9957
t=30 min Relative Fluorescence= 9.669 t^3 - 48.15 t^2 + 58.23 t + 39.34 R2= 0.8645
t=60 min Relative Fluorescence= 20.96 t^3 - 106.2 t^2 + 134.9 t + 42.16 R2= 0.9482
Lldr- T7-lldPRD operon promoter-GFP
[IPTG]=1 mM
t=0 min Relative Fluorescence= 6.123 t^3 - 32.29 t^2 + 41.51 t+ 34.97 R2=0.4449
t=5 min Relative Fluorescence= 6.669 t^3 - 38.13 t^2 + 55.27 t + 13.89 R2= 0.9808
t=10 min Relative Fluorescence= -3.422 ^3 + 7.808 t^2 + 8.072 t + 11.18 R2=0.9946
t=20 min Relative Fluorescence= 10.74 t^3 - 48.53 t^2 + 57.9 t+ 9.947 R2= 0.9621
t=30 min Relative Fluorescence= 7.02 t^3 - 37.92 t^2 + 55.03 t + 9.921 R2= 0.9998
t=60 min Relative Fluorescence= 9.403 t^3 - 55.39 t^2 + 80.41 t + 8.451 R2= 0.9787
lldPRD operon promoter-GFP
[IPTG]=0 mM
t=0 min Relative Fluorescence= 2.27 t^3 - 12.95 t^2 + 23.4 t+ 8.107 R2= 0.9883
t=5 min Relative Fluorescence= -2.332 t^3 + 8.402 t^2 + 2.239 t + 20.74 R2= 0.9834
t=10 min Relative Fluorescence= 0.4742 t^3 - 1.957 t^2 + 5.059 t +26.94 R2= 0.9544
t=20 min Relative Fluorescence= -3.069 t^3 + 17.46 t^2 - 25.51 t+ 21.98 R2= 0.9398
t=30 min Relative Fluorescence= -7.451 t^3 + 36.49 t^2 - 44.01 t + 39.25 R2= 0.9645
t=60 min Relative Fluorescence= -0.7971 t^3 + 4.694 t^2 - 13.22 t + 39.88 R2= 0.9761
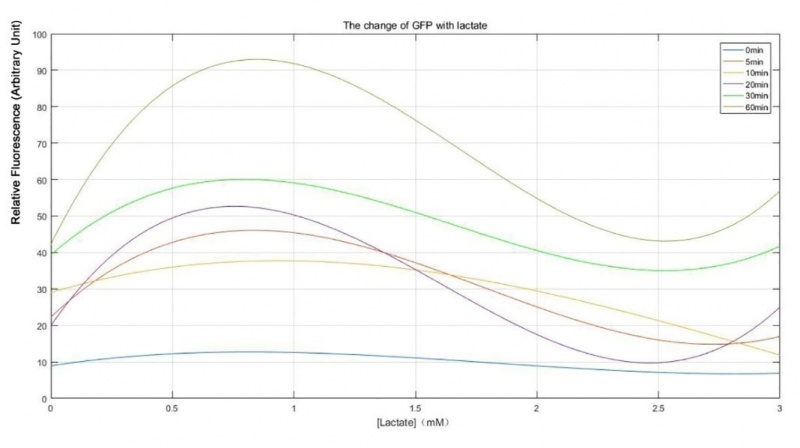
lldPRD operon promoter-Luxs-Lldr × LsrA promoter-GFP
t=0 min Relative Fluorescence= -9.425 t^3 + 43.48 t^2 - 48.63 t+ 44.85 R2= 0.9985
t=5 min Relative Fluorescence= 9.999 t^3 - 56.32 t^2 + 79.92 t + 12.47 R2= 0.9696
t=10 min Relative Fluorescence= 12.03 t^3 - 62.83 t^2 + 86.66 t+ 10.36 R2= 0.7222
t=20 min Relative Fluorescence= 4.578 t^3 - 32.79 t^2 + 59.31 t+ 9.459 R2= 0.898
t=30 min Relative Fluorescence= 6.297 t^3 - 35.63 t^2 + 53.2 t + 9.274 R2= 0.8867
t=60 min Relative Fluorescence= 9.122 t^3 - 51.26 t^2 + 73.33 t + 5.924 R2= 0.9866
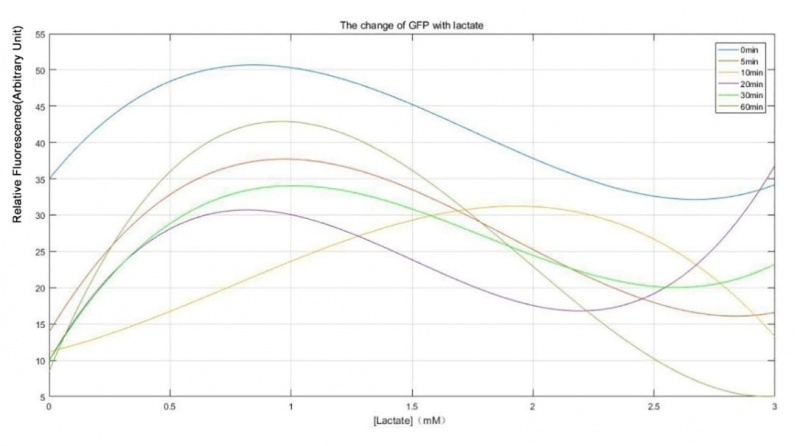
lldPRD operon promoter-Luxs × LsrA promoter-GFP
t=0 min Relative Fluorescence= -11.78 t^3 + 46.85 t^2 - 28.71 t+ 10.35 R2= 0.9764
t=5 min Relative Fluorescence= -12.48 t^3 + 45.65 t^2 - 26.91 t + 18.86 R2= 0.9762
t=10 min Relative Fluorescence= -1.135 t^3 + 5.337 t^2 - 3.825 t + 23.12 R2= 0.511
t=20 min Relative Fluorescence= -10.64 t^3 + 35.98 t^2 - 12.38 t+ 9.098 R2= 0.9716
t=30 min Relative Fluorescence= 3.63 t^3 - 25.57 t^2 + 40.87 t + 14.54 R2= 0.893
t=60 min Relative Fluorescence= 9.562 t^3 - 53.63 t^2 + 74.38 t + 9.515 R2= 0.9907
Practical significance of model results
FiguresT7- lldPRD operon promoter-GFP

When [IPTG]=1 mM, fluorescence intensity at each point of time showed a similar trend towards the concentration change of lactate, meaning that fluorescence intensity firstly increases along with the higher lactate concentration and then goes down. The fluorescence intensity reached to the peak under applying lactate concentration from 0.5 mM to 1 mM. According to yogurt fermentation in reality, the concentration of lactate could not exceed 1 mM[1]. Therefore, this engineered E.coli could monitor the lactate concentration of yogurt during fermentation. In terms of time, the fluorescence value of 5-60 min was all higher than that of 0 min, indicating that the reaction of engineering E.coli to lactate was effective during this period. Therefore, 5 min was selected as the appropriate reaction time. Also, the fluorescence intensity of optical fiber detection could be stable within 200 milliseconds, so the time for testing the lactate concentration by using this engineering E.coli was 5 min.
Lldr- T7-lldPRD operon promoter-GFP

[IPTG]=1 mM
When [IPTG]=1 mM, with the increase of time, fluorescence intensity expressed by engineered E.coli is all lower than at 0 min. This might be due to the fact that at 0 min, the expression of lldR had not yet started or the expression quantity is too low, so the opening of lldPRD operon promoter caused by the introduction of engineering E.coli was not prevented. However, as the reaction time increases, lldR gradually produced so that the primitive expression of GFP decreases. From the perspective of time, when the reaction time was at 5 min, the change trend of fluorescence intensity with the concentration of lactate was consistent with the initial reaction time, so the good reaction time of engineering E.coli could be achieved within 5 min.
lldPRD operon promoter-GFP

[IPTG]=0 mM

When there was no lactose operon and adding different concentrations of lactate, although the engineered E.coli still reacted with different concentrations of lactate, curves of the function were obviously irregular with different reaction times.
lldPRD operon promoter-GFP & T7- lldPRD operon promoter-GFP& Lldr- T7-lldPRD operon promoter-GFP
We fitted the change of fluorescence intensity of the three engineered E.coli above at the reaction time of 5 min, aiming at obtaining the differences of the three engineered E.coli.
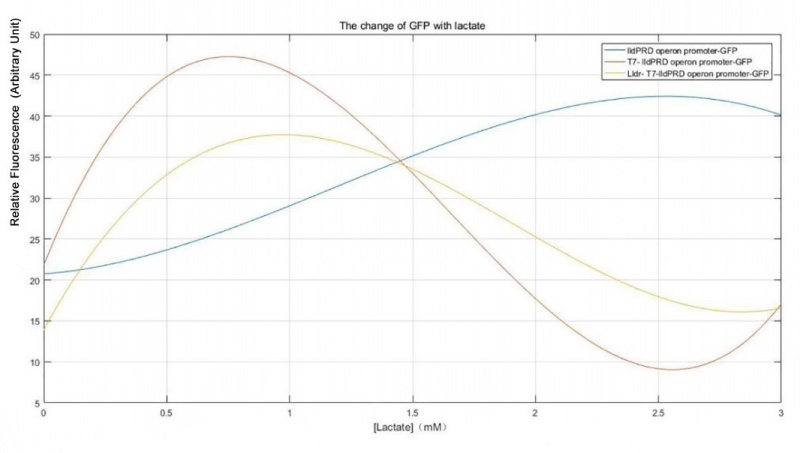 Figure 7. Comparison of Relative fluorescence intensity under series of lactate concentration and time.
In the process of production of yogurt in reality, the lactate content should not exceed 1 mM. So, when the lactate content was lower than 1 mM as well as adding the lactose operon or lldR to the engineered E.coli, their lactate concentration was lower than 1 mM, indicating that these two engineered E.coli can detect lactate in yogurt with high sensitivity. Besides, when lactate content was lower than 1 mM, engineered E.coli with the lactose operon or lldR was higher than those which only contains lldPRD operon, indicating that both the lactose operon and lldR had an improved effect on the initial engineered E.coli (BBa_K822000). Compared with the improvement of BBa_K822000 by lldR and lactose operon, it was obvious that the addition of lactose operon makes engineering E.coli was more sensitive to normal yogurt lactate concentration.
lldPRD operon promoter-Luxs-Lldr × LsrA promoter-GFP
 Figure 8. Part Constitution of “lldPRD operon promoter-Luxs-Lldr” (BBa_K2824007) and “LsrA promoter-GFP” (BBa_K2824009)
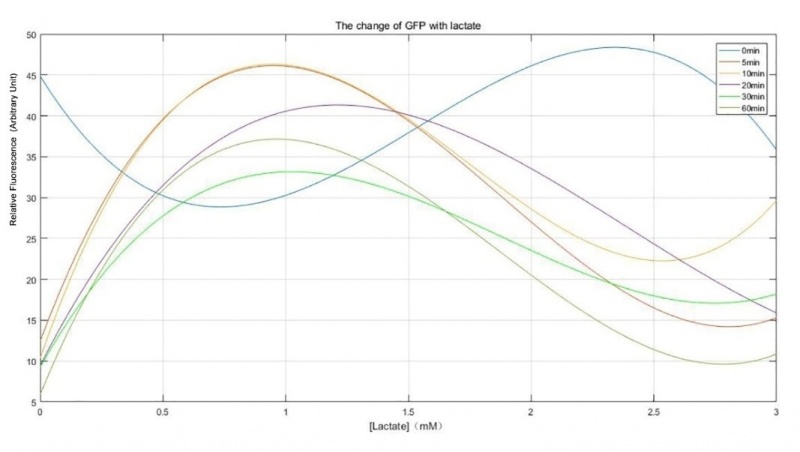 Figure 9. Relative Fluorescence Intensity under series of lactate concentration and time.
Except for the beginning of the reaction, the rest of the functional curves showed similar trends, especially when the reaction time was 5 min and 10 min, and the peak value was reached before the concentration of lactate is 1 mM. It demonstrated that the engineered E.coli is best used to detect the lactate concentration in yogurt at 5 min and 10 min. In order to reduce the reaction time of engineered bacteria, the reaction time of 5 min was selected.
lldPRD operon promoter-Luxs × LsrA promoter-GFP

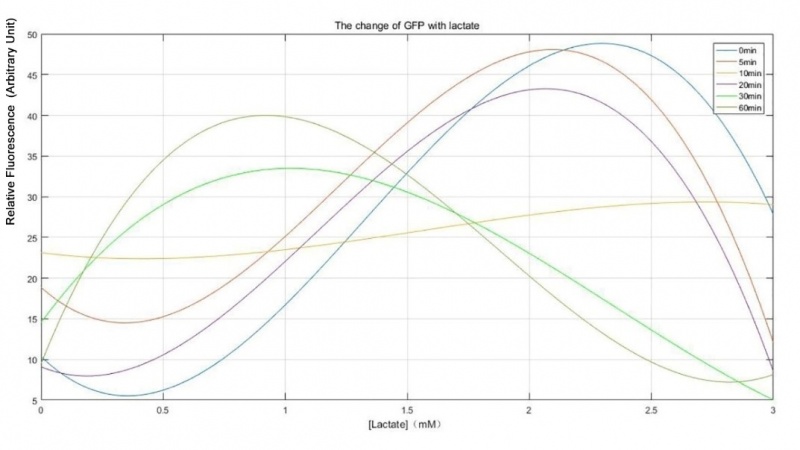 Figure 11. Relative Fluorescence Intensity under series of lactate concentration and time.
According to the result of fitting, after 30 min of reaction, the engineered E.coli was highly sensitive to different concentrations of lactate. However, the reacting time was too long, the increase of fluorescence intensity might be caused by the death of bacteria.
lldPRD operon promoter-Luxs-Lldr × LsrA promoter-GFP & lldPRD operon promoter-Luxs × LsrA promoter-GFP& Lldr- T7-lldPRD operon promoter-GFP
We fitted the change of fluorescence intensity expression of the three engineered E.coli at the reaction time of 5 min, hoping to obtain the difference of the three engineering E.coli.
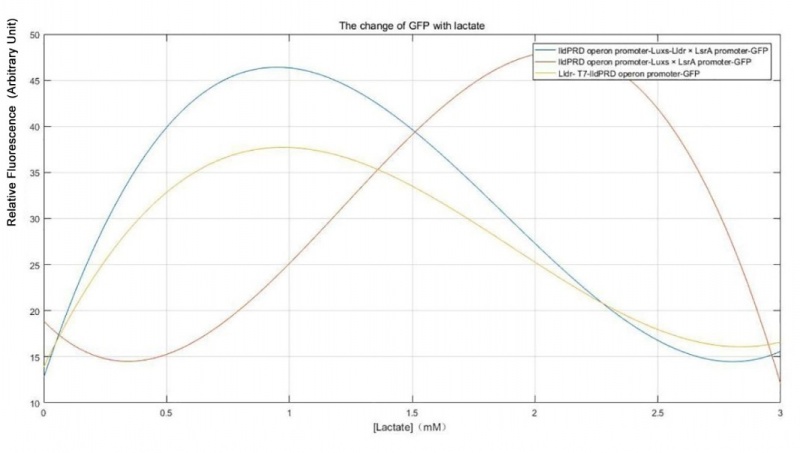
Figure 12. Comparison of Relative fluorescence intensity under series of lactate concentration and time.
Similarly, when the lactate concentration was less than 1 mM, included “lldPRD operon promoter - Luxs – Lldr” combined with “LsrA promoter” as well as “Lldr - T7 - lldPRD operon promoter – GFP”, these two kinds of engineered E.coli showed the peak value, and the sensitivity of the former was higher than the latter. This indicated that when the lactate concentration of yogurt was not over the limitation, these two types of engineered E.coli could produce higher sensitivity, and the addition of the QS system could improve the sensitivity of engineered E.coli to the lactate concentration. The engineered E.coli containing “lldPRD operon promoter – Luxs” and “LsrA promoter – GFP”, in lactate concentration was lower than 2.5 mM, could sense with higher sensitivity.
In summary, from what had been discussed above, we can learn that the engineered E.coli containing “lldPRD operon promoter - Luxs - Lldr x LsrA promoter – GFP” was selected as our best engineered E.coli in applying device.
Experimental Purpose
In order to quantify the relationship between fluorescence intensity and lactate concentration, lactate concentration could be monitored reasonably according to the real-time fluorescence intensity. The inhibited effect of lactate on yogurt fermentation could be minimized.
We can connect the function curves with the experimental purposes and further strengthen the experimental purposes that we have achieved through modeling results:
(1) Determine whether the addition of lactose operon improves the effect of the original engineered E.coli.
(2) Determine whether the introduction of lldR gene improves the effect of the original engineered E.coli.
(3) Determine whether the addition of QS system improves the reaction of lactate operon promoter to lactate.
(4) Judge the actual reaction time of engineered E.coli applied in actual operation
Physical Model
3D model
We used 3D printing technology in constructing container of our device, and selected photosensitive resin as printing materials. The main reason for this is that photosensitive resin has a certain light-fixation quality for this material contain a certain ultraviolet initiator or photosensitive agent. When exposed to a certain wavelength of ultraviolet irradiation immediately caused by polymerization reaction, it could complete fixation to achieve the entire process of product modeling[2]. It is common that ultraviolet radiation in the field of medicine has a good anti-bacterial effect. The use of photosensitive resin materials can greatly guarantee the sterile conditions of the experimental device.
In addition, photosensitive resin materials have high printing precision, great product details with light feature. Also, they can withstand 120 degrees Celsius[2], indicating that they can be sterilized through physical method, resulting in less effect other microbe to our device.
After a thorough discussion and research, we finally adopted the drop-shaped mold type by using 3D modeling software. The entire experimental device reserved a 2 mm diameters hole above the water droplets for inserting the optical fibers, left one side of each 0.5mm hole for adding the sample. The whole device is sprayed with paint to ensure the opacity of the whole decoration and avoid the early excitation of green fluorescent protein.
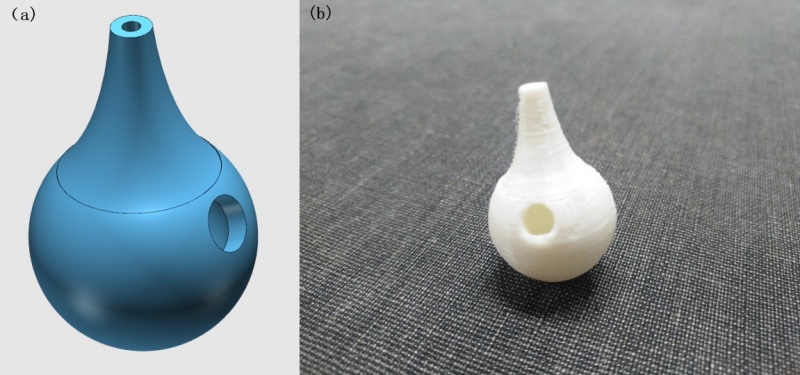 Figure 13. Design of 3D model. (a) design draft; (b) real object
Reference:
1. Wanguang Li, Xinwen Wang, Yishun Ji. Comparative experiment of two lactate detection methods in yogurt [J]. Anhui agronomy bulletin, 2017, 23(21): 113-114.
2. Biwu Huang, Wangfu Xie, Zhihong Yang. Preparation and Properties of a 3D Printed Stereolithography Rapid Prototyping Photosensitive Resin [J]. Functional Materials, 2014, 45 (24): 24100- 24104.