Team:NTNU Trondheim/Design


Design
Our project vision was to test a knock out method for reducing bacteria’s ability to produce harmful biofilms. As biofilm formation is a complex process of numerous triggering events required for the initiation of formation, we aimed to test our method in different growth environments in order to simulate a situation where our E. coli strains (DH5α and TG1) would eagerly produce biofilm.
We utilized a CRISPR interference (CRISPRi) system to target the LuxS gene in E. coli DH5α and TG1. The background for choosing the CRISPRi system targeting LuxS is based on work done by Zuberi, Misba & Khan 2017.
The LuxS gene encodes the enzyme S-Ribosylhomocysteinase involved in the finishing metabolic step of producing E. coli’s quorum sensing molecule “Autoinducer 2 (AI-2)”. The goal of the LuxS targeting was to stop the production of AI-2, which the bacteria need to communicate and coordinate events such as biofilm formation.
For our experimental setup of biofilm measurements, we took inspiration from work done by Stepanovic et al., 2000.
Designing our CRISPRi system

In our wetlab, we used simple and yet effective methods for designing our CRISPRi system. We bought two plasmids commercially, containing sequences for guideRNA (gRNA) and a catalitically dead Cas9 protein, respectively. The pgRNA and pdCas9 plasmids carried resistance against Ampicillin (AMP) and Chloramphenicol (CM), respectively. Different antibiotic resistance was important in order to verify transformations of our E. coli cells.
How did we specify the gRNA’s destination to LuxS in the jungle of bacterial DNA? We based our project on work previously done with the CRISPRi system and LuxS (Zuberi, Misba & Khan 2017) (see the description page), and designed primers for an overlap extension PCR procedure. These primers contained overhangs of a 20 base pairs (bp) protospacer sequence, complimentary to a 20 bp sequence in the LuxS gene with an NGG (PAM) sequence next to it. The goal of the overlap extension PCR was to insert the protospacer sequence in our pgRNA plasmid. We called the insert for “anti-luxS”. Once the PCR was complete, we verified the insert by test-digest. How could we detect a 20 bp insert? The anti-luxS insert contained a cut site for the PstI restriction enzyme, which we used to cut and analyse our PCR product by gel electrophoresis.
STEP 1: PCR with overhang primers

↙

↘

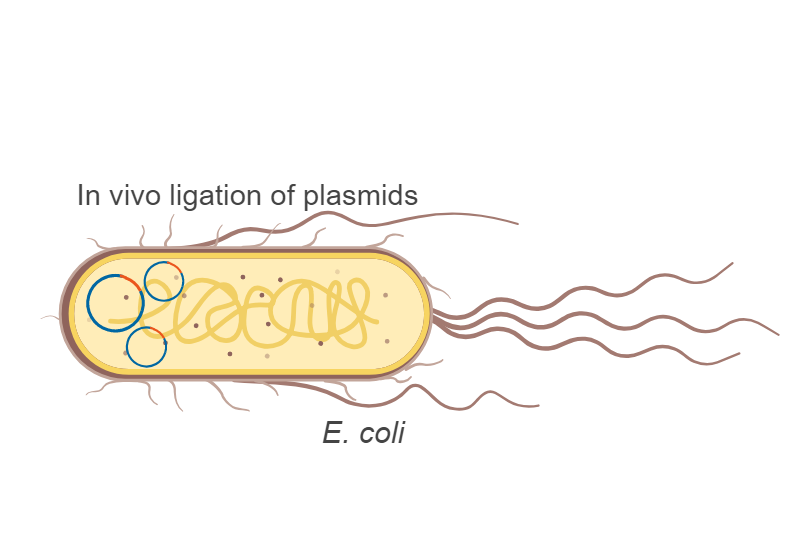
Step 2: Transformation
Step 3: Ligation in bacteria
Test/enzyme digest of isolated plasmids.
Test-digest is the method we used to verify transformations conducted on our E. coli cells. We transformed our cells with the pgRNA (with anti-luxS inserted) and pdCas9 plasmids. The test-digest method utilizes restriction enzymes to generate cut DNA fragments, and the sizes of the fragments are later analysed by gel electrophoresis.
We used “Benchling” to test which enzymes that were suitable for the test-digest reaction by generating virtual pictures of how the gel electrophoresis would look like with the respective enzymes we chose. We iterated this approach multiple times to verify that our bacteria were transformed with the correct plasmids.


DNA isolation procedure
The test-digest reaction would be difficult without obtaining pure plasmid DNA from our bacteria first. For plasmid isolation, we used the ZR Plasmid MiniprepTM from Zymo Research. The kit contains lysis- and neutralization buffers and yields purified plasmid DNA ready for test-digest reactions or transformations.

Nanodrop
Sample purity is an important consideration after isolating plasmid DNA and a NanoDrop analysis is a necessary step prior to test-digest reactions and transformations. We used NanoDrop to evaluate our sample purity after doing a plasmid miniprep, in order to gain valuable information about DNA concentrations (needed for the test-digest protocol) and impurities in our sample. The NanoDrop contributed in solving any troubleshooting we had in gel electrophoresis or transformations.
Experimental setup of biofilm assays to test our CRISPRi system
As our designed CRISPRi system was meant to indirectly reduce E. coli’s biofilm production, we focused mainly on verifying our design through biofilm assays. The biofilm assay protocol we ended up with was a result of trial and error, which was necessary in generating consistent, reliable and significant results. We based our biofilm assay on Zuberi, Misba & Khan 2017 and Stepanovic et al., 2000. Our biofilm assay can be divided in four main steps, which is done over a period of approximately three days: Preparation of cultures, incubation of 96-well plates, crystal violet staining and plate reader analysis.
Preparation of cultures
To simulate the best environment for biofilm formation in our E. coli, we decided to test two strains (DH5α and TG1) in Lysogeny Broth (LB) and M63B1 mediums. In addition, we tested three different pH for both mediums (4.5, 7.2 and 9.5) and glucose concentrations of 0%, 0.4% and 0.8%. As a result, we ended up with an optimal pH of 7.2, and glucose concentrations of 0.4% and 0.8% for further biofilm measurements. We also decided to test both media types, LB and M63B1.To prepare biofilm formation in 96-well plates, we first had to grow our strains in tubes overnight at 37℃ with shaking.

This ensured that the cells could grow to a sufficient OD600 value before we transferred the cells from each culture to new mediums with different glucose concentrations. Some of our samples had to grow with an additional antibiotic, Tetracycline (TET), as TET worked as an inducer for the negatively controlled transcription of the Cas9 gene in the pdCas9 plasmid.
Incubation of 96-well plates
100 μL of the new cultures were furthermore applied on 96-well plates sealed with parafilm and incubated in 37℃ for desired time points (we tried 3h, 5h, 8h, 24h and 30h). The incubation time allowed the bacteria to accumulate biofilm on the walls of the wells according to the chosen time points.

Crystal violet staining
So how can bacterial biofilms be quantified once formed? We utilized Crystal Violet (CV) to “paint” the biofilm in our E. coli. CV is often used in staining bacteria for testing the bacterial cell wall composition, referred to as “gram staining”. In our case, we utilized the CV to stain the bacteria associated with the biofilm formed in each well in our plates and furthermore quantify these bacteria indirectly by measuring absorbance of the CV.

In order to get accurate and reliable results, the addition of CV to each well of a 96-well plate had to be followed by careful and thorough rinsing to ensure that all excess bacteria and excess CV was removed. Prior to rinsing, the biofilms in each well were fixed with methanol to withstand the rinsing steps (see the protocol page for more detailed info).
Plate reader analysis
Once the rinsing steps were done, acetic acid was added to each well to dissolve the biofilm, thus releasing the CV bound to layers of biofilm in the walls of the wells. The intensity of violet color observed in each well was an early indication of relative biofilm quantities. We obtained more accurate measurements by running the plates in our plate reader, to generate absorbance values for each plate. These values were furthermore used in our statistical analyses to prove significant reduction of biofilm in the DH5α and TG1 E. coli strains actively transcribing our designet CRISPRi system. Detailed results can be found in our result page!

Site-directed mutagenesis and Gibson Assembly, the design of BBa_K2754000
When designing our biobrick for the dead Cas9 protein (BBa_K2754000), we got some trouble: The coding sequence in our original dCas9 plasmid contained illegal cut sites which had to be removed. In addition we had to insert the prefix and suffix sequences to make our biobrick RFC10 compatible. To achieve this, we designed PCR primers overlapping with the illegal cut sites. The overlap had a point mutation which changed a codon in the illegal cut site without changing the amino acid. This destroyed the cut sites without tampering with the amino acid sequence.
To insert prefix and suffix, we designed overlapping primers flanking the coding sequence of dCas9. These primers contained the prefix or suffix as a loop structure.
When executing a PCR with these primers and the original dCas9 plasmid as template, it generated the fragments illustrated in the figure below. These fragments were furthermore used in a Gibson Assembly reaction to combine them together in the correct order and orientation.

A more in-depth explanation of our results is found on the Results page.