Team:NWU-China/InterLab
Interlab
Overview
This year we participated in the Fifth International InterLab Measurement Studyas an IGEM team.
As part of the Bronze Award,The goal of the iGEM InterLab study is to identify and correct sources of systematic variability in synthetic biology measurements so that ultimately measurements made in different laboratories are not more variable than measurements made in the same laboratory.In the course of the experiment, we strictly follow the experimental procedures to obtain the most accurate data.We successfully completed the experiment and submitted the data within the expected time.
Calibration Protocols
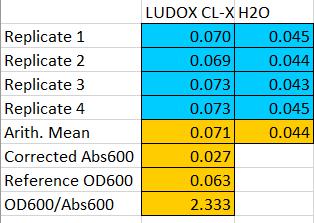
We firstly completed the Calibration protocols including The OD600 reference point,Particle Standard Curve,
Fluorescence standard curve.
Here are our OD600 reference point:
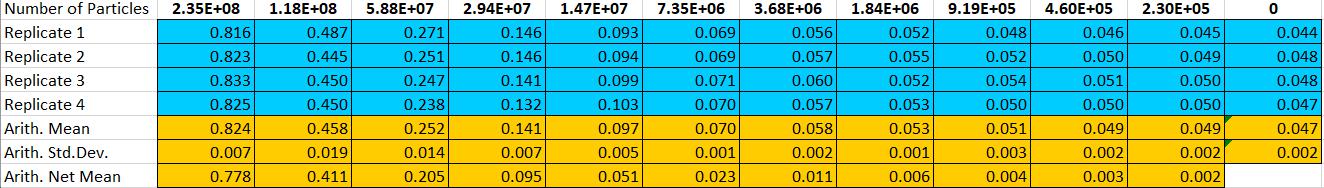
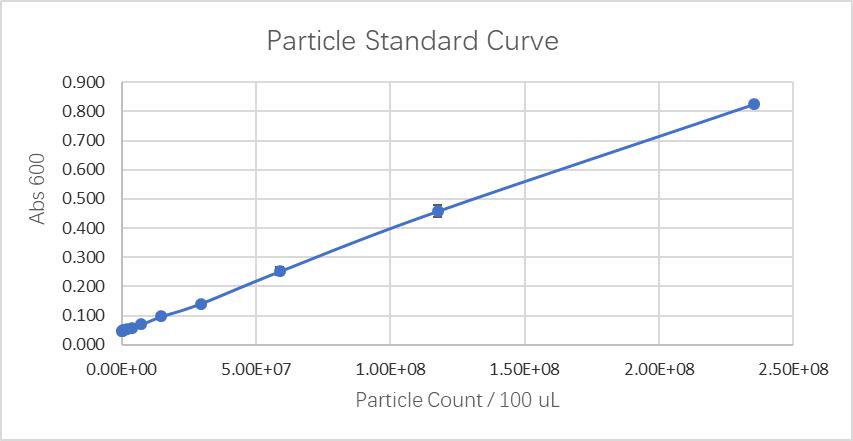
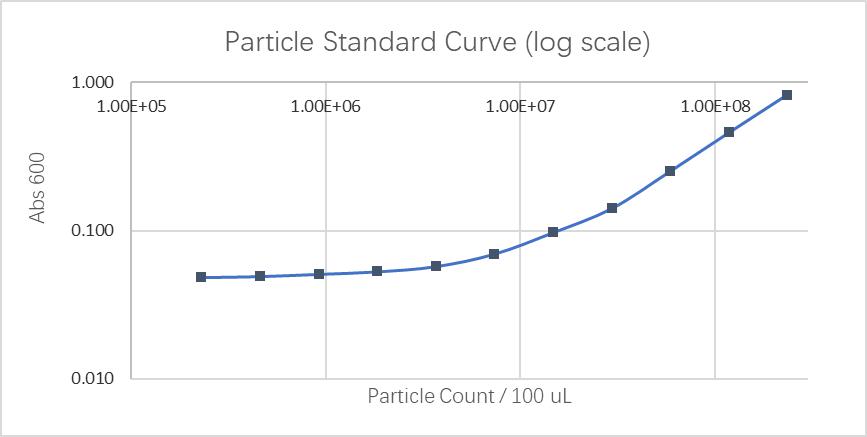
Particle standard curve:
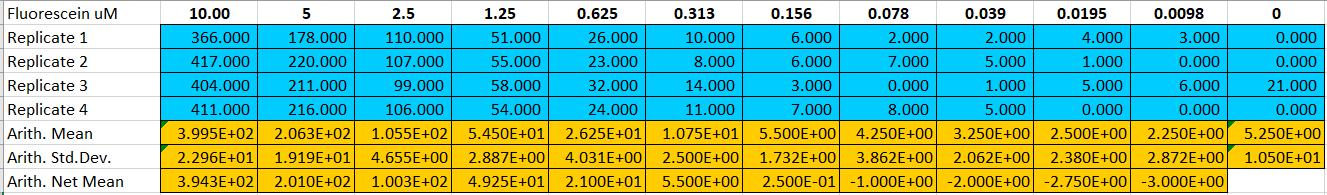
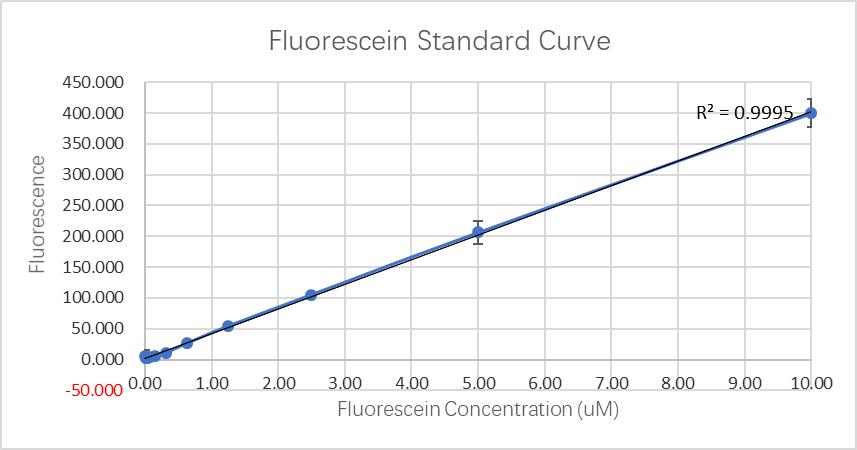
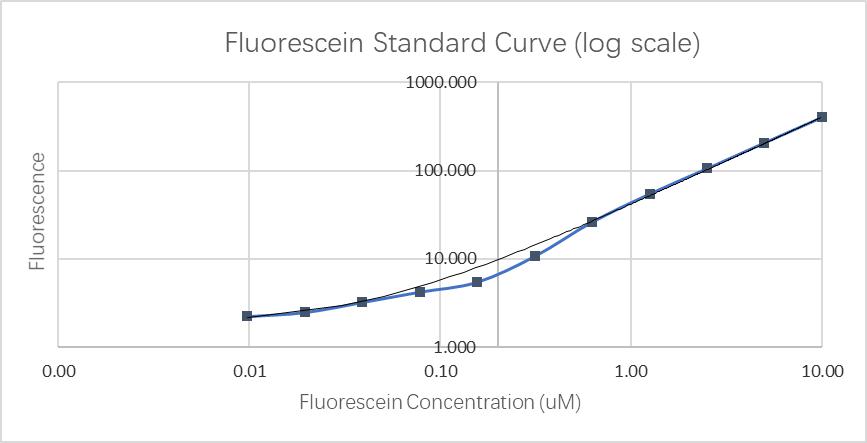
Fluorescein standard curve:
Cell measurement Protocol
In the experiment, we performed bacterial transformation according to the officially recommended method. But Test Device 1 and Test Device 5 are not transformed. We contacted NPU-China and got these two strains from them. Then we completed the follow-up work as scheduled.
1.Make a 1:10 dilution of each overnight culture in LB+Chloramphenicol (0.5mL of culture into 4.5mL of LB+Chlor).
2.Measure Abs600 of these 1:10 diluted cultures.
3.Record the data.
4.Dilute the cultures further to a target Abs600 of 0.02 in a final volume of 12 ml LB medium + Chloramphenicol in 50 mL falcon tube covered with foil to block light.
5.Take 500 µL samples of the diluted cultures at 0 hours into 1.5 ml eppendorf tubes, prior to incubation. Place the samples on ice.
6.Incubate the remainder of the cultures at 37°C and 220 rpm for 6 hours.
7.Take 500 µL samples of the cultures at 6 hours of incubation into 1.5 ml eppendorf tubes. Place samples on ice.
8.Measure Abs600 and fluorescence of the samples from the 0 hour and 6 hour time point.
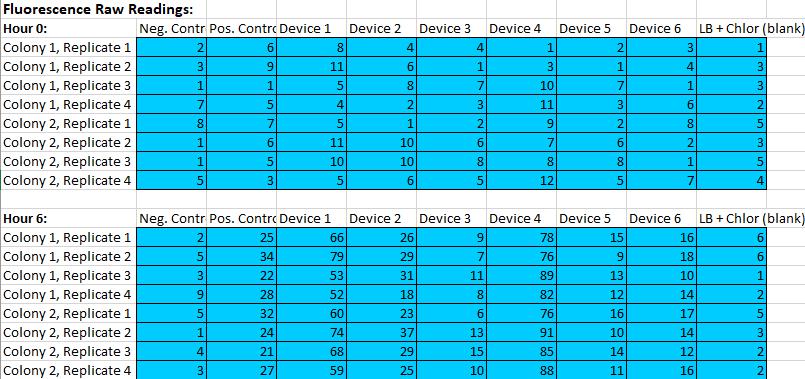
9.Record data as shown below.
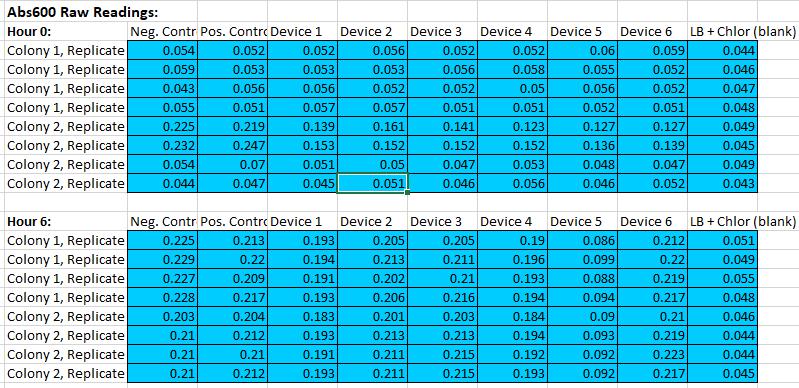
Analyse
Through communication with other local teams, we found that the data we obtained in the determination of the fluorescein standard curve differed by two to four orders of magnitude. According to our analysis, this is mainly because the model and age of the plate reader we use are related.
At the same time, in subsequent measurements we found that among the six different test devices, device 4 had the strongest fluorescence and device 3 had the lowest fluorescence.