Team:Newcastle/Measurement

Alternative Roots
Measurement, Automation and Reproducibility
Introduction
The Interlab study Newcastle iGEM InterLab has provided a platform to develop robust measurement procedures for assessing promoter strength and examining cross laboratory variation in genetic devices and measurement equipment [1,2]. Reproducibility however, is taken as a defining feature of science, but the reproducibility of experimental research is an assumption not a fact [1,2]. To aid in the continual improvement of the InterLab methodologies we investigated biodesign automation, statistical experimental design and standardised reporting of materials and methods. Our goal was to contribute to iGEM’s ongoing efforts to reduce experimental variability, increase measurement reliability and broaden the range of open source protocols. An additional goal was to road-test the foundation skills and technologies that we would be needed in the ‘domestication’ of our endophytic Pseudomonas chassis.
All methods are documented in the Materials and Methods section.
Bio-design Automation
Bio-design automation (BDA) is defined as robots + software + biology [3]. BDA therefore co-develops automated hardware solutions (i.e. the integration of robotics into wet-lab procedures) with automated software that drives the workflow, the hardware and in silico modelling, design and optimisation [3]. Automated hardware - such as liquid handling robots and microfluidic systems - allow for improvements in the reproducibility of standardised workflows, while removing human error as a source of variation [1]. Integrating software with the hardware further allows for in silico modelling including extracting and sharing information from many databases, as well as providing computer aided construct design and laboratory and hardware management. Within the BDA framework, complex genetic circuits can be built, designed and tested rapidly and the data retained to allow future biodesign. Recent developments in affordable technologies for lab equipment, notably in the release of the Opentrons OT-2 liquid handling robot, and the ever-growing library of software, means that interest in the BDA framework is high and likely to rise further.
Design of Experiments
Design of Experiments (DoE) is statistical method that provides a systematic means to explore large, multifactorial design spaces. This is an efficient approach to optimising complex bio-processes, and also allows for interacting experimental factors to be identified.
Minimal Information Standards
Minimum information standards (MIEO) provide explicit information in advance on what information needs to be recorded and reported with each experiment. This cataloguing and reporting of experimental metadata provides a record of the various factors that could influence the reproducibility of the result [4]. Such experimental factors relating to growth and productivity of engineered organisms have been described previously by Hecht et al. [5].
This Study
The Alternative Roots team investigated ways to improve measurement, reproducibility and automation aspects of future InterLab studies. The team employed automated protocols, liquid handling robotics and the DoE methodology to aid in optimisation of Escherichia coli (E. coli) transformation protocols and chemically defined media. We also developed new InterLab study plasmids featuring an internal standard fluorescent signal and improved GFP signal. The results from this work can be seen in the three sections below:
Improved Interlab Measurement Plasmids
Inclusion of an RFP internal standard into the 2018 Interlab test plasmids
One goal of the 2018 iGEM InterLab study is to overcome the weakness inherent in the commonly-used measurement of promoter strength, that of reporting the fluorescence value relative to the optical density at 600 nm (OD600 nm) of the culture media. There is clearly the potential for a discrepancy to occur between OD600 nm and actual cell concentration which can result in an erroneous conclusion being drawn about the effectiveness of the promoter. This year the 2018 iGEM study sought to reduce lab-to-lab variability by measuring GFP fluorescence relative to absolute cell counts or colony forming units (cfu). Normalisation of fluorescence against cfu ensures measurement of fluorescence relative only to viable cells.
Our RFP internal standard (IS) was developed to address the issue that copy number of the same plasmid is not consistent across cells. The inclusion of an IS RFP signal (Figure 1 Part:Bba_K2797013) is therefore designed to allow measurement of variation in gene expression between cultures and transformant lines. The underpinning assumption is that because the IS devices are identical across each of the plasmids, the GFP fluorescence values of the test devices of interest can be reported relative to their internal RFP signal.

The new plasmids were tested. Analysis of the internal standards involved comparing the original InterLab test device plasmid performance against the new internal standard plasmid performance. MTP wells A-D represented the E. coli containin the RFP internal standard vector and wells E-H represented E. coli containing the original test devices. Column 9 wells A-H contained an LB+cam blank. The microtiter plate was incubated for 24 hours in the plate reader with Abs600, fluorescence (GFP): Excitation 485 nm, Emission 420 nm and fluorescence; (RFP): Excitation 588 nm, emission 635 nm measured every 15 minutes following a short shake at 420 rpm at a low shake diameter.
Although there was no calibration standard available for our RFP, there was a clear indication that there was variation in RFP gene expression between each device (Figure 2). It is important to remember that the only genetic difference between these devices is in the promoter used to drive GFP expression - not RFP expression. Moreover, the inclusion of the RFP impacted on the response of the GFP signals across the test devices. GFP fluorescence values of the modified InterLab plasmids were seen to be lower than standard InterLab devices. Devices 1 & 4 – the devices with the strongest promoters – exhibited lower GFP fluorescence than unmodified InterLab plasmids and did not show any RFP fluorescence (sequencing confirmed the presence of the RFP part). Taken together these observations suggest that there is competition for cellular resources (i.e. Transcriptional/translational machinery) [6].This has been observed previously in E. coli, where genes are activated and deplete the pool of free RNAP and ribosomes, reducing their availability to other cassettes [7,8]. In this case, it may be that gene expression of GFP in devices 1 & 4 is so powerful that there is no available cellular machinery to enable protein synthesis whilst the variation in RFP signals across all plasmids is likely to result from similar, but less pronounced competition.

A further interesting observation is the difference seen in GFP signal longevity. The fluorescence/OD600 of the original test devices exhibited a significant decrease after six hours while in the IS containing devices, although the signal was lower, it remained more consistent over 24 hours. Genes have been known to act as transcriptional modulators for one another in the same operon [10]. However, genes on the same plasmid but at different locations can act as transcriptional modulators for one another [6]. It may be that a coupling of these genes due to competition for transcriptional machinery has led to the modulation of GFP gene expression, causing it to be less productive but more consistent. There is room for improvement in this study. RFP is a slow maturing protein. Fluorescent proteins like mCherry, which possess brighter fluorescence and fold faster [11] are a better option for use as an IS. Furthermore, a calibration with a red fluorescent compound (e.g. rhodamine red) would be beneficial. This would allow molecules of equivalent rhodamine red’ values so estimate RFP or other internal standard concentrations in cells.
Comparisons between the existing GFPmut3b test devices and a new series of mNeon green test devices
From the literature, we gathered information on the potential problems associated with the GFPmut3b reporter – notably its low photostability upon exposure to natural light [9]. However, since GFPmut3b is the brightest GFP variant, it would make sense to utilise a suitably divergent fluorescent protein with similar fluorescence characteristics to GFPmut3b but higher photostability – mNeonGreen fits this mould.
InterLab test devices 1 – 4 were successfully converted from GFPmut3b to mNeon green (Figure 3). Devices 5 and 6 were not successfully converted.

The data indicate that mNeonGreen was not significantly brighter than mut3GFP as was proposed. Figure 3 shows that the fluorescence patterns in mNeonGreen are similar to those of the original test devices, with 4 & 1 being the strongest promoters and 3 being the weakest. However, the values for both replicate colonies show that the spread of fluorescence/OD600nm values for the mNeonGreen reporter is lower in each test device group.
The results of this experiment therefore do not support the original goal of the study. The mNeonGreen reporter, despite reports in the literature, was not seen to be significantly different to mut3GFP in its fluorescence/OD600 nm. This is consistent with previous reports demonstrating a lower fluorescence in vivo, compared to a higher in vitro fluorescence [12,13]. The mNeonGreen did, however, show a smaller range of fluorescein/OD data in comparison to GFPmut3b. Since there were no differences in fluorescence values, the smaller range of values from the mNeonGreen reporter may be due to its better photostability, or a difference in maturation time in vivo than the literature suggests. Regardless, the switch to mNeonGreen in InterLab test devices may further improve measurement reliability.
Automated protocols for Escherichia coli transformation
Bacterial transformations are a core part of much of iGEM and the InterLab study. We therefore developed an automated protocol for small-scale, high-throughput transformation of E. coli using the OpenTrons OT-2 (See software for more details). We used this protocol to improve the transformation efficiency of this procedure.
Preliminary Research
A literature search, examining protocols for the preparation of chemically competent E. coli cells and transformation procedures, identified factors reported to influence transformation efficiency. This included factors such as E. coli strain, growth medium, growth volume, cell density, wash steps, wash buffer composition, DNA concentration, recovery medium and recovery time. It was noted that transformation buffer (TB) composition, used in cell preparation, not only varied between protocols, but was also deemed the primary variable for inducing competency. Therefore, TB composition was selected for optimisation and other factors were set at a constant level.
Minimising and automating the protocol (including new OT2 hardware)
Laboratory automation, liquid handling and reaction miniaturisation enable high-throughput experimentation. Protocols for competent cell preparation however typically use 50-250 mL of culture volumes. We set out to downsize competent cell preparation so that optimisation could be performed using automated workflows.
No significant difference in transformation efficiency was found between cells prepared in 50 mL or 2 mL tubes, but transformation efficiency was found to be significantly lower in cells prepared in 96-well plate format (Figure 4). Due to this result, all non-automated workflows were carried out using 2 mL microcentrifuge tubes to ensure transformation success. Once automation workflows began, the reduced transformation efficiency would be considered when analysing the results.

To reduce protocol complexity and length, wash number and wash combination were evaluated, with the results suggesting no significant impact on transformation efficiency (Figure 5). Wash steps were excluded moving forward to streamline and decrease protocol complexity, without significant loss of transformation efficiency.

DoE scoping
To determine suitable ranges for each experimental factor, preliminary scoping experiments were performed. Several different areas were investigated: concentration ranges and choice of cryoprotectant, buffering agents, and PEG8000 inclusion.
Low, Medium and High Concentration Transformation Buffers with Glycerol or DMSO as a Cryoprotectant
TB composition was investigated at three levels, and two commonly used cryoprotectants, DMSO and glycerol, were also tested.
Data indicated that transformation efficiency was optimal at a moderate TB concentration. Choice of cryoprotectant alone did not affect transformation efficiency, however, there was evidence of an interaction between buffer complexity and cryoprotectant choice. Specifically, at a moderate concentration of TB with the inclusion of DMSO, transformation efficiency was significantly higher (Figure 6).

Glycerol is commonly used in TB and no negative effects were observed when it was included. DMSO, however, has been seen to inhibit transformation efficiency in low complexity TB while significantly increasing transformation efficiency in the more complex buffers. Going forward, DMSO was selected as the cryoprotectant, as complex TB composition was the target of the main investigation.
pH Buffering Agent
Initial research highlighted pH as an important factor relating to transformation efficiency. Therefore, several buffering agents were investigated: HEPES, PIPES, MES and MOPS. HEPES, PIPES and MES all had a positive effect on transformation efficiency, whereas MOPS showed no significant difference compared to the control (Figure 7).
HEPES was selected for use in subsequent investigations as the highest transformation efficiency was observed with this buffer.

PEG 8000 Inclusion
Previous studies evidence the benefit of including PEG 8000 [14,15,16]. Our data (mean TrE = 4.80 x 10⁶ when compared to a TB control mean TrE = 2.26 x 10⁵) (t = -3.75, d.f. = 2, t = 0.064)). agreed with these findings, leading to increased transformation efficiency, therefore, PEG 8000 was included in the DoE optimisation
Workflow optimisation
Optimisation of the automated competent cell and transformation workflow was successful and showed an increase in transformation efficiency. The initial protocol was semi-automated, containing multiple manual steps and a mean transformation efficiency of 1.89 x 10⁴. Next, the code and OT-2 deck environment were optimised to achieve a fully automated workflow [https://2018.igem.org/Team:Newcastle/Software/OT]. Following optimisation, the code was refactored to improve efficiency. This led to a significant increase in transformation efficiency, with a mean transformation efficiency of 1.20 x 10⁵ (Figure 8). This optimised workflow was combined with a DoE complex TB buffer construction protocol to make the ‘Automated Transformation Buffer Optimisation and Transformation efficiency analysis protocol’ (ATBOT), to be used for the definitive screening of TB buffer components.

Hardware optimisation
The opensource and adaptable nature of the OT-2 allowed us to design bespoke hardware specific to our needs. This included a tube rack to contain 8 x 20 mL universal tubes which could be inserted into a multipurpose ice box designed to keep reagents at 0-4 °C. This rack, along with 100 mL and 250 mL Duran bottles for cultures or microbial waste were defined and uploaded to the robot API. This provided all the necessary components to carry out the protocol.
The original protocol required manual interactions to chill, heat shock and incubate the cells. In the ATBOT protocol, the TempDeck was employed to maintain cells at 4 °C, heat shock cells at 42 °C and provide recovery incubation at 37 °C. However, it was noted that the heat shock step did not provide the same shock as would occur during the manual protocol. As such, the heat shock step was modified in the code.
Software optimisation
The following sections describe the notable steps made during optimisation and refactoring of the ATBOT protocol (Figure 9) and is described for non-python users. For full python script and details, see here (for individual scripts and download see: https://github.com/jbird1223/Newcastle-iGEM/tree/master/OT-2%20Protocol). This protocol allowed ~775 individual pipetting steps to be accurately automated and with a total active run time of approximately 70 minutes.

DoE TB buffer Construction Protocol
DoE was used to design a set of complex TBs encompassing multiple factors at difference concentrations. The experimental design was generated in JMP Pro 13 software and complied as a [list] within [list] block which enabled the conversion of CSV format reagent concentration and volume to python script. (note that any text after # denotes a comment, not code): Stock1 = [ [1,2,3,4,5] [1,2,3,4,5]] Stock_pos = [ ‘A1’, ‘A3’] # 20 mL Universal labware containing stocks # Number equates to uL of stock transferred # Positions of stocks in Stock1 labware # Stock position in labware This list within a list provided both the means to rapidly import multiple factors into the code, and for non-python users to easily modify factors.
Competent Cell and Transformation Protocol
The automated competent cell and transformation protocol used only basic transfer and mixing steps. A modifiable command block was included allowing non-python users to easily modify the protocol. Notable commands added during the optimisation and refactoring process were the inclusion of the TempDeck and a single transfer loop that removed supernatant, added TB buffer and fully resuspended the pellet.
The TempDeck maintained an environment of 0-4 °C, widely regarded as optimal for inducing competency in E. coli DH5α. For use in heatshock, the standard 45 seconds at 42 °C was modified to account for time taken for the TempDeck to reach 42 °C. The TempDeck °T from 4→42 °C took approximately 40 seconds, so a 100 second delay was scripted to allow a prolonged heating period.
Deploying ATBOT
Based on scoping data, concentration ranges were adjusted to achieve a more targeted design. A definitive screening design (DSD) was used to generate 25 separate buffer recipes for testing. These copositions covered 11 factors at a range of concentrations, maximising experimental coverage and reducing the number of runs.
The ATBOT protocol was used for experimental set-up and execution, with each run performed in triplicate. Transformation efficiency data was analysed in JMP Pro 13 and used to construct a standard least squares model.
As expected, TB buffers with highest average transformation efficiency of 2.21 x 10⁶ contained minimal DMSO and lacked NiCl2, with the highest concentration of MgCl2.6H2O (80 mM) that was factored into the design. Reduces transformation efficiency due to 96-well plate format was also factored in, giving a theoretical transformation efficiency of 2.21 x 10⁸. Four out of five TB buffers that produced no transformants, contained NiCl2 at its highest concentration. The fifth contained no NiCl2, but had the lowest cationic compound composition and included 15 % DMSO. This strongly suggests that NiCl2 is a major inhibitor of competency.
JMP analysis was also used to identify interacting factors, using the principle of effect sparsity. Five of 11 factor were identified as exhibiting interactions (Figure 12). A prediction profile for individual reagents at desirable concentrations was generated (Figure 12A) as well as the visualisation of interactions between reagents at differing concentrations (Figure 11B). NiCl2 and DMSO were found to have inhibitory effects, reinforcing earlier modelled predictions (Figure 10). The interaction profile (Figure 11B) highlighted two significant interactions, NiCl2*DMSO (P = 0.0054) and MgCl2.6H2O*RbCl (P = 0.0095). In both cases, high concentrations of both components resulted in a large significant increase in transformation efficiency, however when either concentration were lowered, transformation efficiency was reduced. MgCl2.6H2O was found to have a significantly positive (P = 0.0105) effect on transformation efficiency, while KOAc was found to be significantly inhibitory (P = 0.0172).


Variation in Media Composition
Variation in expression levels within and between batches of undefined media
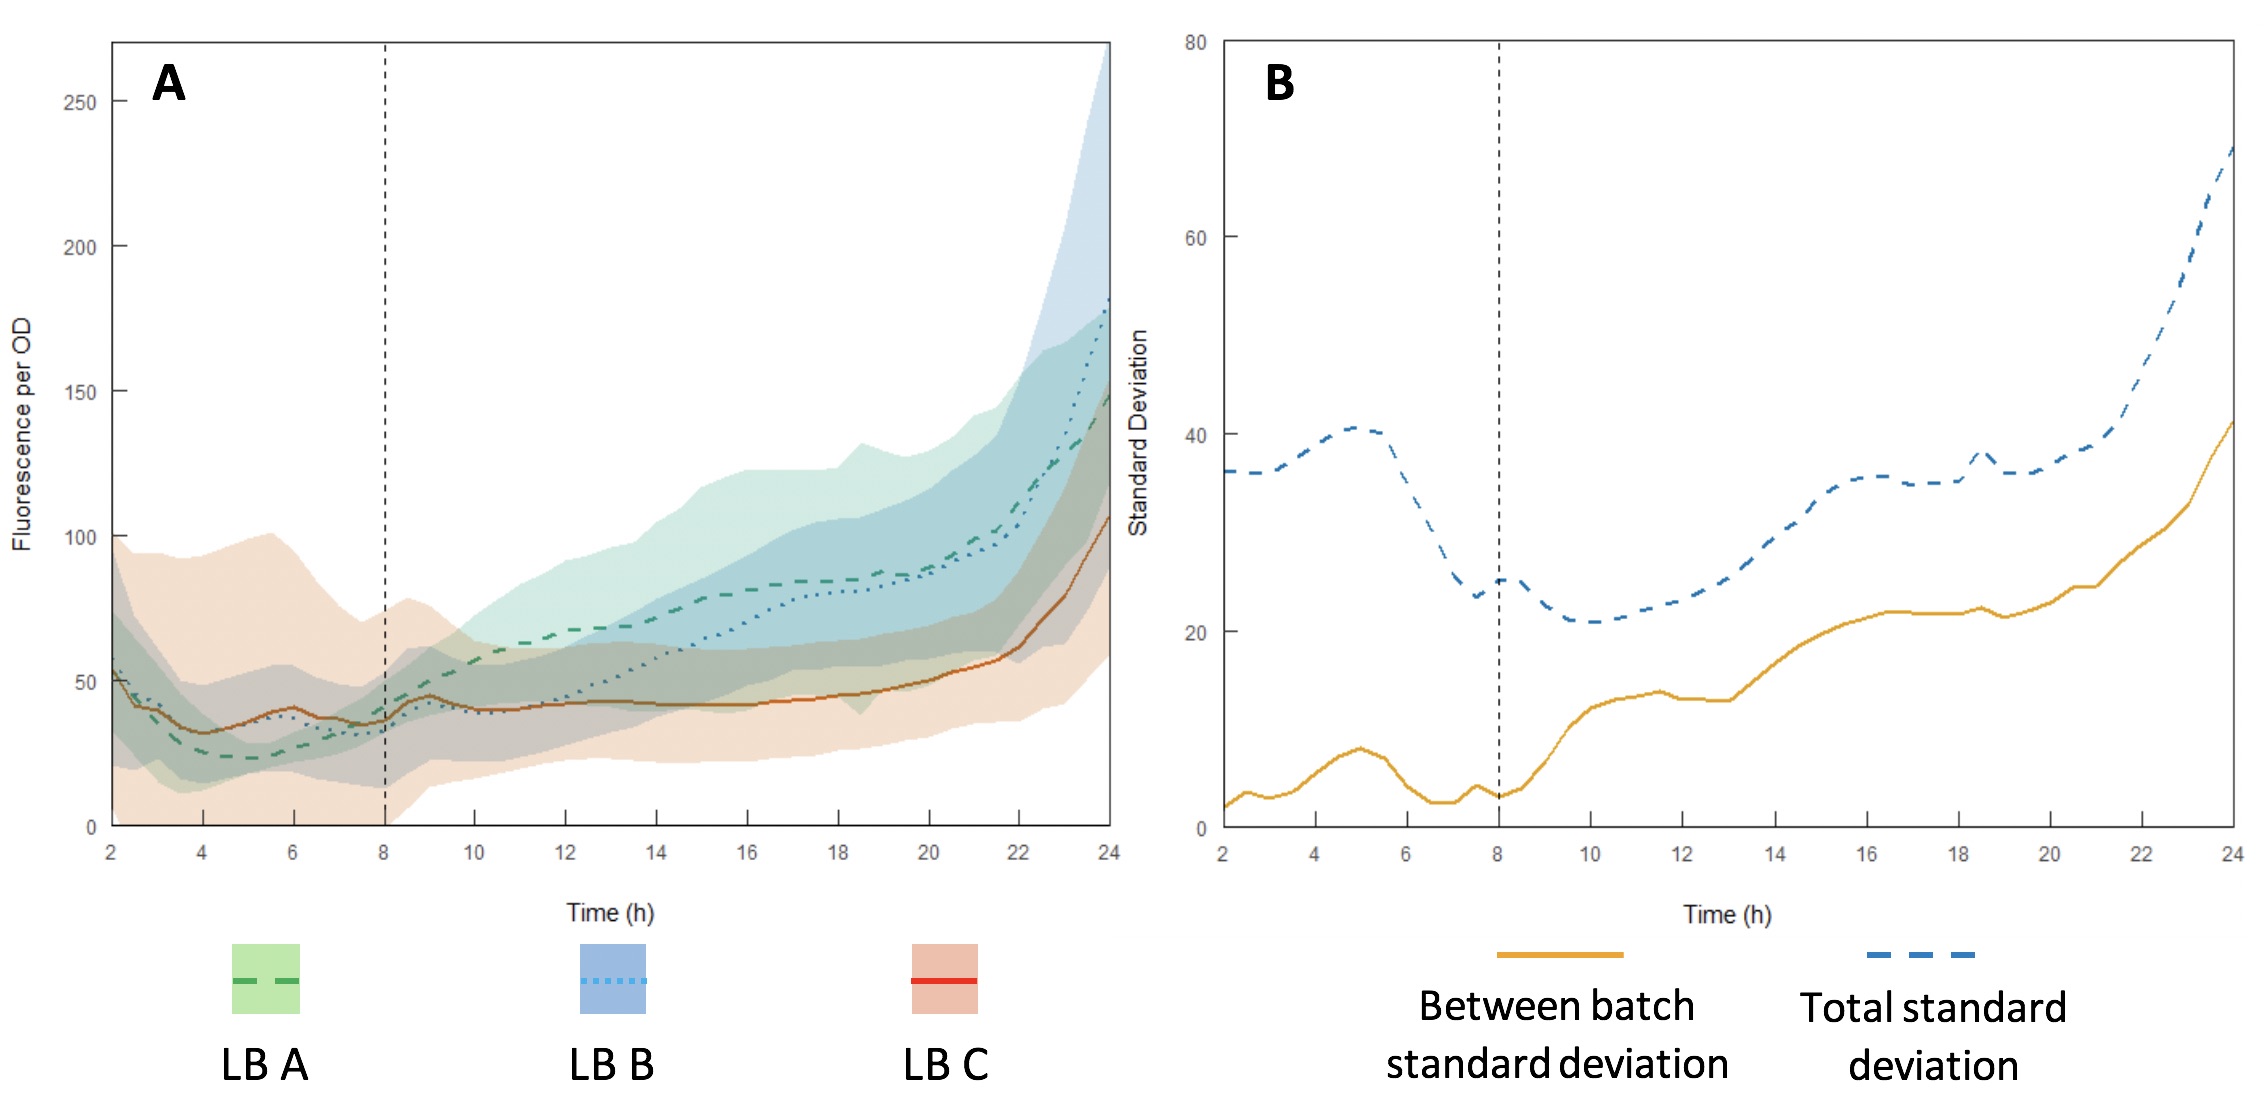
The InterLab study is an opportunity for crowdsourcing a large amount of data on the inherent variability of a given biological system. Here we examined how expression of GFP in the test devices was affected across different batches of Lysogeny Broth (LB) (A-C).
Growth curves were performed using LB A-C (Figures 12A and B) to evaluate variability between batches and within each individual batch. Interestingly, the variation within each batch was greater than the variation between batches, suggesting that the differences in composition of yeast extract and tryptone can be accounted for by having a large enough sample size. However, for comparing expression between studies, total standard deviation is considerably higher. As such, differences in expression may be sufficient to affect the accuracy of comparisons of part performance across the literature.
Defined rich media
Development of a defined media in which variability may be reduced would benefit efforts to attain greater reproducibility and standardisation. Towards this end, we modelled how components of a defined media affected E. coli growth. Growth in defined rich media was assessed and the experimental execution was performed using the OT-2 pipetting robot (Opentrons) (python code for OT-2 protocol available here). After 10 hours, growth was recorded in several runs, with growth in ten runs reaching stationary phase after 24 hours (Figure 13).

The OD600 values at 24 hours were used to build a Projection to Latent Structures (or Partial Least Squares (PLS)) model using JMP software. This allowed visualisation of factor effects on E. coli growth (Figure 15). It is observed that there are positive effects on growth of increasing citrate, thiamine and tricine concentration, while there are negative effects of increasing K2HPO4. Additionally, four interactions between components in the media were shown to be important predictors of DH5α growth. These are interactions between citrate and tricine (VIP = 1.45), thiamine and EDTA (VIP = 1.27), thiamine and tricine (VIP = 1.20) and citrate and thiamine (VIP = 1.11). The media composition predicted by the model to maximise DH5α growth is shown in Figure 14.

From the results here, and from the previously shown membrane permeability altering characteristics of EDTA, it is likely that interactions would be observed with other media components which require active transport into the cell. As such, for the further development of a rich defined media for recombinant expression in DH5α, and with the aim of reducing variability, it would be recommended that EDTA and citrate be omitted - the model produced here predicts good growth is possible without these components. Tricine on the other hand appears to be an excellent buffer for resisting the decreasing media pH as a result of metabolism and inclusion of which is recommended in further development of this media.
Conclusions
The improvement of measurements not only requires the optimisation of the device but also of the ability to standardise the process and reduce variation in test environment. We focused on the optimisation of several InterLab protocols as well as the addition of an internal standard. By modelling E. coli Dh5α growth and transformation we have identified several important factors to optimise reliability and standardise the protocols. By the addition of an internal standard to each test device we can further standardise the results and allow a more accurate comparisons between constructs.
InterLab
References and Attributions
1. Beal J, Haddock-Angelli T, Gershater M, de Mora K, Liarazo M, Hollenhorst J, Rettberg R, I GEMISC. (2016) Reproducbility of Fluorescent Expression from Engineered Biological Constructs in E. coli. PLOS one. DOI:10.1371/journal.pone.0150182
2. Beal J, Haddock-Angelli T,Baldwin G, Gershater M, Dwijayanti A, Storch M, de Mora K, Lizarazo M, Rettberg R, iGEM interlab study contributers. (2018) Quantification of bacterial Fluorescence using independent calibrants. PLOS one. DOI:10.1371/journal.pone.0199432
3. Densmore DM, Bhatia S (2014) Bio-design automation: software + biology + robots. Trends in Biotechnology. 32:111-113
4. Decoene T, De Paepe B, Maertens J, coussement P, Peters G, De Maeseneire SL, De Mey M (2018) Standardisation in synthetic biology: an engineering discipline coming of ages. Critical Reviews in Biotechnology. 38:647-656
5. Hecht A, Filiben J, Munro SA, Salit M (2018) Reproducing bench-scale cell growth and productivity. bioRxiv. DOI:10.1101/302786
6. Carbonell-Ballestero M, García-Ramallo E, Montañez R, Rodríguez-Caso C, Macía J (2015) Dealing with the genetic load in bacterial synthetic biology circuits: convergences with the Ohm's law. Nucleic acids research 44:496-507
7. Vind J, Sørensen MA, Rasmussen MD, Pedersen S (1993) Synthesis of proteins in Escherichia coli is limited by the concentration of free ribosomes: expression from reporter genes does not always reflect functional mRNA levels. Journal of molecular biology 231:678-688
8. Qian Y, Huang H-H, Jiménez JI, Del Vecchio D (2017) Resource competition shapes the response of genetic circuits. ACS synthetic biology 6:1263-127
15. Barbier M, Damron HF (2016) Rainbow Vectors for Broad-Range Bacterial Fluorescence Labeling. PLoS One 11:(3)
10. Levin-Karp A, Barenholz U, Bareia T, Dayagi M, Zelcbuch L, Antonovsky N, Noor E, Milo R (2013) Quantifying translational coupling in E. coli synthetic operons using RBS modulation and fluorescent reporters. ACS synthetic biology 2:327-336
11. Beilharz K, van Raaphorst R, Kjos M, Veening J-W (2015) Red fluorescent proteins for gene expression and protein localization studies in Streptococcus pneumoniae and efficient transformation with Gibson assembled DNA. Applied and environmental microbiology:AEM. 02033-02015
12. Hostettler L, Grundy L, Käser-Pébernard S, Wicky C, Schafer WR, Glauser DA (2017) The bright fluorescent protein mNeonGreen facilitates protein expression analysis in vivo. G3: Genes, Genomes, Genetics:g3. 116.038133
13. Heppert JK, Dickinson DJ, Pani AM, Higgins CD, Steward A, Ahringer J, Kuhn JR, Goldstein B (2016) Comparative assessment of fluorescent proteins for in vivo imaging in an animal model system. Molecular biology of the cell 27:3385-3394
14. Chung CT, Niemela SL, Miller TH (1989) One-step preparation of competent Escherichia coli transformation and storage of bacterial cells in the same solution. Proceedings of the national academy of sciences. 86:2172-2175
15. Klebe RJ, Harris JV, Sharp ZD, Douglas MG (1983) A general method for polyethyleneglycol-induced genetic transformation of bacteria and yeast. Gene. 25:333-341
16. Zhiming T, Guangyuan H, Kexiu XL, Mingjie JC, Junli C, Ling C, Qing Y, Dongping PL, Huan Y, Jiantao S et al. (2005) An improved system for competent cell preparation and high efficiency plasmid transformation using different Escherichia coli strains. Electronic Journal of Biotechnology. 8:114-120
Attributions: Kyle Stanforth, Sam Went & Matthew Burridge