Team:Oxford/Model/Killswitch
Kill Switch
Reactions modelled and Description
The kill switch has been designed to be activated by Tetracycline which binds to TetR and inhibits repressing Endolysin. Therefore, the two negative effects would result in Endolysin transcription and translation which burst the cell. ACT bind with TetR much quicker than transcription or translation and hence it has been assumed that both binding and repressing transcription factor could be represented by an activating transcription factor expressing endolysin. Therefore, the following are the chemical reactions modelled apart from the first one which is assumed to happen instantaneously. A detailed reaction pathway is given in Figure 1.
$$ 1. \, \text{TetR} + \text{ATC} \rightarrow \text{complex} $$ $$ 2. \, \text{complex} + TF \rightarrow \text{Endolysin mRNA}$$ $$ 3. \, \text{Endolysin mRNA} \rightarrow \text{Endolysin}$$ $$ 4. \, \text{Endolysin mRNA} \rightarrow 0$$ $$ 5. \, \text{Endolysin} \rightarrow 0$$the Differential equations describing the reactions could be written as follow
$$\frac{d[\text{Endolysin mRNA}]}{dt} = \frac{\beta[\text{ATC}]^n}{K^n+[\text{ATC}]^n} - \alpha_1 [\text{Endolysin mRNA}], $$ $$\frac{d[\text{Endolysin}]}{dt} = k_1[\text{Endolysin mRNA}]-\alpha_2[\text{Endolysin}], $$
Parameters and Critical Concentration
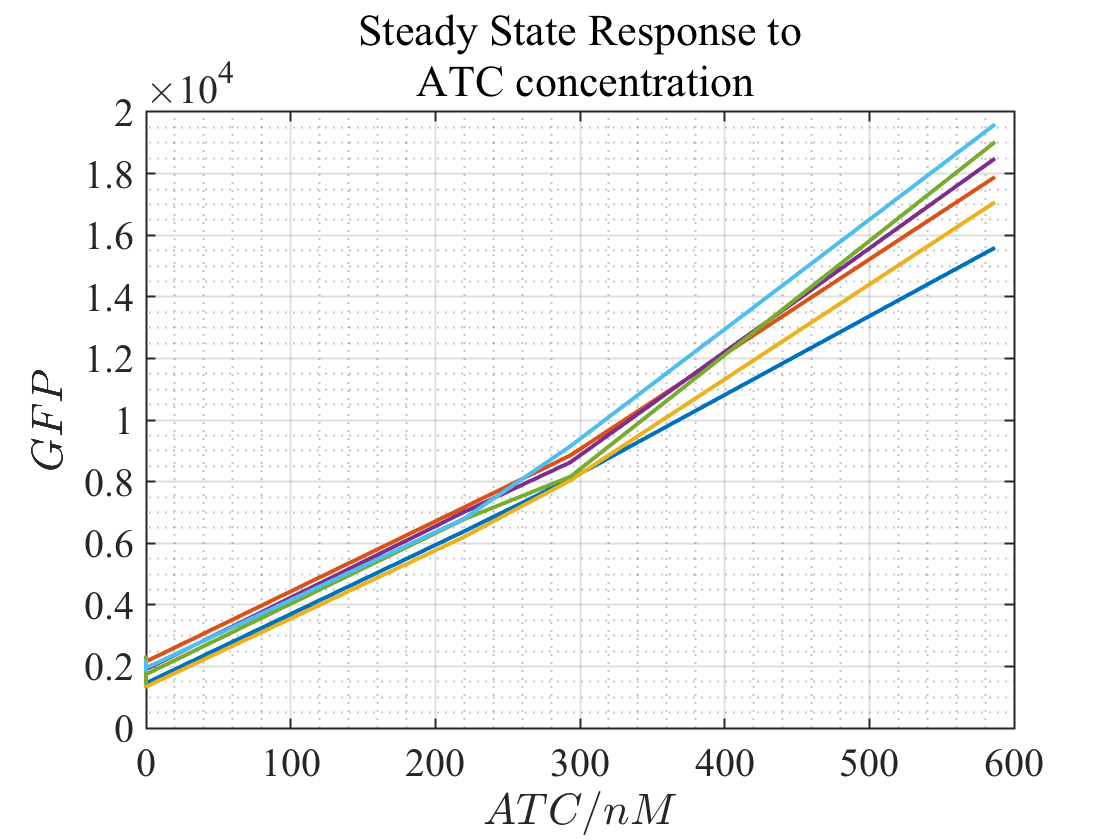
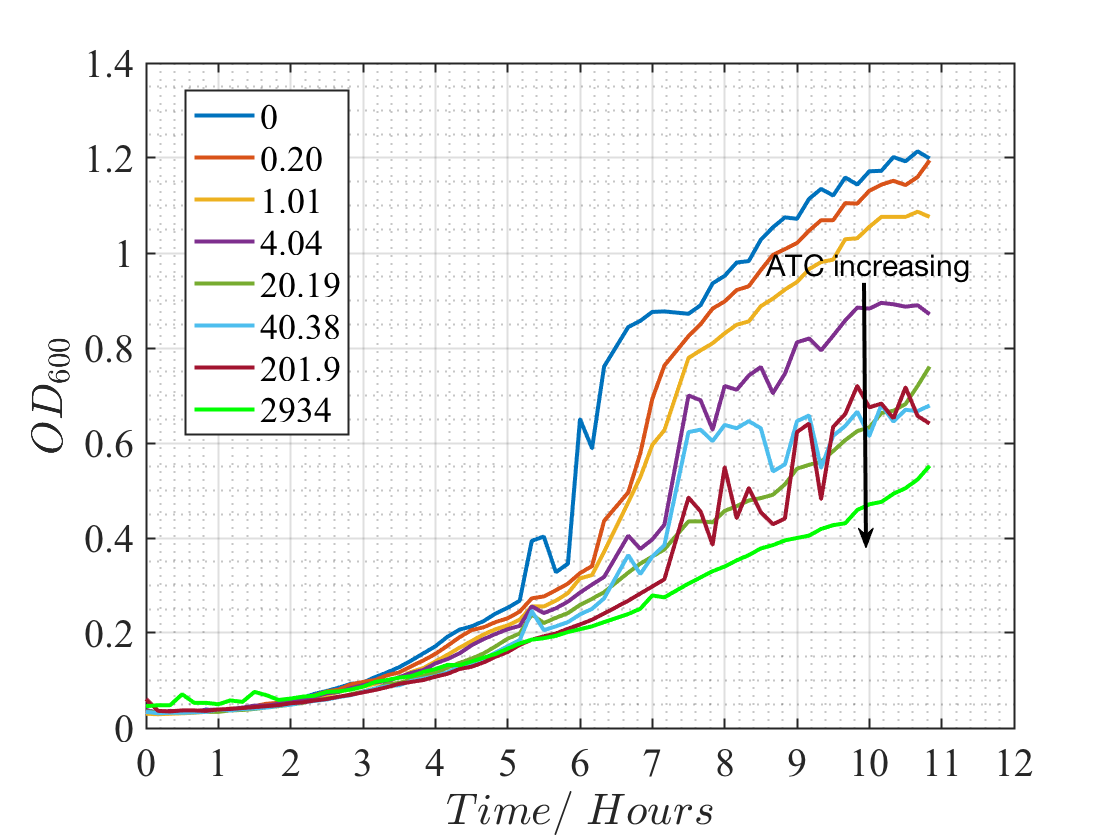
Some of the parameters used for kill switch modelling are the same as our time domain analysis namely, \(\alpha_1\) and \(\alpha_2\). The value for \(\beta\) was determined by fitting a Hill function to the experimental data shown in Figures 2 and 3. The dilution or degradation rate of both Endolysin mRNA and Endolysin are assumed to be the same as those of IL10. The translation rate of Endolysin was assumed to be \(0.399 \, min^{-1}\) from a simple interpolation based on the number of the base pairs. Finding the critical concentration of Endolysin that would "kill" the cell introduced some difficulties in the model. Due to time constraint the hydrolysis of bacteria elements by endolysin was not modelled and hence, an empirical method was required to determine an overestimation for this critical value. Different concentrations of ATC were introduced to cultures of E.coli and the number of bacteria was recorded against time. Endolysin was also plotted against ATC. The graph showing bacteria population dynamics could be used to determine at what specific concentration of ATC the dynamic changes and hence what minimum level of Endolysin would manage to overcome the population growth. The experimental results are summarised in Figures below.
The steady state model for the kill switch could be obtained by equating ODEs stated above to 0. By doing so the following expression could be derived and hence, a time-independent equation for Endolysin and ATC that could be plotted.
$$ [\text{Endolysin}]^* = \frac{k_1\big(\frac{\beta[\text{ATC}]^n}{K^n+[\text{ATC}]^n}\big)}{\alpha_1 \alpha_2} $$
The experimental results from the lab was used to fit the Hill function above for a more realstic evaluation of \(\beta\). Due to time constrain and practical limitations the exeriments were done with a narrower concentration band for ATC and hence the graph below has fitted to the middle section of the Hill function yeilding roughly \( \beta \approx 1 nMmin^{-1}\).
The critical concentration of ATC was determined empirically by observing E.coli population dynamics when introduced to different concentrations of ATC. It is clear from the graph below that the dynamics of the population and cell growth has changed significantly when ATC has reached a concentration of \( 1 \, nM\) and hence, this value was used to calculate the critical concentration of Endolysin and the settling time when higher dosages of ATC is used.
Dynamics of Our Kill Switch
After determining all required parameters, the ODEs stated at the top of the page could be solved numerically and hence Endolysin Concentration could be plotted against time. ATC concentration was changed about the critical value of \(1 nM \) and the dynamics were plotted on the same graph (Figure 5). The critical concentration of Endolysin could also be determined by looking at the steady state value for \(ATC = 1\, nM\).
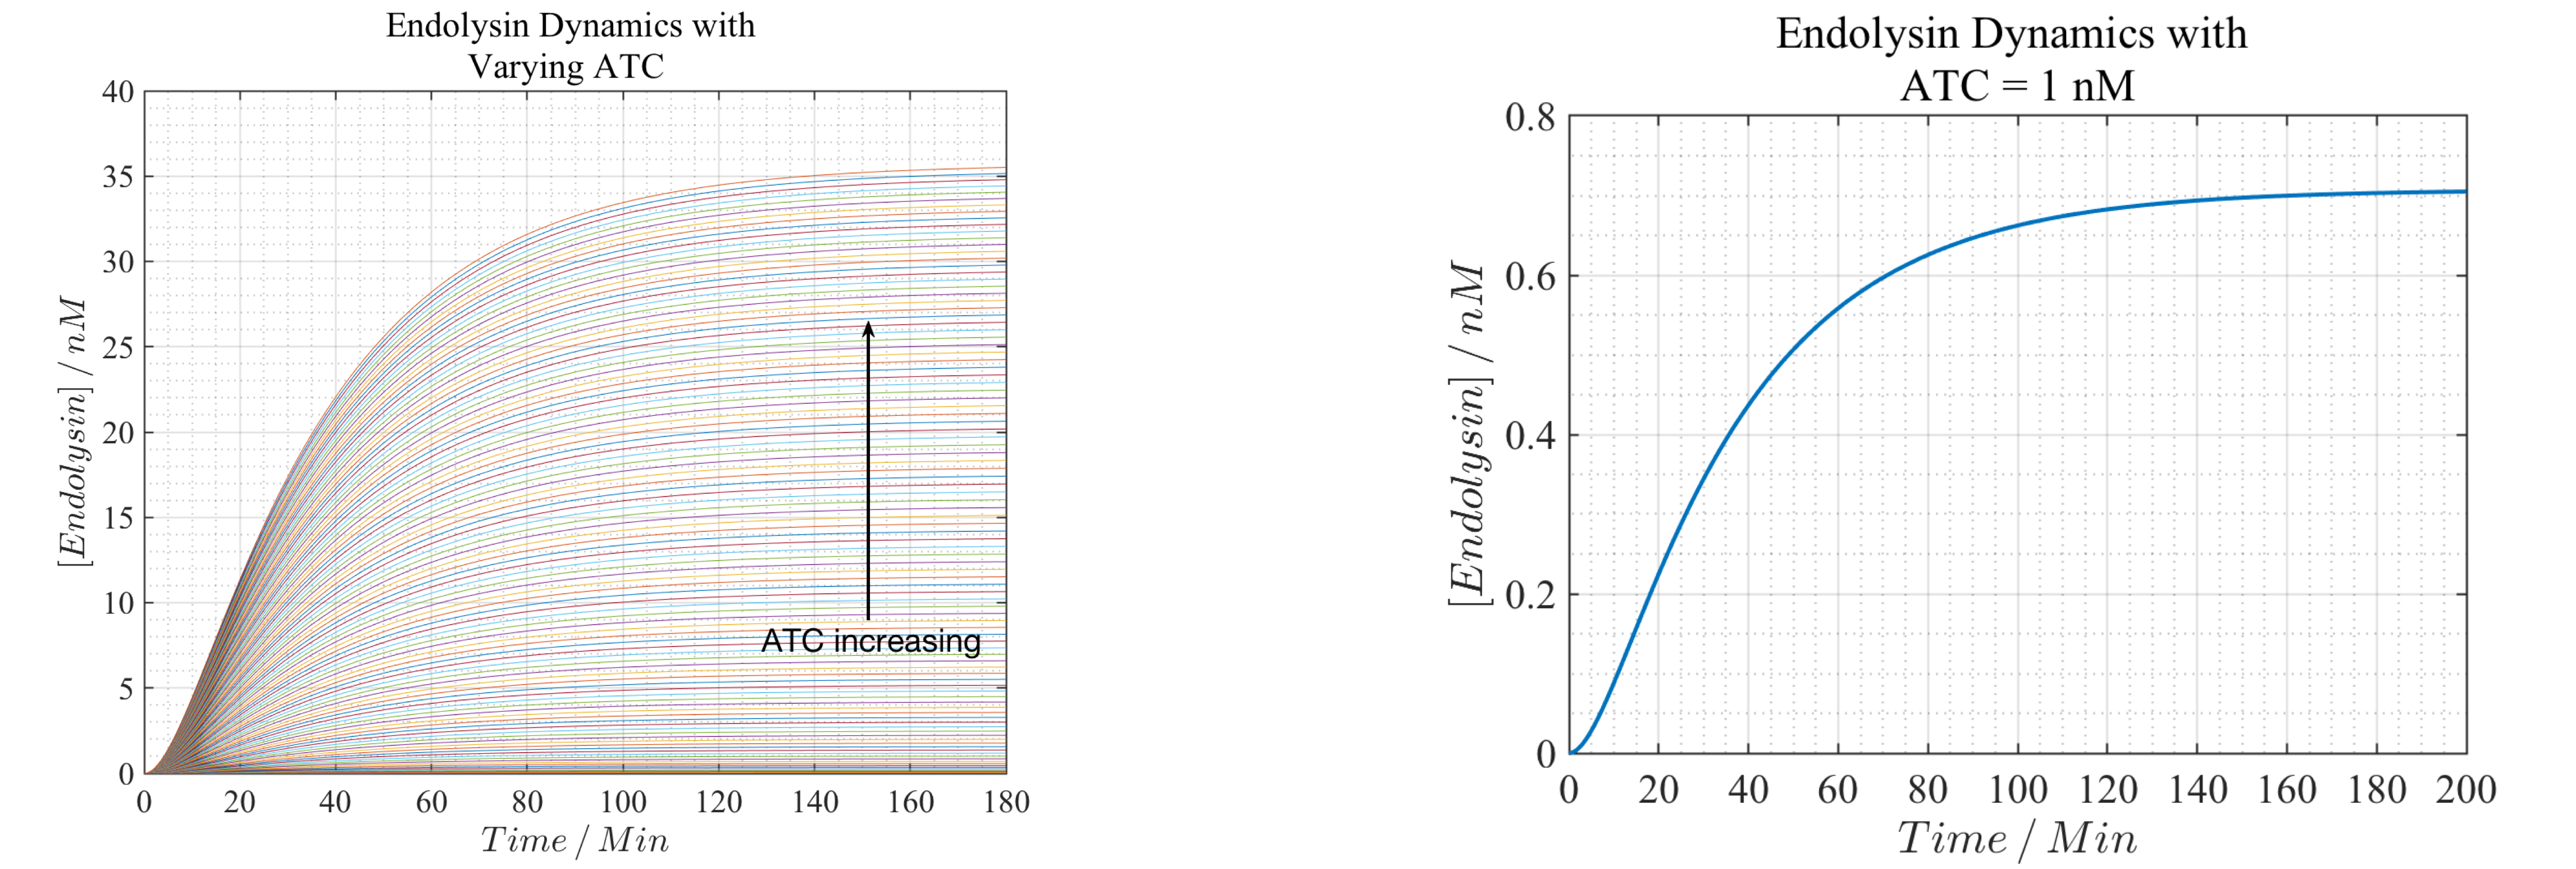
It is clear from the graph that the critical concentration of Endolysin is about \(0.7 \, nM\) and hence, any dynamics with a higher steady state value would "Kill" the cell quicker than 180 minutes. A plot could therefore be drawn which shows the variation of "Killing time" or the time taken by the system to reach the critical endolysin concentration against ATC concentration (Figure 6). This plot is extremely useful in adjusting the dosage of ATC for a safe and quick response with minimum side effects and antibacterial resistance effects.
