Team:SUSTech Shenzhen/Engineered systems
Double emulsion system
Double emulsion system consists of several components: microfluidic chips, computers with Flow rate control software, light microscope, electronic pumps, fluorescence microscope and connecting tubing. Each component can be commercially obtained from Dolomite Corporation. It has a general protocol for emulsion of cells and beads. We are the first one improve the protocol for encapsulation of two cells.

Figure 1: The components of double emulsion system

Figure 2: A photo of double emulsion system
Results of Double emulsion systems
1) Principles

Figure 3: Workflow of microfluidic chip for double emulsion
Wnt secreting cells and Wnt responding cells are inserted into two channels in the first stage of emulsion producing water-in-oil droplets. The water-in-oil droplets are then inserted into the second stage microfluidic chip to produce water-in-oil-in-water droplets which can be used in Flow cytometry. See more principles, components and protocols of double emulsion system.
2) Parameter determination:
a) Determination of concentrations of cell
Cell concentration is a key parameter in the encapsulation process. It determines the throughput magnitude of the whole system. Because one microdroplet only have few nanoliter in volume. A decrease of volume will result in large quantity of droplets which contain no cell. So higher concentration of cells is better.
In the experiment, concentration of cells is around 106-107/mL. Concentration higher than 107/mL may not work well in the microfluidic chip because the viscosity of the medium is too large to run in the chip and it is very likely to block the channel. Therefore, we optimized the concentration reaches the maximum concentration around 107/mL.
b) Determination of suspension medium density
Cells have a higher density than culture medium, DMEM. So we need to adjust the medium density close to cells in order to make cells suspend in the medium resulting in stable flow rate in the channel. Otherwise, the channel will be aggregate lots of cells at the entry of the microfluidic chip. Optiprep are the density gradient medium we used which does no harm to cells. We need to determine the density of the suspension medium according to the table below:

Figure 4: Determination of medium density
From the experimental result, Wnt secreting cell have a density of 1.06g/mL while Wnt responding cell have a density of 1.055g/mL
c) Determination of droplet size and production rate
The droplet size generated from 30um chips ranges from 25-35um. Due the cell size ranging from 10-15um, the microfluidic chip hardly encapsulates three cells or more in one droplet. The production rate of 30um droplets is around 11800 droplets per second. So around 20minutes, few million droplets will be generated in the first stage of emulsion.

Figure 5: Parameters of microfluidic chips in different size.
3) Encapsulation efficiency
We defined encapsulation efficiency as below:
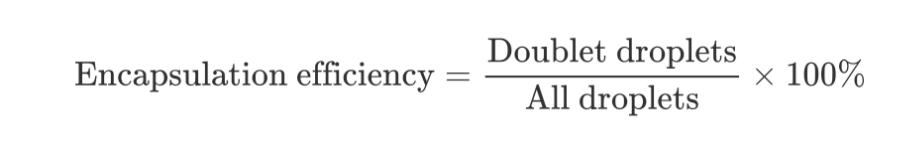
During the encapsulation of cells, there are four situations of droplets after encapsulation:
A: Droplet without cells
B: Droplet with a single cell
C: Droplet with two cells from the same channel
D: Droplet with two cells from different channels
The encapsulation efficiency is mainly calculated based on Poisson distribution. In theory we get an encapsulation efficiency around 1.64%. Since there are few million droplets are produced at the first stage of emulsion, the number of droplets ranges from ten thousand to a hundred thousand. For genetic screening of Wnt secreting cells, it is possible to have whole genome knockout because there are approximately 20000genes multiplying a factor of 500 replicates to lower down the false positive. In our actual experiment, we tried the double emulsion and got the real encapsulation efficiency between 1-2%. We improved the encapsulation efficiency after many times of optimization.
The result are shown below:
In Figure 6-7, we can observed two cells from two channels are successful encapsulated in a droplet. Two types of cells from different channels have different fluorescence.

Figure 6: Droplet observation under light microscope. (Doublet and singlet droplet)

Figure 7: Droplet observations under fluorescence microscope. (Cells with green fluorescence and red fluorescence; Pictures are merged via Image J)
Optimization strategy of Encapsulation efficiency
One strategy is to increase the concentration of cells. We reach the best optimization of concentration at 107/mL. This will increase the encapsulation efficiency of the first stage of emulsion.
Another strategy is to increase the second stage of emulsion. We can optimize to have a faster speed of the droplet and lower speed for the buffer oil. We finally have a encapsulation rate near 100% at the second stage of emulsion.
4) Cell viability test
Our cells are cocultured in droplets which is important to know the cell states in time series within the droplet. We mimic the situation of cells in droplets using 1.5mL Eppendorf tubes.

Figure 8: Cell viability under different conditions
Cell death rate under different conditions(Standard conditions: on ice, DMEM, place in 1.5mL tube, close lid, Flow cytometry after PI staining)
Within different conditions, the preferred conditions for cell culture may be: PBS buffer as culture medium and 25 degree centigrade.
Here, reasons why we use collection of cells in 1.5mL tube instead of double emulsion droplets are need to be explained:
1. No cell reactive dye is suitable compatible for droplet situation. The droplet has so little volume of culture medium so that the concentration of dye will be too low to be effective. So we couldn’t track the cell viability in time series
2. In principle, we can detect the cell death rate after we break the droplets in time series. But, the breaking of droplets require strong hydrophobic and hydrophilic separation which will have a disastrous contribution on cell death rate. We estimate that the death of cells caused by breaking the emulsion droplet is far more than it caused by culture in droplets

Figure 9: Cell death rate in time series.
In conclusion, cells in droplets may survive around 6-8hours. This will be a key limitation for coculture methods.
5) Flow cytometry analysis of droplets
To confirm that droplets can be observed by Flow cytometry, we stain two types of cell with green fluorescence.

Figure 10: The population in purple are intact droplets after double emulsion

Figure 11: Droplet distribution (Gray: droplets contain no cell; Red: droplets contain one cells, Green: droplets contain two cells)
From the result, we concluded that 30um droplets can actually be used for FACS sorting for selection of target cells.
Micro-well system

Figure 12: Components of micro-well system
Micro-well system is an orthogonal design for capture of two cells in collaboration with Prof. Xin Cheng’s Group in Material Sciences. It has the components of power injector, stabilized voltage supply, fluorescence microscope, computer and micro-well plates with electrodes in each wells. The two single cells can be capture one by one in the micro-well by the electrostatic force generated by the electrodes underneath the well. The micro-well has a size of 28um in depth and 100um in diameter. The 3D structure of the well is shown in Figure.

Figure 13: Capture of a Wnt-secreting cell and a Wnt-responding cell after 22 hours
From Figure 13, two types of cells are capture in a micro-well and coculture after 22 hours. Cells have good stage in the micro-well. Know more about the physical structures and protocols for micro-well system.
©2018 SUSTech_Shenzhen
