Team:TJU China/Model
<!DOCTYPE >


Dynamic Model of Heavy Metal Detection Biosensor
1 Introduction
Modeling is a powerful tool in synthetic biology. It provides us with a necessary engineering approach to characterize
our pathways quantitatively and predict their performance,thus help us test and modify our design.Through the dynamic
model of heavy-metal detection biosensor,we hope to gain insights into the characteristics of our whole circuit's
dynamics.
2 Methods
2.1 Analysis of metabolic pathways
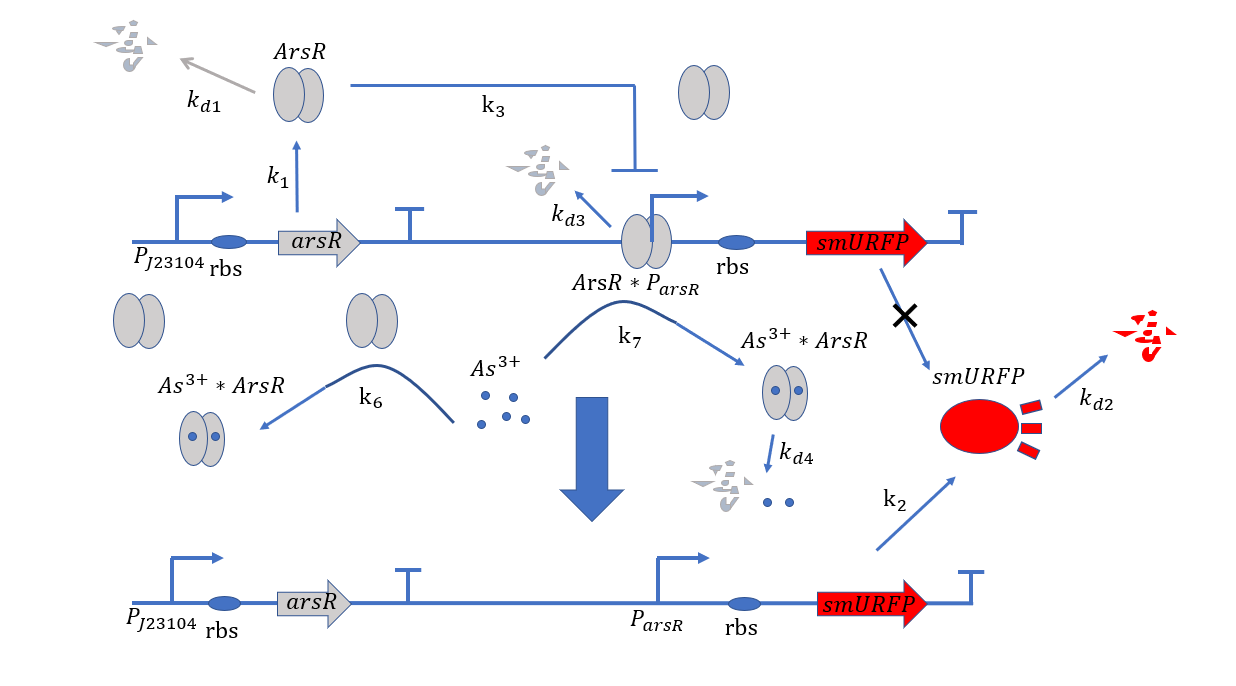
Figure 1. Metabolic pathways related to plasmid#1
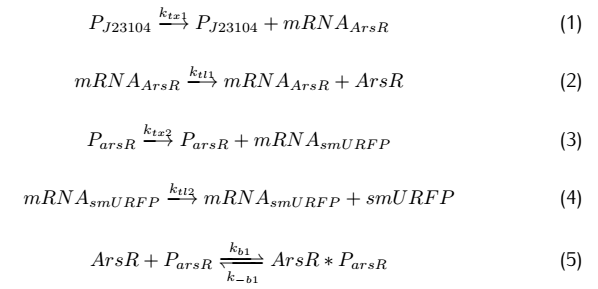
At the beginning, on the plasmid#1, the promoter $P_{arsR}$ isn't bound with ArsR,thus it is active.ArsR and smURFP are
transcribed and translated under the control of the promoters $P_{arsR_{u}}$ and $P_{arsR_{d}}$,with subscript u
and d representing upstream and downstream separately.The subscript l of smURFP in the equation means leaky expression
without the expression of $As^{3+}$.As ArsR is expressed gradually,it will bind with the promoter $P_{arsR}$ and
make it inactive.[1]
On the plasmid#2,the fusion protein of dCas9 and RNAP(RNA polymerase) are produced after transcription and translation,and
sgRNA is produced after transcription.
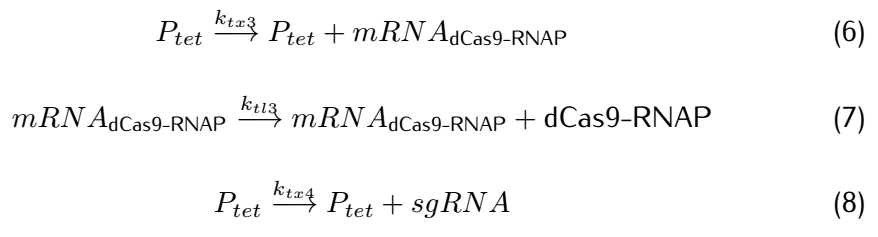
Figure 2. Metabolic pathways related to dCas9/RNAP
dCas9(*RNAP) can bind with its target DNA sequence without cutting, which is at the upstream of the promoter $P_{arsR_{d}}$.Simulataneously,dCas9
can lead RNAP to bind with the promoter $P_{arsR_{d}}$ and enhance the transcription of smURFP.However,because the
promoter $P_{arsR_{d}}$ has already bound with ArsR,as a result,RNAP can't bind with the promoter $P_{arsR_{d}}$.
can’t bind with the promoter $P_{arsR_{d}}$.
However,at the presence of $As^{3+}$,it can bind with ArsR,then dissociate ArsR and $P_{arsR_{d}}$ , which makes the
combination of RNAP and $P_{arsR_{d}}$ possible.
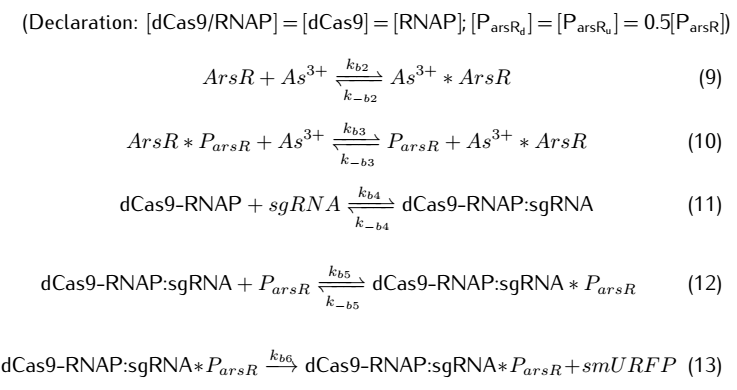
We then take degradation into account:
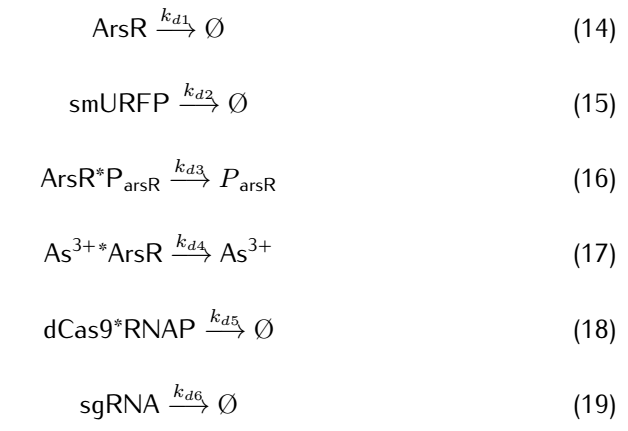
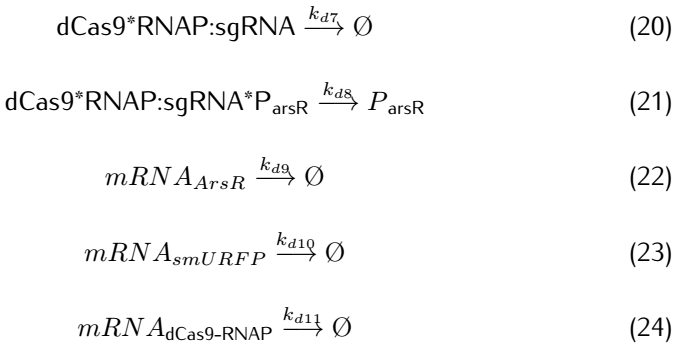
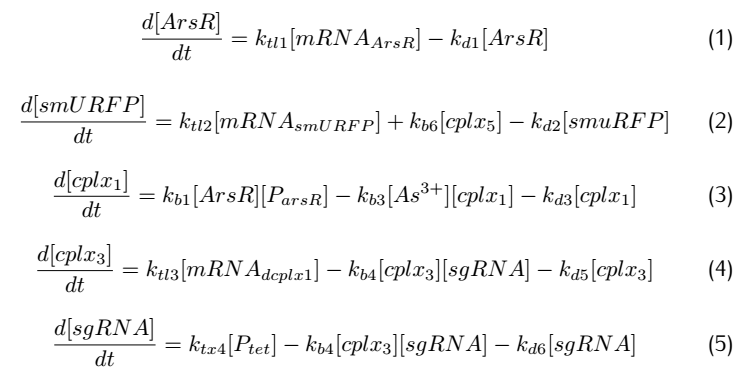
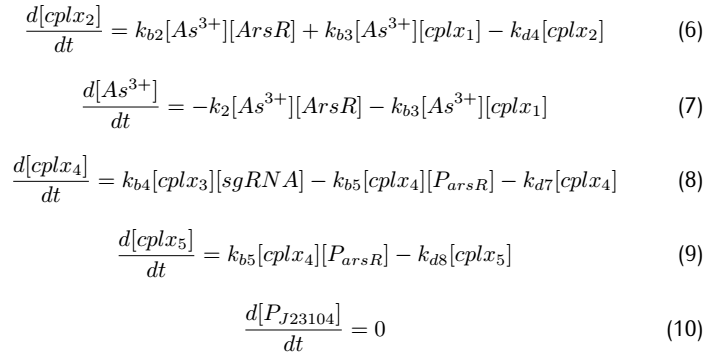
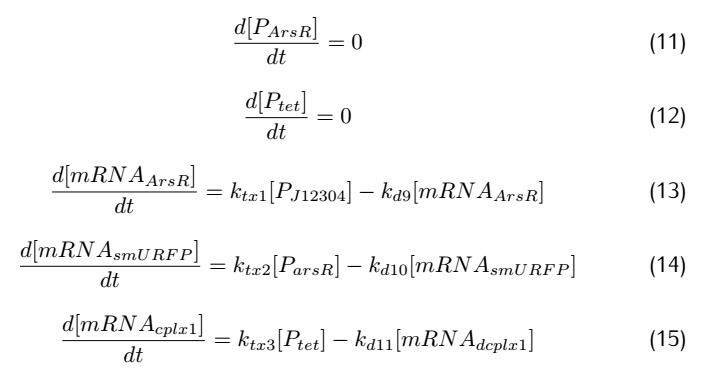
2.2 Analysis of ODEs
Applying mass action kinetic laws,we obtain the following set of differentiak equations.The several complexes involved:Ars$R^*$$P_{arsR}$,$As^{3+}$,${dCas9}^*$RNAP,${dCas9}^*$RNAP:sgRNA,${dCas9}^*$RNAP:${sgRNA}^*P_{arsR}$,
are respectively abbreviated as $cplx_1$,$cplx_2$,$cplx_3$,$cplx_4$,$cplx_5$.
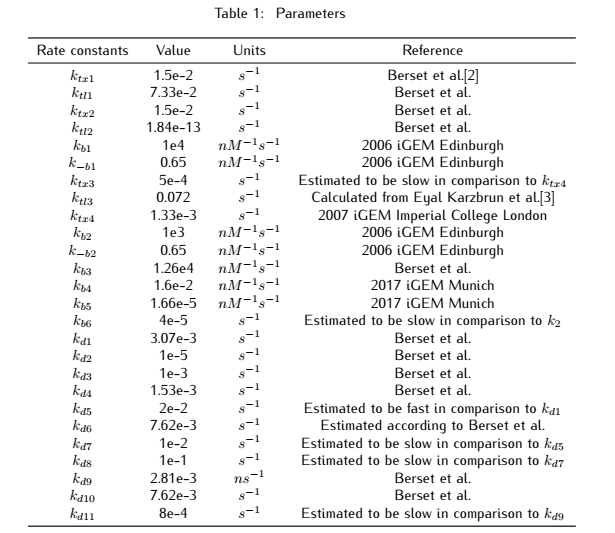
2.3 Simulation
Our simulation is based on two softwares: MATLAB (SimBiology Toolbox) and COPASI.
SimBiology Toolbox provides functions for modeling,simulating and analyzing biochemical pathways by the powerful computing engine of MATLAB.
SimBiology Toolbox provides functions for modeling,simulating and analyzing biochemical pathways by the powerful computing engine of MATLAB.
Figure 3.Reaction map generated from the reaction sets above by SimBiology Toolbox
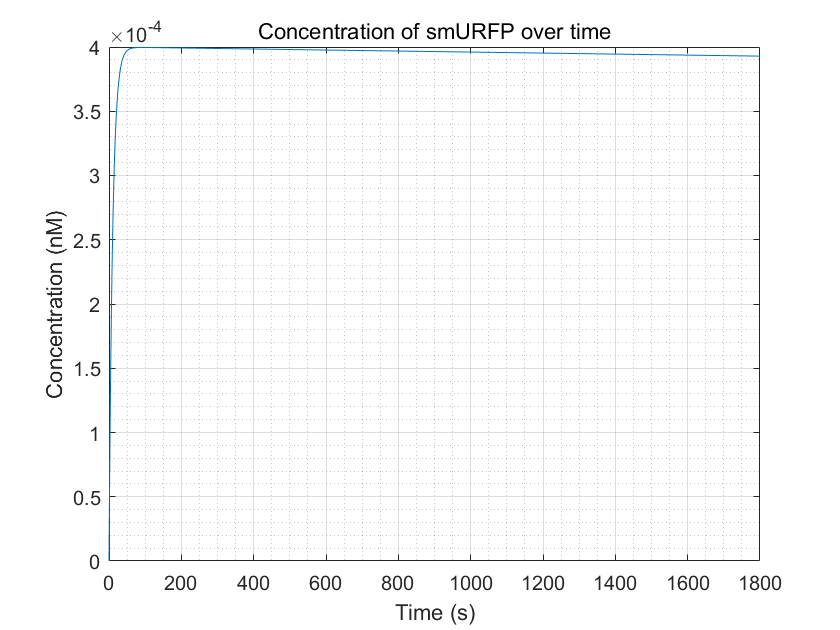
Figure 4.Simulation of smURFP production as a function of time by MATLAB Through the figure, we can see that the smURFP
can gradually increase and reach a steady state after a period in the presence of arsenic ions.
2.4 Sensitivity
A good biosystem should have certain stability towards fluctuations in parameters.A good model should reflect this,and
hence a test for robustness can be essential to the model.
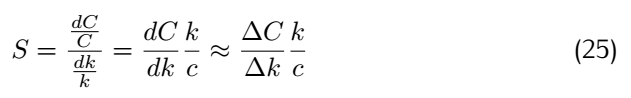
Robustness analysis can also pinpoint which reactions/parameters that are important for obtaining a specific biological behavior.A simple measure for sensitivity is to measure the relative change of a system feaure due to a change in a parameter.As for our model,the feature can be the equilibrium concentration of the smURFP(C) for which the sensitivity(S) to a parameter k is:
Robustness analysis can also pinpoint which reactions/parameters that are important for obtaining a specific biological behavior.A simple measure for sensitivity is to measure the relative change of a system feaure due to a change in a parameter.As for our model,the feature can be the equilibrium concentration of the smURFP(C) for which the sensitivity(S) to a parameter k is:
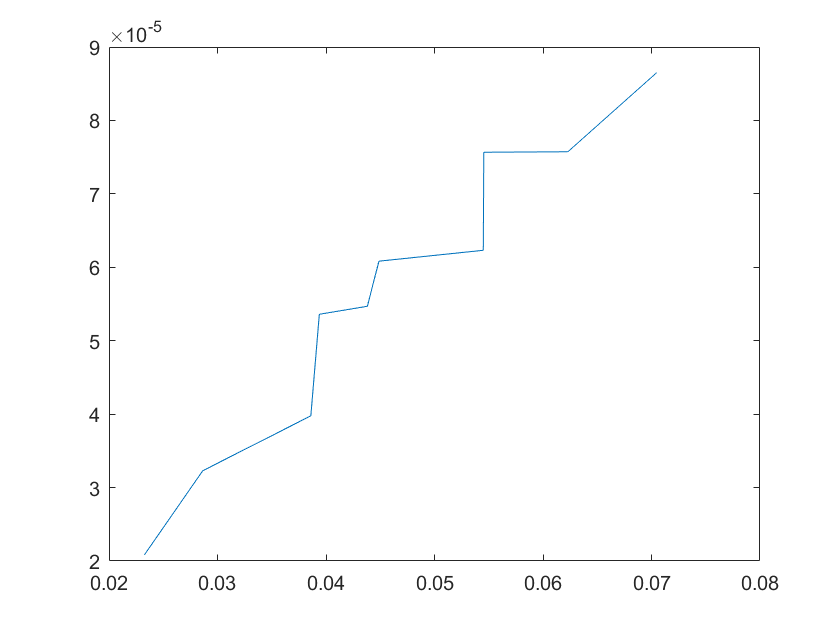
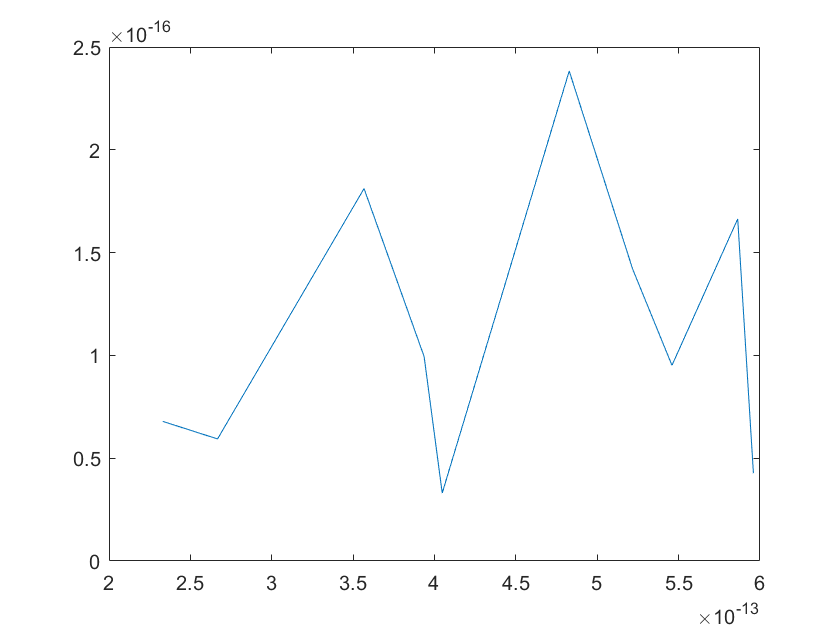
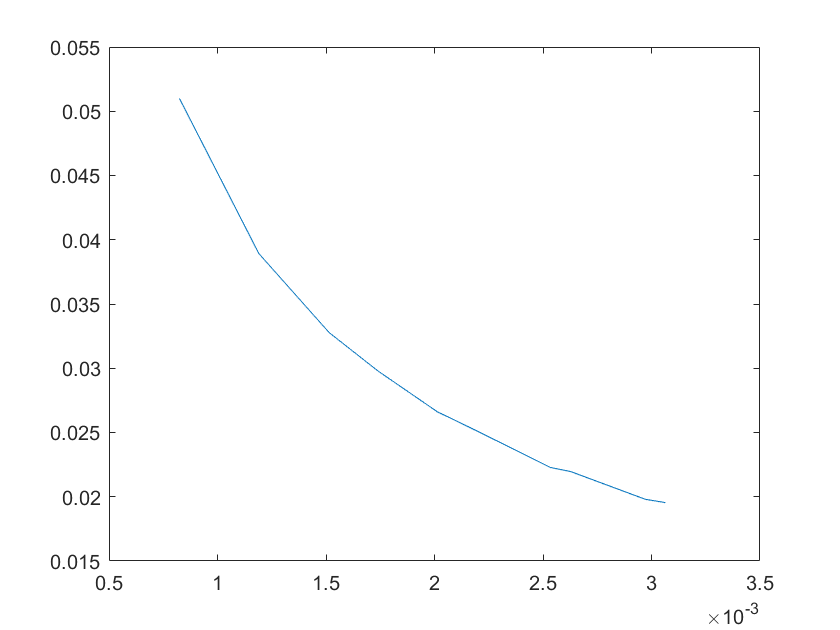
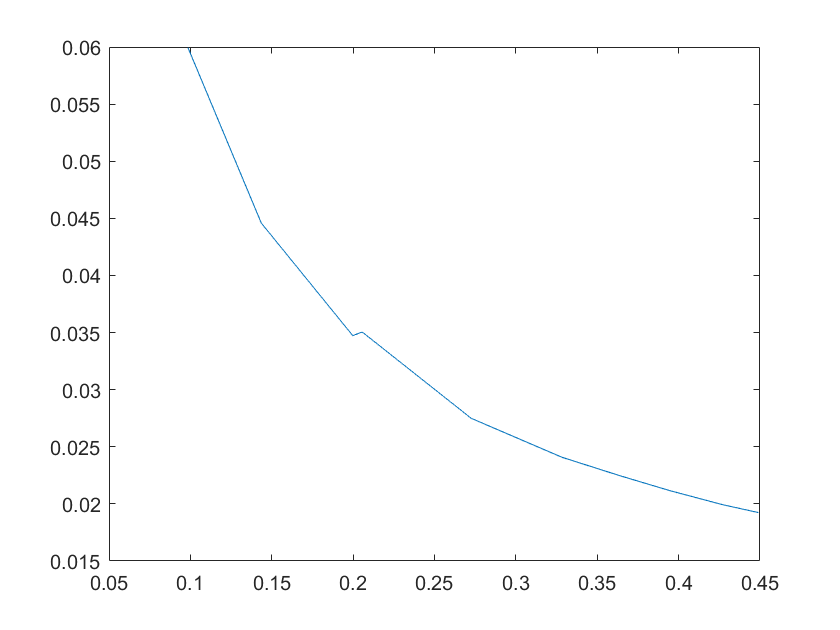
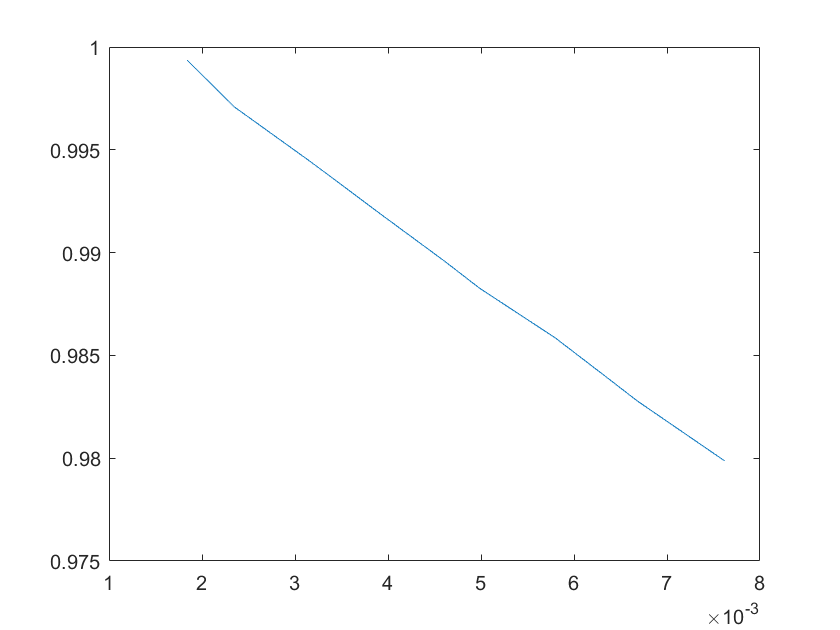
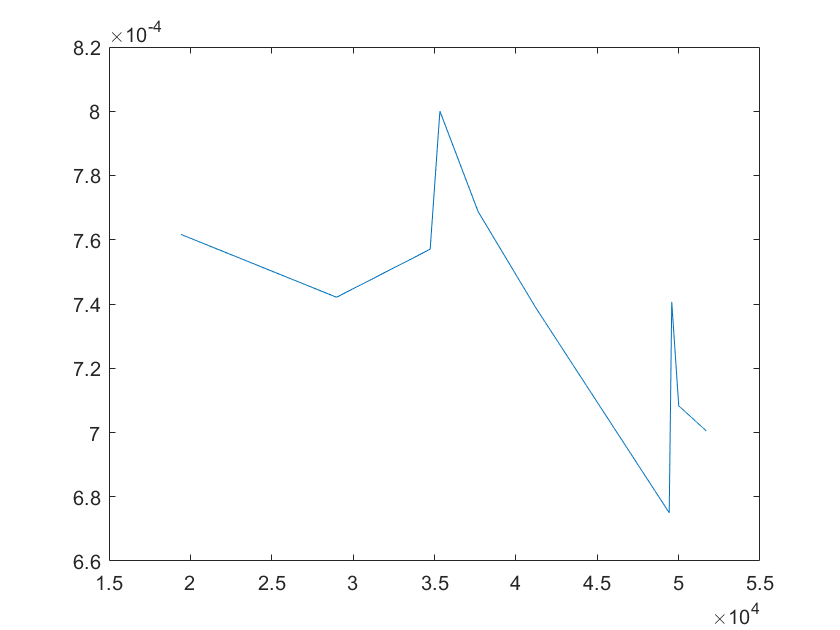
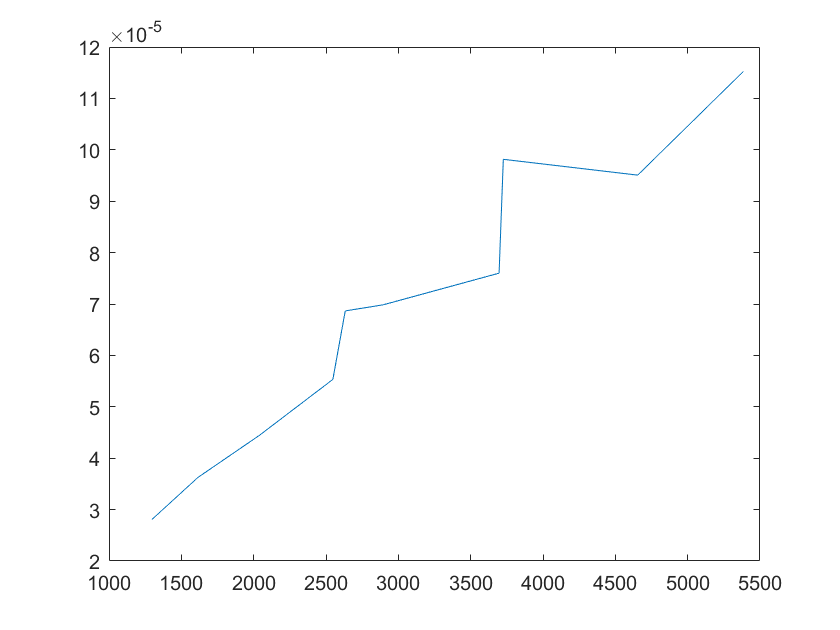
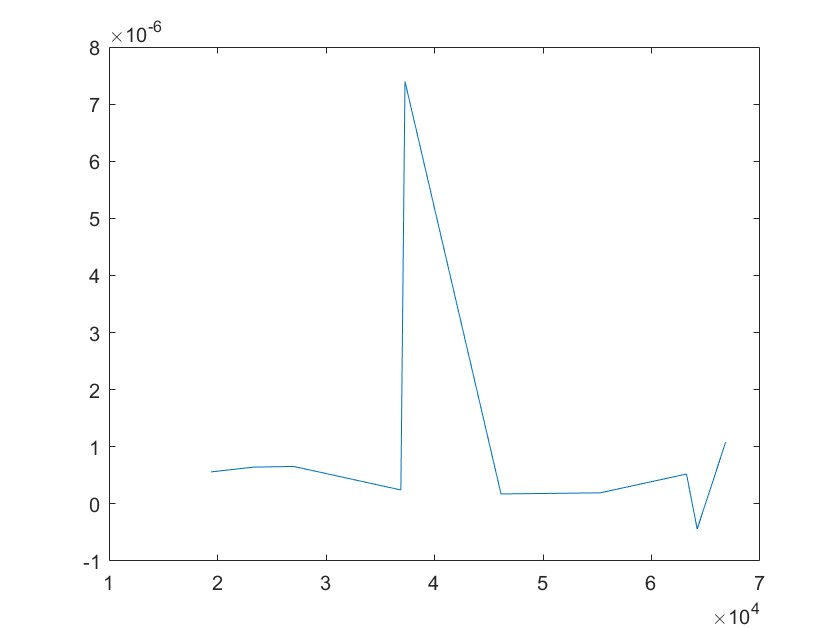
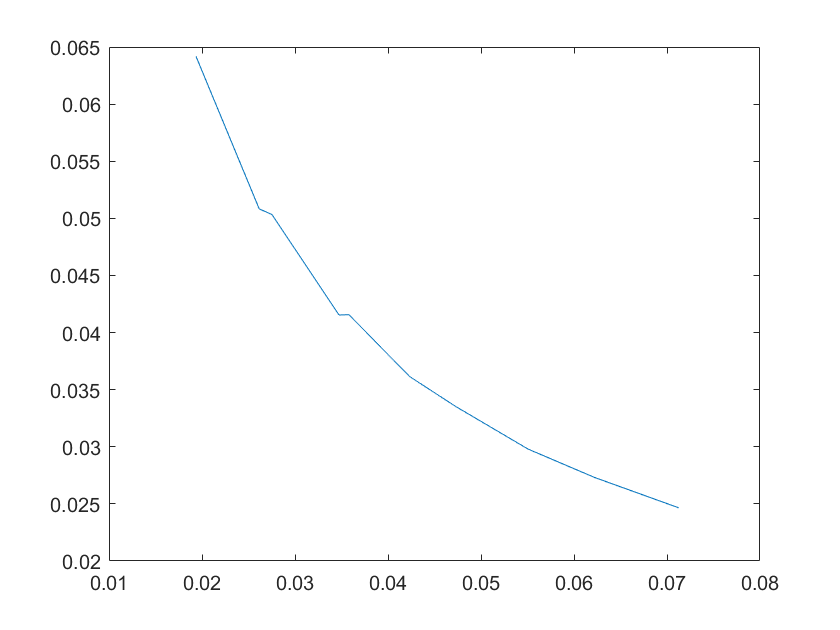
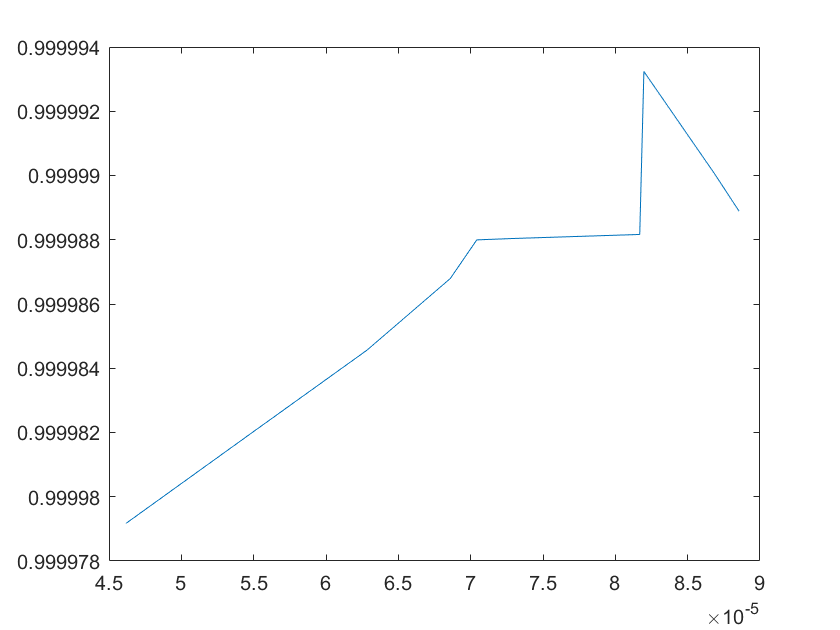
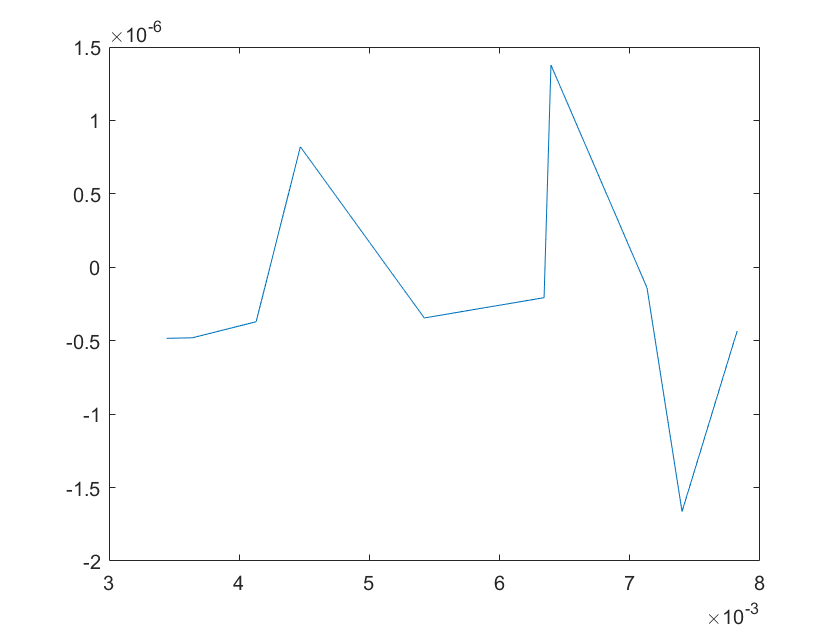
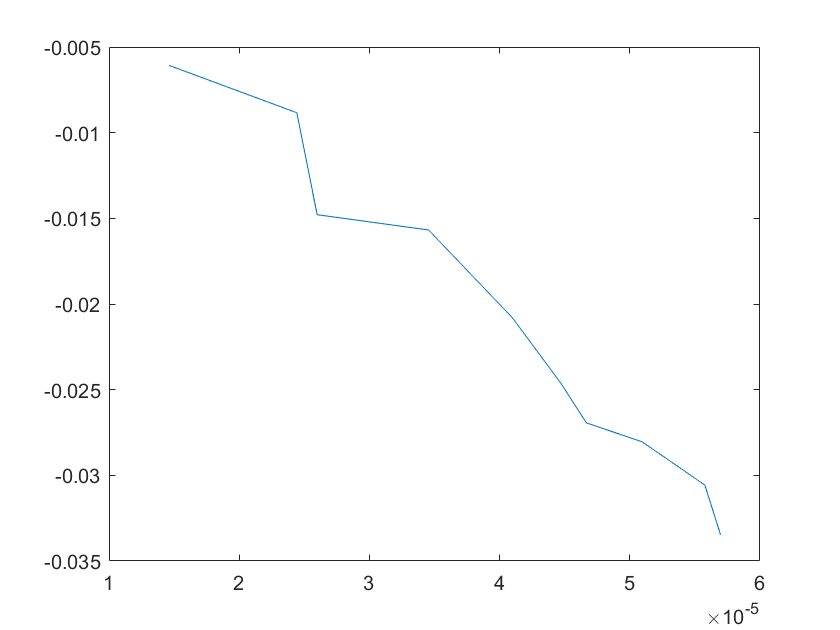
After analysis, we found that the concentration of smURFP is relatively sensitive to parameters such as ktx3,ktl3,ktx4,kb4,kb6,kd2,kd5,
kd6,kd7,kd8,kd11, etc. Among these parameters, except for the parameters that directly affect the production and
degradation of smURFP,the rest of them are all related to dCas9-RNAP:sgRNA. It shows that our model reflects the
critical role of dCas9-RNAP:sgRNA,which initially confirms our hypothesis:dCas0-RNAP can enhance transcription to
increase the concentration of smURFP. However, due to the lack of previous modeling studies on dCas9-RNAP,some kinetic
parameters may not be very accurate,and due to time limitation,we have not implemented experiments to measure related
parameters,which may lead to some deviations in our model.
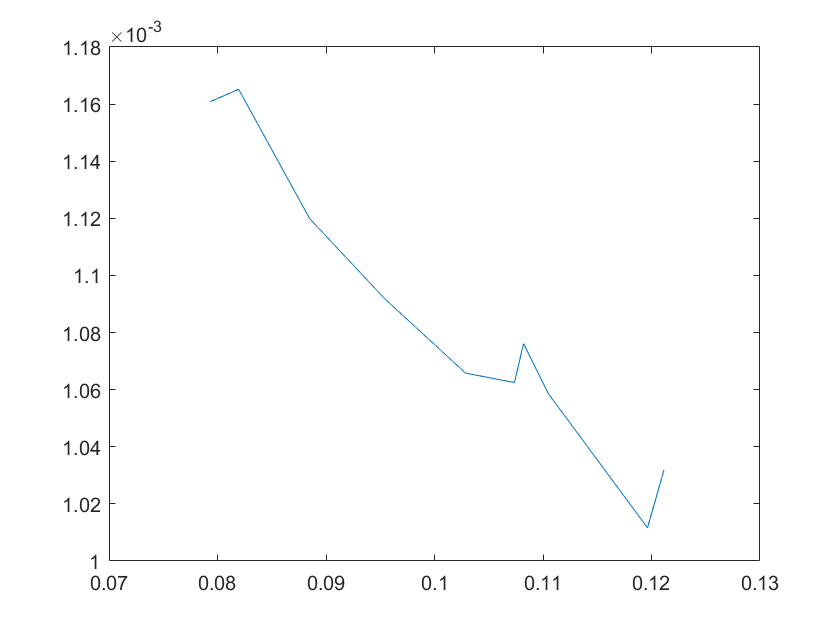
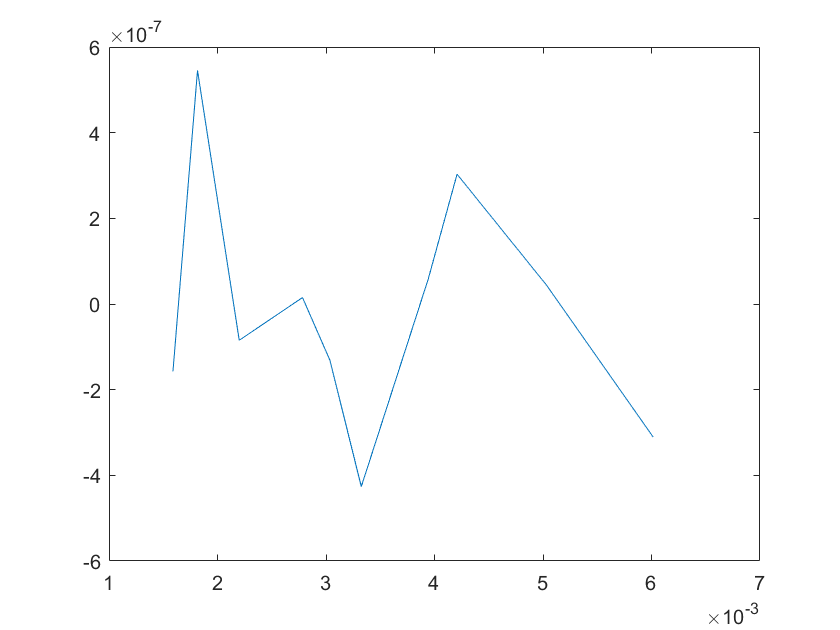
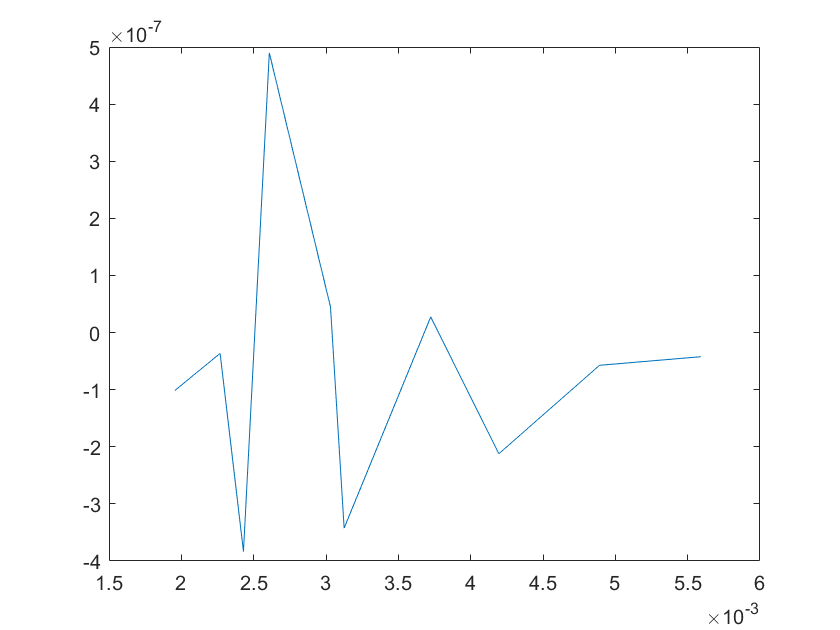
The sensitivity of each parameter is shown in the figures below.
The sensitivity of each parameter is shown in the figures below.
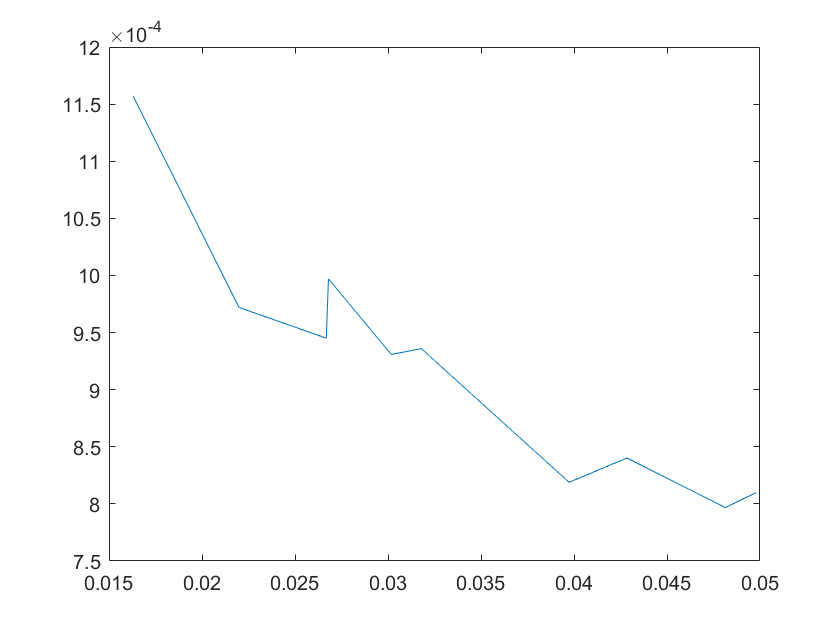
(a)sensitivity of ktx1 (b)sensitivity of ktl1
(c)sensitivity of ktx2(d)sensitivity of ktl2
(e)sensitivity of ktx3 (f)sensitivity of ktl3
(g)sensitivity of ktx4 (h)sensitivity of kb1
(i)sensitivity of kb2 (j)sensitivity of kb3

(a)sensitivity of kb4 (b)sensitivity of kb5
(c)sensitivity of kb6 (d)sensitivity of kd1
(e)sensitivity of kd2 (f)sensitivity of kd3
(g)sensitivity of kd4 (h)sensitivity of kd5
(a)sensitivity of kd6 (b)sensitivity of kd7
(c)sensitivity of kd8 (d)sensitivity of kd9
(e)sensitivity of kd10 (f)sensitivity of kd11
Note:The ordinate axis represents the sensitivity S,and the abscissa axis is the parameter k for which we want to evaluate
the sensitivity.
2.5 Application of the model
Since the goal of our project is to increase the sensitivity of biosensors by introducing a complex of dCas9-RNAP and
sgRNA, and one of the purposes of our model is to explore whether this complex is effective.So we assume a reasonable
and large enough concentration value for this complex. We use the concentration of Glyceraldehyde-3-phosphate dehydrogenase
A as the assumed concentration.Glyceraldehyde-3-phosphate dehydrogenase A(gapA) is a crucial enzyme in the glycolytic
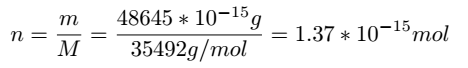
pathway,and the gene encoding this enzyme is a housekeeping gene in E.coli cells with high expression levels.We find
in the literature that the protein mass of gapA is 48645 fg/cell,and its molecular weight is 35492 Da.[4] The amount
of abundance of Glyceraldehyde-3-phosphate dehydrogenase A protein per cell can be calculated as follows:
As for the size of E.coli,we found relevant data from the literature,as the figure below shows.[5]
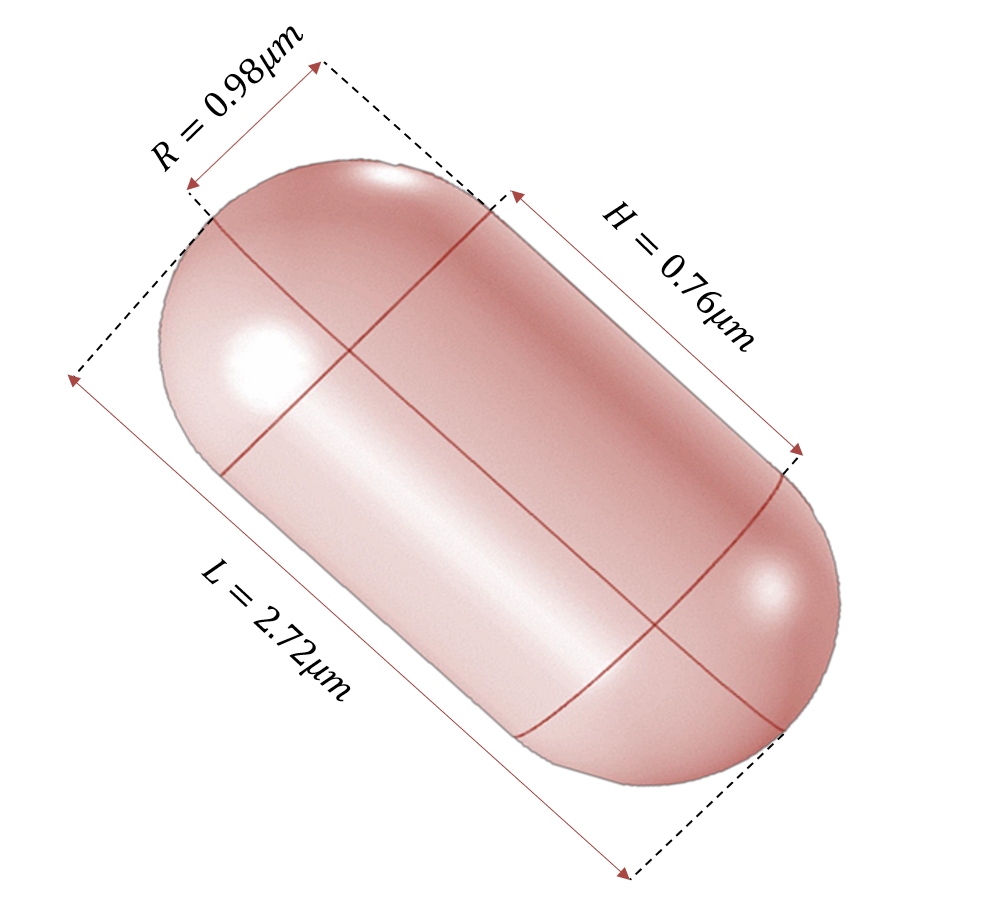
Figure 8.Size of E.coli
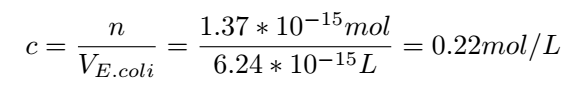
The volume of E.coli can be calculated as follows:

Then the concentration of Glyceraldehyde-3-phosphate dehydrogenase A protein in the cell can be determined:
With this concentration,we can get very nice results:
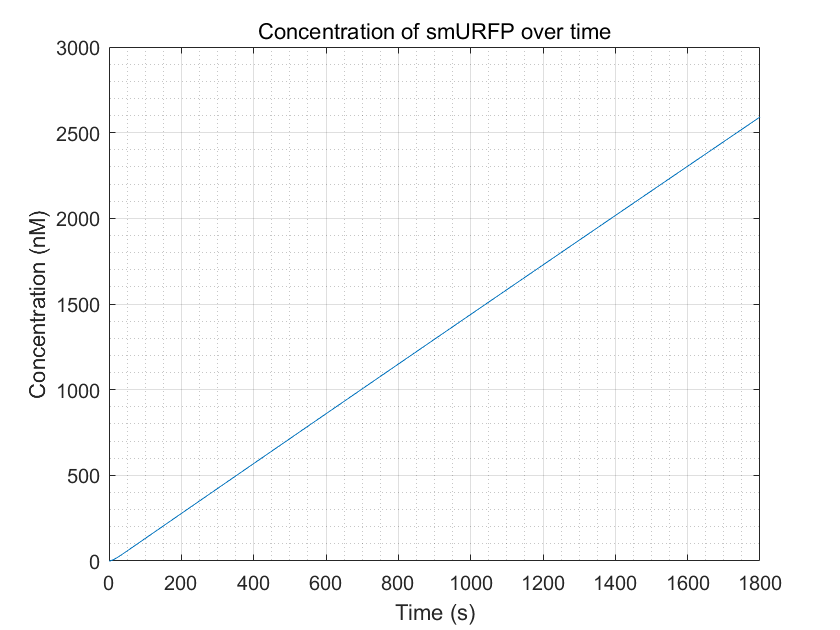
Figure 9.smURFP production with enough dCas9-RNAP:sgRNA
Compared to the diagram without introducing dCas9-RNAP:sgRNA:
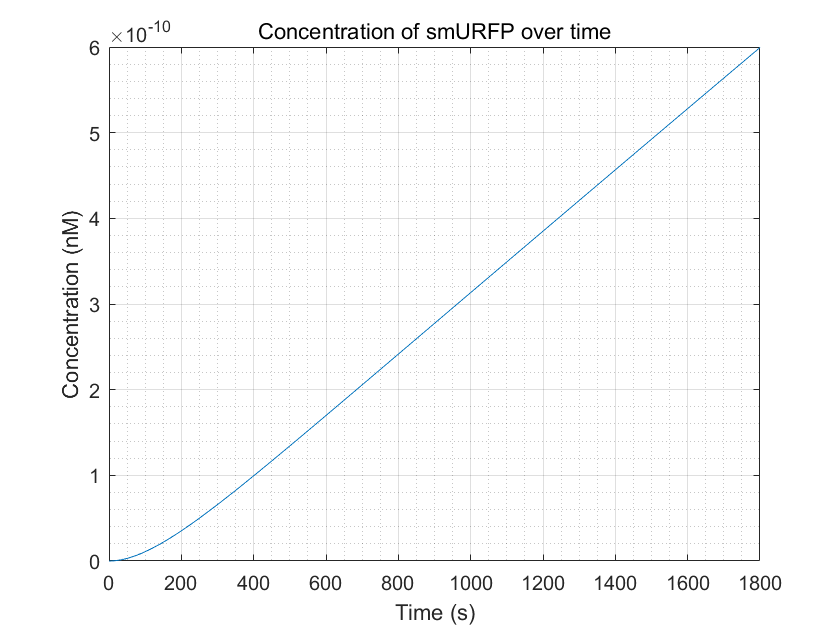
Figure 10.smURFP production within a reasonable time frame
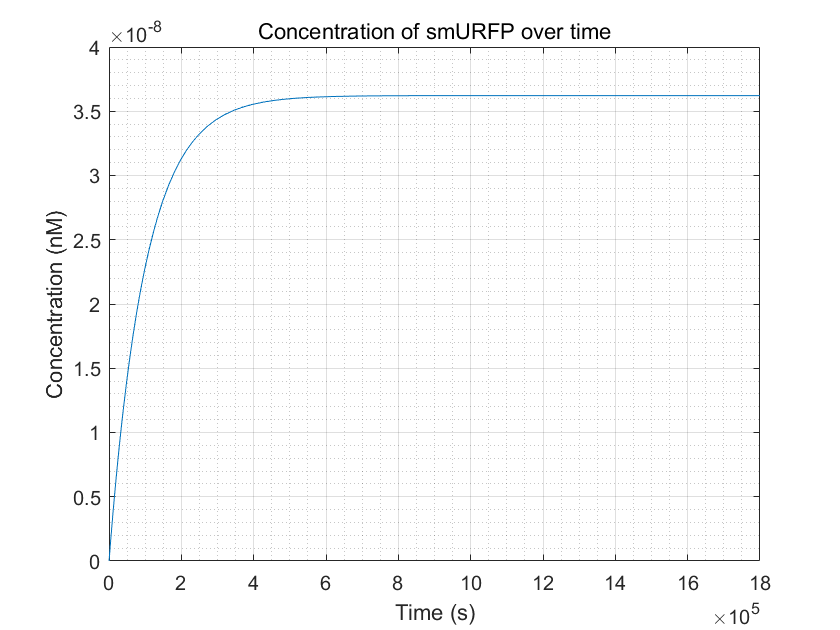
Figure 11.smURFP production reached equilibrium but it takes a long time
From these three figures, we can conclude that dCas9-RNAP:sgRNA does have the effect of promoting transcription and increasing
fluorescence intensity,thereby increasing sensitivity,as long as its concentration is sufficient.This result enhances
the confidence of the experimental group,and they need to try to improve the expression of dCas9-RNAP:sgRNA in E.coli
without having to doubt its role.
References
[1] LA Pola-Lopez et al."Novel arsenic biosensor "POLA" obtained by a genetically modified E.coli bioreporter cell" .In:Sensors
and Actuators B:Chemical254(2018),pp.1061-1068.
[2] Yves Berset et al."Mechanistic Modeling of Genetic Circults for ArsR Arsenic Regulation".In:ACS synthetic biology 6.5(2017),pp.862-874.
[3] Eyal Karzbrun et al."Coares-grained dynamics of protein synthesis in a cell-free system".In:Phtsical review letters 106.4(2011),p.048104.
[4] Yasushi Ishihama et al."Exponentially modified protein abundance index(emPAI) for estimation of absolute protein amount in proteomics by the number of sequenced peptides per protein".In:Molecular E Cellular Proteomics 4.9(2005),pp.1265-1272.
[5] Nili Crossman,Eliora Z Ron,and Conrad L Woldringh."Changes in cell dimensions during amino acid starvation of Escherichia coli."In:Journal of bacteriology 152.1(1982),pp.35-41.
Free Energy Model of Off-target Problem
1 Background
Nowadays,the analysis of cleavage possibility can be devided into two type,i,e.meta-empirical and empirical.For the first
one, people develop the various score function based on experiment data to evaluate if a sgDNA is good or bad.Correspondingly,the
other group chooce set up a theoretical model based on kinetic theory.But because using many approximations,it has
drawbacks inevitably.
Our model aims to investigate the off-target problem in gene editing by the CRISPR-Cas system,therefore finding efficient ways to enhance the reliability of gene editing.The foundations of thsi model are mostly simple probability theory and dynamic deduction,which make our model both convincing and pellucid.
Our model aims to investigate the off-target problem in gene editing by the CRISPR-Cas system,therefore finding efficient ways to enhance the reliability of gene editing.The foundations of thsi model are mostly simple probability theory and dynamic deduction,which make our model both convincing and pellucid.
2 Introduction
Currently,people have constructed a similar model as illustrated in the following figure1.There are four common rules when Cas nuclease cleaves the DNA[1].
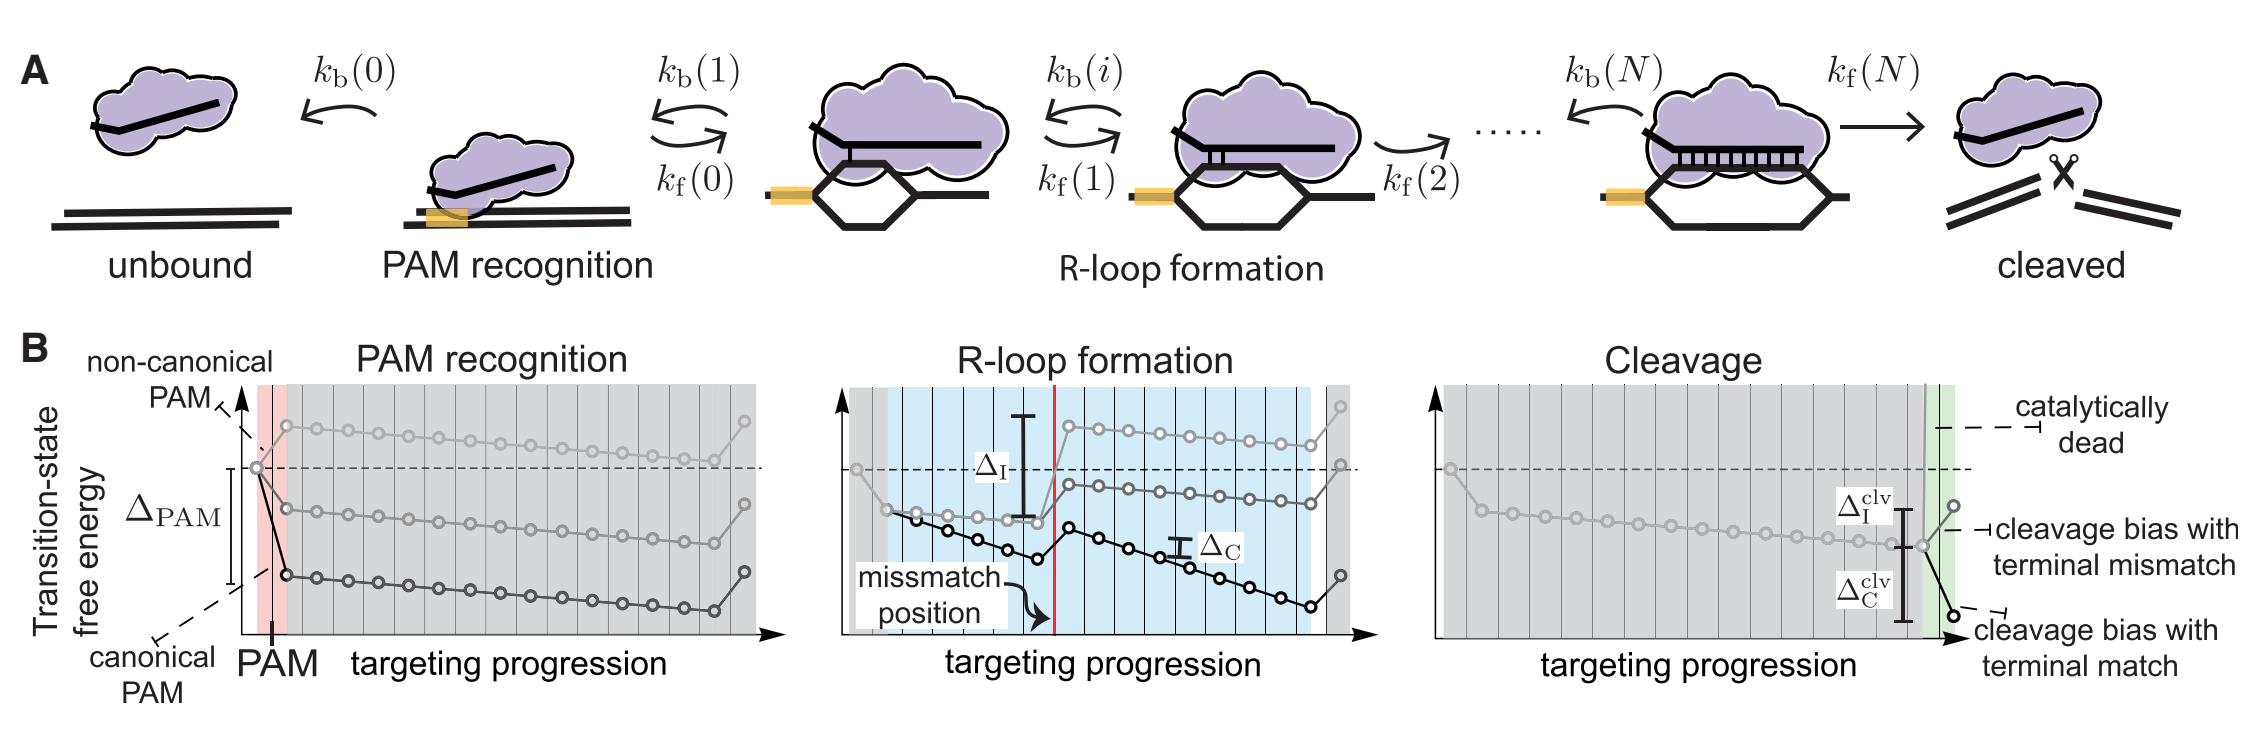
Figure 1.schematic diagram
(1)Seed region:single mismatch(es) within a PAM proximal seed region can completely disrupt interference.
(2)Mismatch spread:when mismatches are outside the seed region,off-targets with spread out mismatches are targeted most strongly.
(3)Differential binding versus differential cleavage:binding is more tolerant of mismatched than cleavage.
(4)Specificity-efficiency decoupling:weakened protein-DNA interatctions can improve target selectivity while still maintaining efficiency.
Based on these four rules,probability theory is applied in to explain it.As we know,there are always only two results in an experiment,which are successful cleavage and unsuccessful cleavage.In math view,it can be one-hot encoded,and they are corresponding to 1 and 0.
However,giving a 0/1 prediction is hard and unreliable.To solve this problem, one choice is to consider it as a cluster
problem;however,it is easier to find a continuous quantitative function rather than to find a suitable cluster distance
function.Sonaturally,finding an approximate probability distribution is a good choice.
In many target design toolkits,they use a score function with several param eters which can generate a score to evaluate whether the target is good or bad. Here we consider the score function has the similar ability to probability,which is a description of ”better” or ”worse” while can’t affirm whether successful cleavage willappear.For our case,our goal is to find a function indicating which target is BETTER.
Considering the difference between model prediction and experimental data,our model consists of two aspects,which are kinetic inference and an updating module.
3 Methods
3.1 Knietic module
Figure 2 shows that the whole binding-cleavage process begins with the bind ing between PAM andprotein.Therefore,it corresponds
to rule1 mentioned before.And as the reaction proceeds,every step of it is reversible,and its irre versibility mainly
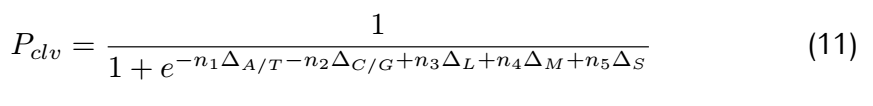
depends on the binding energy of two DNA bases. The boundary probability Pclv;N,representing the probability of matching
at the Nth position(the last position of sgRNA) of nucleotide base,is given by:
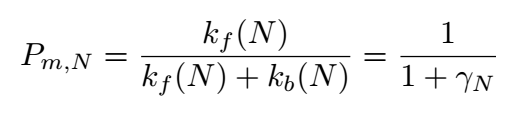
Where k is the reaction rate constant; f represents the forward reactions;b represents the backward reaction.And

So for a complete match:
Consider the rate constant $K_f(i)$ and #k_b(i)$:

where $F_i$ means free energy of each metastable state,$T_{i,i+1}$means the highest free energy point on the reaction
path from position i to position i+1.Therefore,$T_{i,i+1}$-$F_i$ is the activation energy of forward reaction and
$T_{i,i+1}$-$F_i$ is activation energy of the backward reaction.
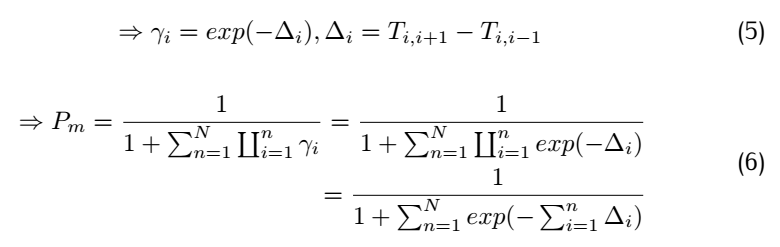
We define
So
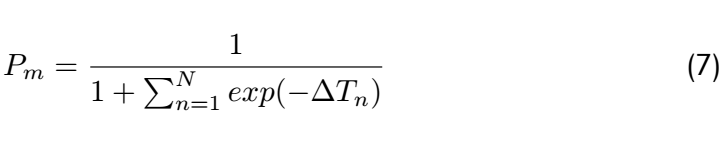
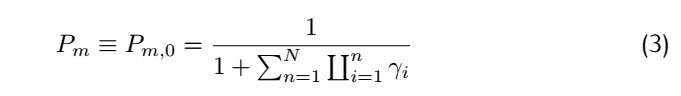
From the above,it is clear that the matching probability depends only on the state transition energy,not on the free
energy of the metastable states.If we assume there is one dominant minimal bias,say for n = n ∗ ,then this equation
can be approximated as:
To sum up,the cleavage possibility mainly relies on the free energy change, and PAM appears as a significant energy decline.
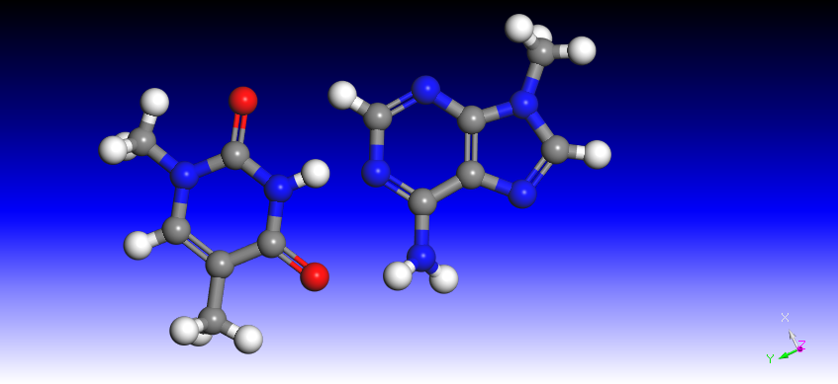
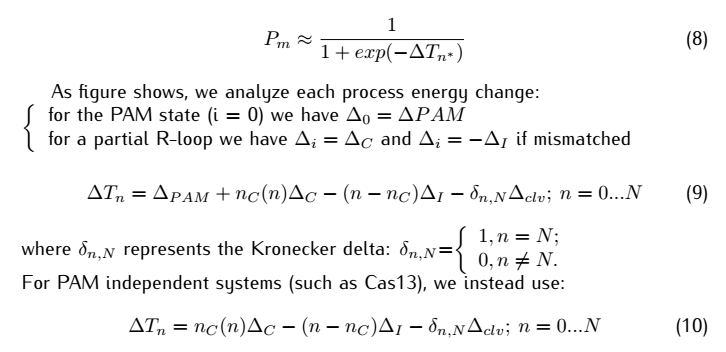
Figure 2.AT
Figure 3.CG
The kinetic model sets up a framework to build the relationship between bind ing probability and the numbers of nucleotide
matches and mismatches.In con sideration of this problem more carefully,the binding probability becomes equal to
the analysis of energy change,because we know the binding energy of A/T and C/G is different due to the different
hydrogen bonds between them(figure 2 and 3),and the energy decrease in C/G is approximately 1.5 folds as A/T.Sim
ilarly,the mismatch has more types of variance because the sizes of nucleotides are various.Hence,the types of the
mismatched base pair are classified b ygroup volume,i.e.,two pyrimidines(such as C/T,“Large”),pyrimidine and purine(such
as C/A,"Medium"),two purine(such as G/T,"Small").Hence,the probability can be calculated using the following equation:
3.2 Parameter Optimization
From the kinetic model,we can get an output,which is the binding probability.It needs to be noticed that the parameters
we choose should make results well discriminated,because in a cleavage experiment,we only have two outcomes,successful(1)
and unsuccessful(0).
To make our predictions from the model more approximate to experiment(facts),we set a regression module and implement parameter optimization.
Here,the method we choose is stochastic gradient descent(SGD) and cross entropy.And their principle can be concluded as follows.
To make our predictions from the model more approximate to experiment(facts),we set a regression module and implement parameter optimization.
Here,the method we choose is stochastic gradient descent(SGD) and cross entropy.And their principle can be concluded as follows.
where θ means the parameters array and J means the loss function. Considering the difference in gradient calculation,we
use difference to substi tute differential aim to accelerate operating speed.
By using this simple method,our model can be more vibrant,updating using newest data and becoming more reliable.
3.3 Generating sgRNA Candidates
Meanwhile,we designed a program to generate all the sgRNA candidates for a target gene,and combined with the previous
model,we can compare and rank all the candidates.The principle of the program is very simple.We use PAM as the input
and collect the arrays with a certain length which contain the same beginning code as PAM.
4 Results
Here,we set the parameters as default values and observe its performance.Our default parameters are set based on three
simple rule.Firstly,because of the different numbers of hydrogen bonds between A/T and C/G,the energy decrease due
to A/T binding are 1.5 times to C/G binding.So the parameter#1 is 1.5 times parameter#2.Secondly,it's universally
known that big compounds with small distance will have a high energy because of repulsion.The mismatching combination
between two nucleotides can be classified into three parts-large,medium and small,and we should set other parameters
in the same order of values.Thirdly,we use the parameters from[1] as reference.In total,we set the parameters default
values as[0.06,0.09,0.3,0.6,0.03].
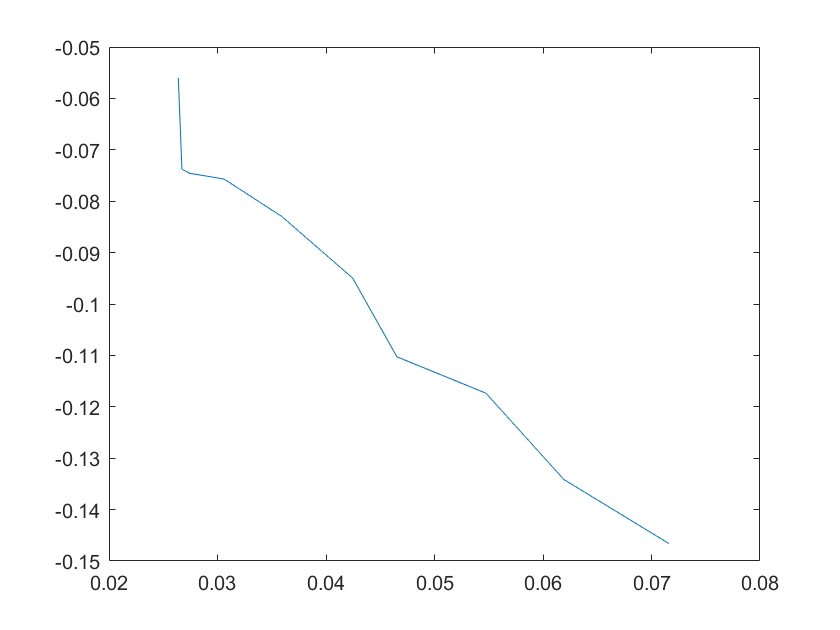
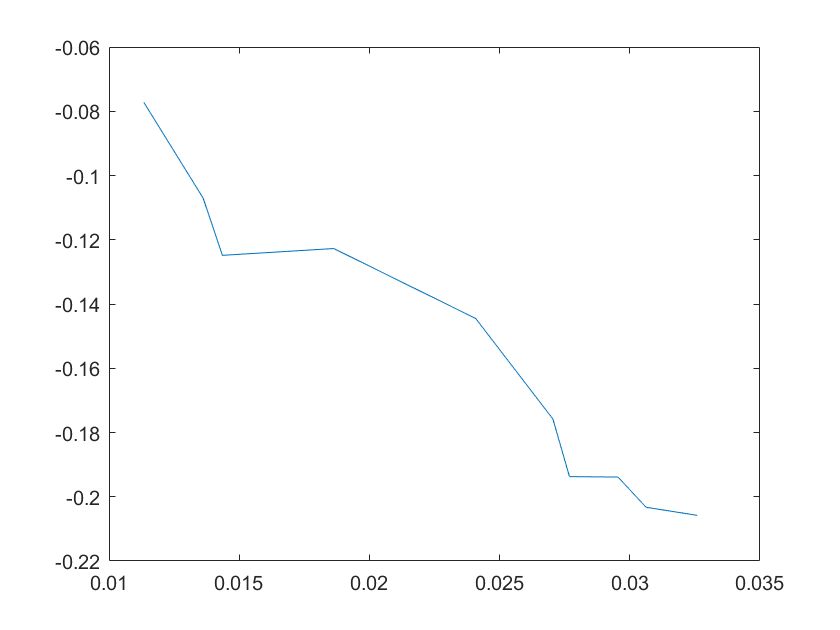
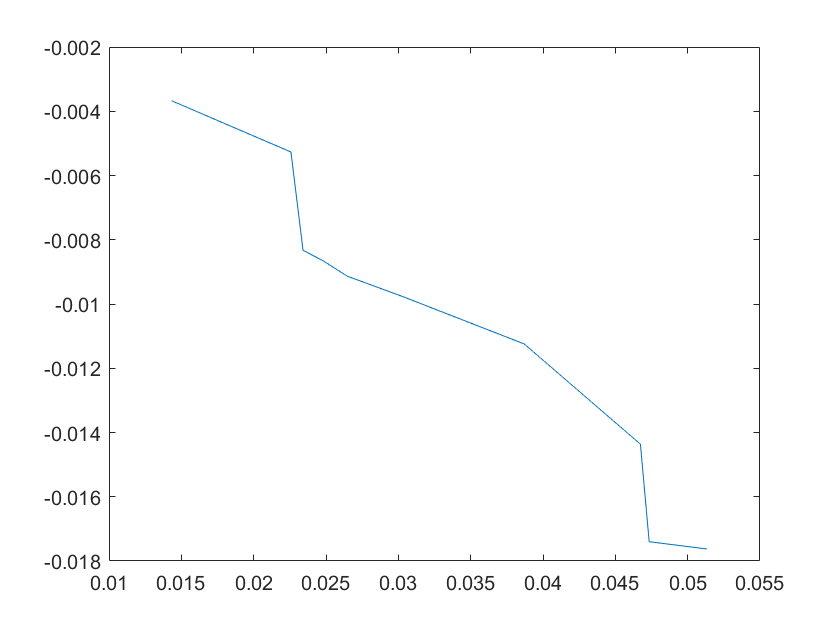
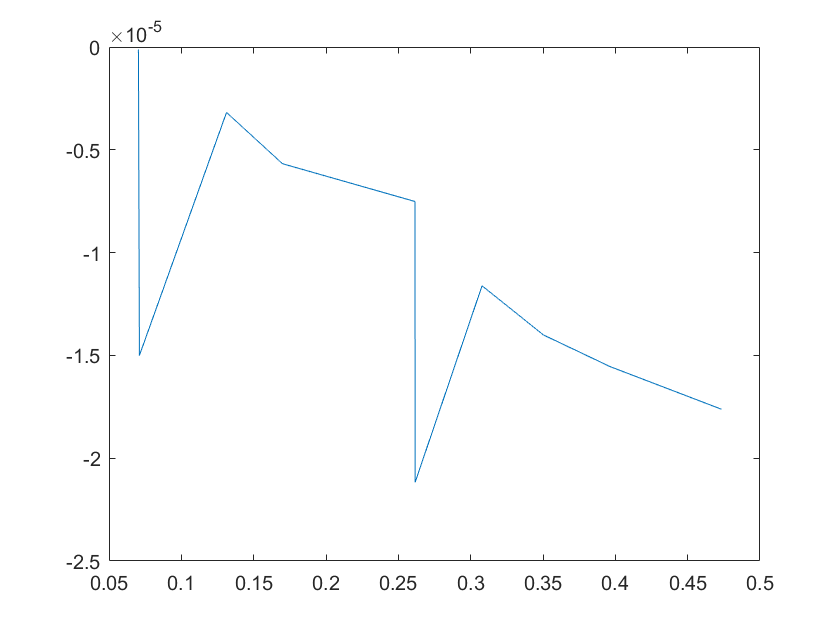
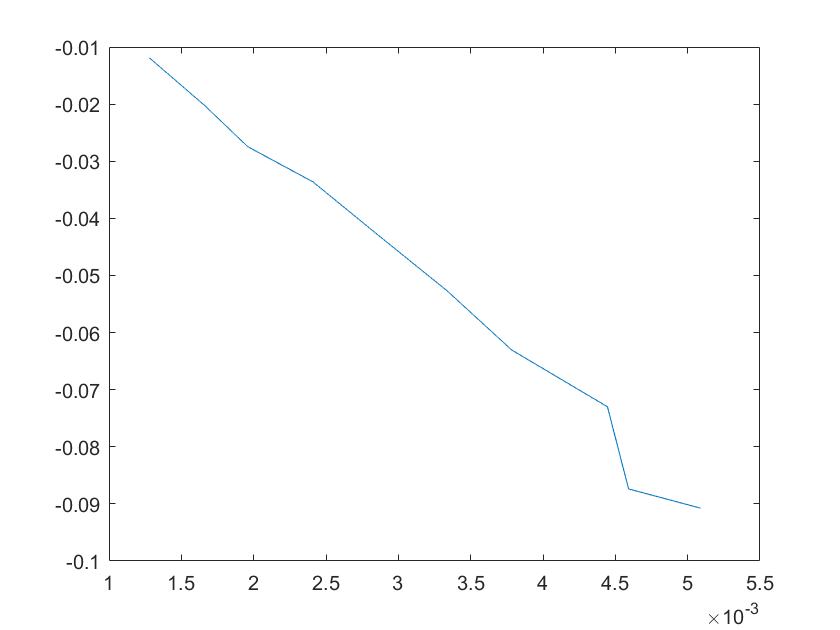
As the following figure shows,the energy always decreases or has some turning point because of mismatch and is always nagative.The yellow line represents complete match.The blue line and the red line are two examples of mismatched at different positions.For example,the red line has a peak due to a mismatch, and in our model,we find that it doesn’t make the energy positive.That means that in this reaction process there is some force like ”momentum” pushing it to proceed and cross the energy peak.For a off-target examination to every location of all the DNA in a system(a genome),there will also be positive energy result,which is obviously not a feasible solution(will not lead to off-target).This kind of results is omitted in the plot.
As the following figure shows,the energy always decreases or has some turning point because of mismatch and is always nagative.The yellow line represents complete match.The blue line and the red line are two examples of mismatched at different positions.For example,the red line has a peak due to a mismatch, and in our model,we find that it doesn’t make the energy positive.That means that in this reaction process there is some force like ”momentum” pushing it to proceed and cross the energy peak.For a off-target examination to every location of all the DNA in a system(a genome),there will also be positive energy result,which is obviously not a feasible solution(will not lead to off-target).This kind of results is omitted in the plot.
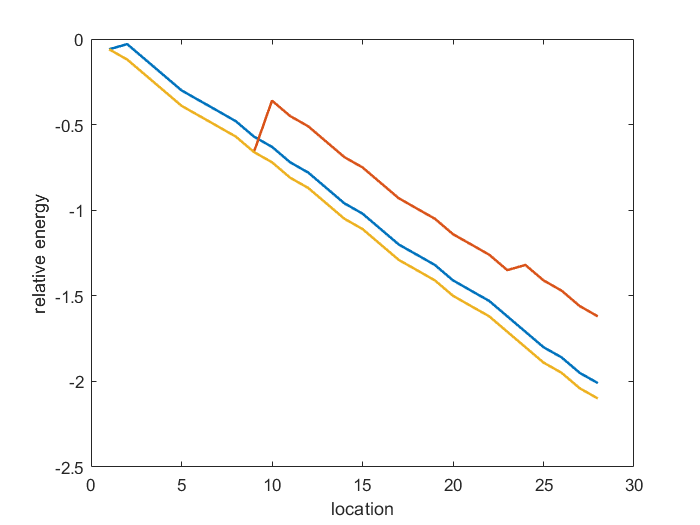
Figure 4.Energy change of sgRNA candidates binding to DNA
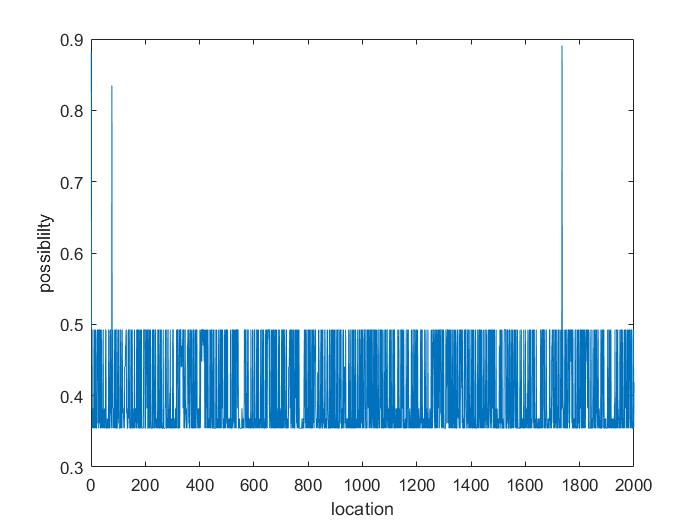
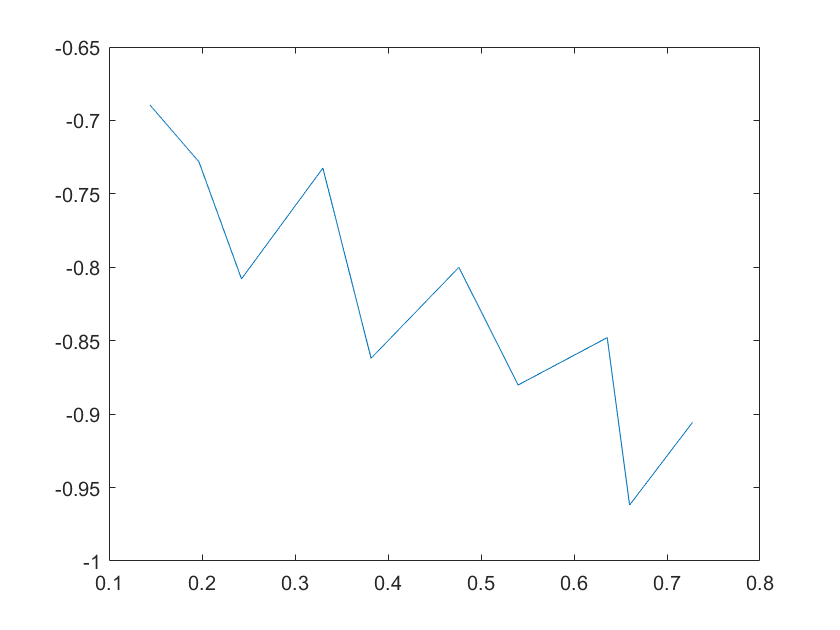
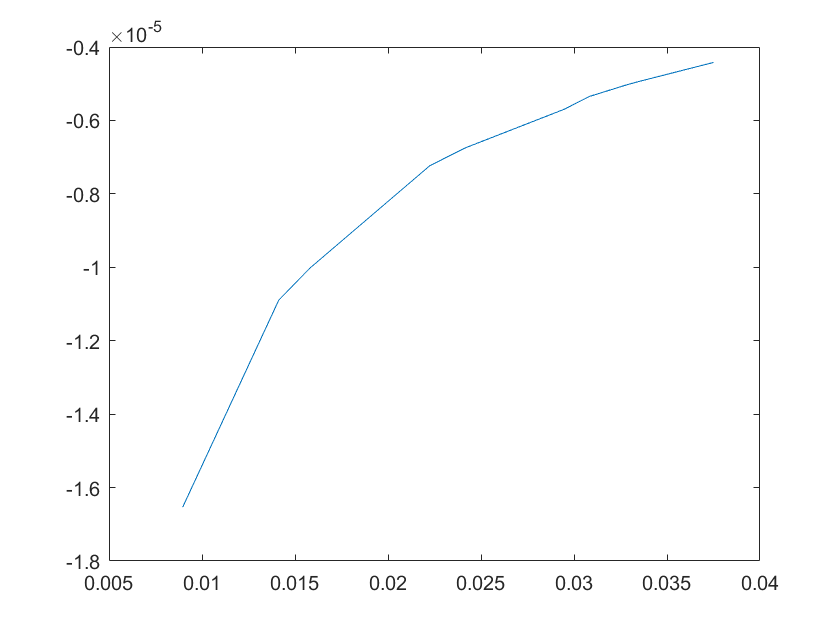
Figure 5. The possibility of sgRNA candidates binding to DNA's different locations
After testing our code’s running time,we find its rate can reach approximately $2*10^8$ base/h(under parallel computing
in 4cores).
Besides the default parameters,we hope our model can hit more true data.So after we get the experiment data,we can use the parameter optimization method mentioned before to get more precise parameters. 2×10⁸base/h(underparallelcomputingin4cores). Besidesthedefaultparameters,wehopeourmodelcanhitmoretruedata.So afterwegettheexperimentdata,wecanusetheparameteroptimizationmethod
Besides the default parameters,we hope our model can hit more true data.So after we get the experiment data,we can use the parameter optimization method mentioned before to get more precise parameters. 2×10⁸base/h(underparallelcomputingin4cores). Besidesthedefaultparameters,wehopeourmodelcanhitmoretruedata.So afterwegettheexperimentdata,wecanusetheparameteroptimizationmethod
References
[1] family=Klein,familyi=K.,given=Misha,giveni=M.,"Hybridization kinet ics explains CRISPR-Cas off-targeting rules".In:Cell
reports 22.6(2018),pp.1413-1423.
Code
The codes for our dynamic model and off-target model are available at https://github.com/sherrybao222/TJU_China-iGEM-2018.
For the dynamic model, they include the MATLAB files used to generate our results.
The "whole model" file is a simulation of the heavy metal detection biosensor's pathways.
The "without CRISPR" file is a simulation of the biosensor without dCas9-RNAP and sgRNA plasmids.
By comparing the "whole model" with the "without CRISPR" output, the significant role of dCas9-RNAP in the biosensor can be determined.
The sensitivity file is a sensitivity analysis of the parameters involved in the whole model.
The assumed concentration file is a simulation of the biosensor in the case of a hypothetical concentration of dCas9-RNAP.
For the off-target model, they include the MATLAB files used to build our model and implement parameter optimization.
diff0: distinguish five kinds of base pairs and collect the information;
count1: record the numbers of five types of nucleotides combinations;
possible: for this function, its input is the target gene and the genome, and its output is a score which means the possibility of binding;
loss_function: used for calculating loss function;
training: used to optimize the parameter based on experimental data.