Contents
Applications
Applications of PLA and its Co-polymers PLGA and PLGC
Polylactic acid (PLA) is derived from renewable sources and functions as a well‑suited biopolymer for wrapping material [1] because of its good degradability. After usage, it will degrade into non-toxic particles that cannot pollute the environment with microplastic. Since it is also digestible, it will not harm any animals if they consume the plastic by accident. Delicate Pharmasuitical agents like RNA, can be protected from biological degradation processes e.g. endolysozymes, antisense oligonucleotides or ribozymes, by encapsulating the agent in nanospheres. The polymer matrix protects the agent by posing a physical barrier and therefore improve the stability of the drug, over long periods of time [2].
Another application for PLA and its co-polymers PLGA and PLGC is the production of surgical supplies. These are used inside the body and stay there for a set timeframe, for example screws for bone surgery or threads for sealing wounds [3]. Those screws and threads do not have to be removed, because they will be metabolized into non-toxic compounds or are excreted by the body.
For a demonstration of our project results, we focused on a third application: The use of PLGA and PLGC as drug delivery systems. For that, the polymers are turned into nanospheres loaded with therapeutics. These nanospheres can be injected. During degradation, the nanospheres release the therapeutics while being broken down into non-toxic monomers, which are then metabolized and excreted by the body, causing no further harm.
Nanospheres
Abstract
The usage of nanospheres in medicine continues to gain attention due to its advantages in the function as a drug delivery. The spheres can be loaded with different agents, such as fluorescence markers or drugs (e.g. chemotherapeutics). Once in the human body, the spheres slowly degrade and release a certain amount of drugs over time. Therefore, fewer injections per treatment are needed, which is more convenient for patients compared to conventional methods.
Not all polymers are suitable for such applications. It is vital, that the polymer for the production of nanospheres has a specific set of features. First, it needs to be biodegradable in the intended environment (e.g. the human body), and second, both the polymer itself and its monomers have to be non-toxic. PLGA and PLGC break down into the monomers lactic acid, glycolic acid and caprolactones. Both lactid acid and glycolic acid are endogenous in the human metabolism, and caprolactones are harmless for humans in small doses. Therefore, the human body can consume or excrete the monomers easily, when the spheres degrade slowly.
Moreover, PLGA is approved by the Food and Drug Administration (FDA), generally recognized as safe (GRAS) and different products of PLGA for clinical usage are already available on the market. Additionally, the polymers poly‑ε‑caprolactone (PCL), poly‑lactic acid (PLA) and poly‑glycolic acid (PGA) were approved by the FDA as well[4].
We included the synthesis of nanospheres into our project to show that our polymers have great potential and can even be used for applications such as drug‑delivery systems[5].
Synthesis Background
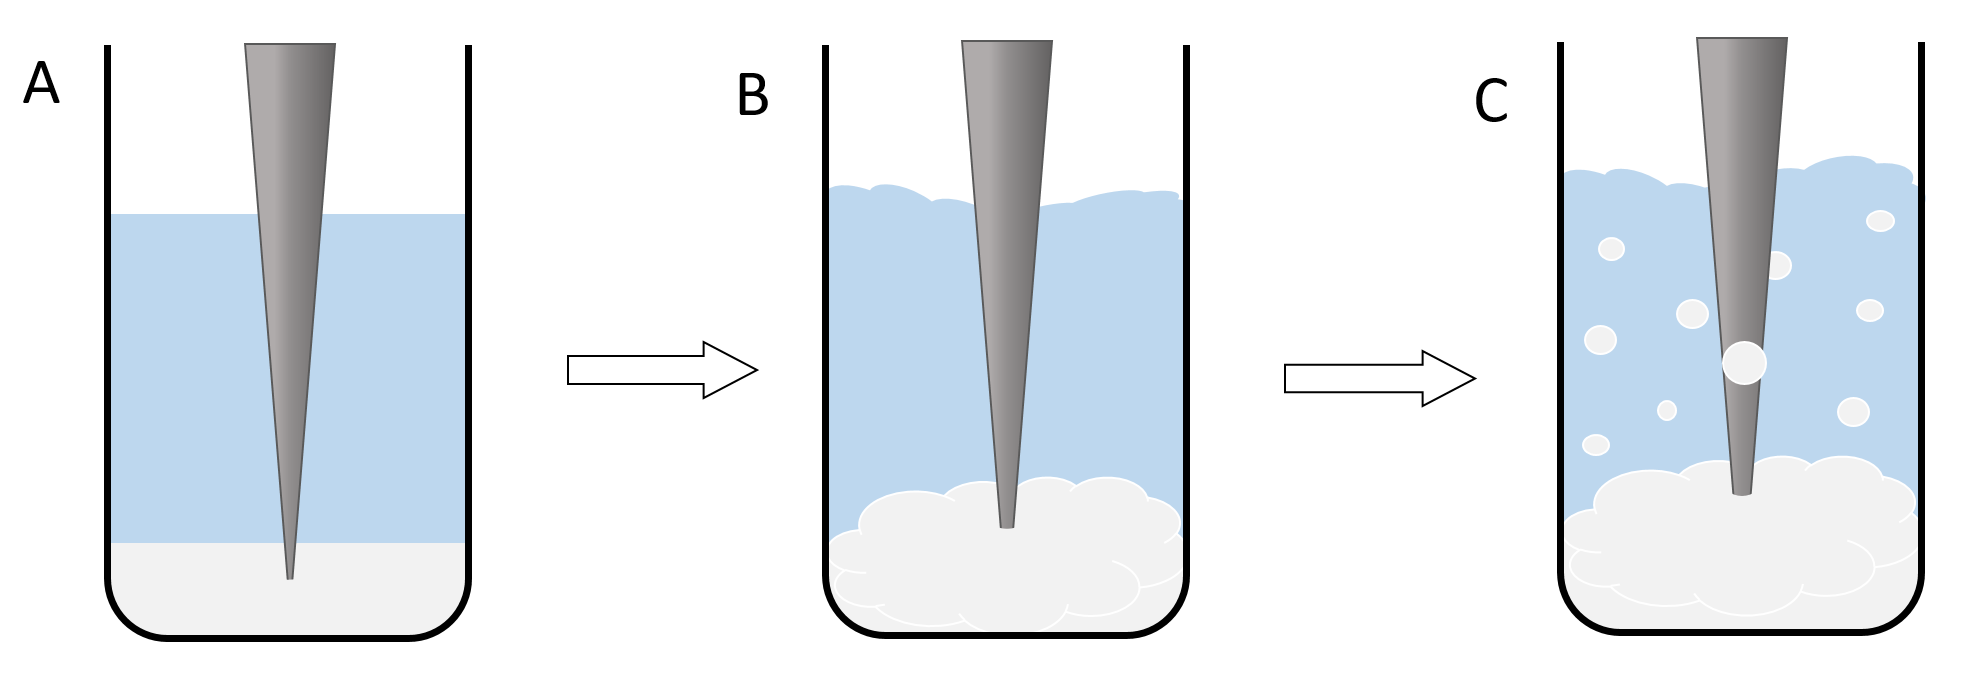
Nanoparticles are synthesized using a bulk polymer. The synthesis does not involve any chemical reactions, only phase transitions and the self‑assembly process of the polymer to form nanospheres. Two immiscible solutions have to be prepared to generate a system with two phases. The first phase is a solution of the polymer (PLGA or PLGC) in Dichloromethane (DCM). The second phase is a solution of low amounts of an emulsifying agent like Poly‑vinyl‑alcohol (PVA) in water. When the ultrasonic rod is turned on, the phases are mixed thoroughly. Due to the presence of the emulsifying agent, little DCM/polymer spheres form in the water phase turning the two‑phase system into an emulsion. The size of the dispersed spheres is dependent on the amount and type of the emulsifying agent and also the intensity of the ultrasonic waves (Figure 1)[6].
Figure 1: illustration of the nanoparticle synthesis. The lowest phase (here white‑grey) shows the polymer/DCM Phase and the central phase (here blue) resembles the PVA/water solution. The grey triangle is an illustration of the ultrasonic rod. A shows the basic setup of the reaction, where the two phases are still completely separated and the ultrasonic rod is still inactive. B shows the second phase of the reaction where the rod is turned on and the two phases begin to mix. C illustrates the formation of an emulsion and therefor the formation of the dichlromethane spheres.
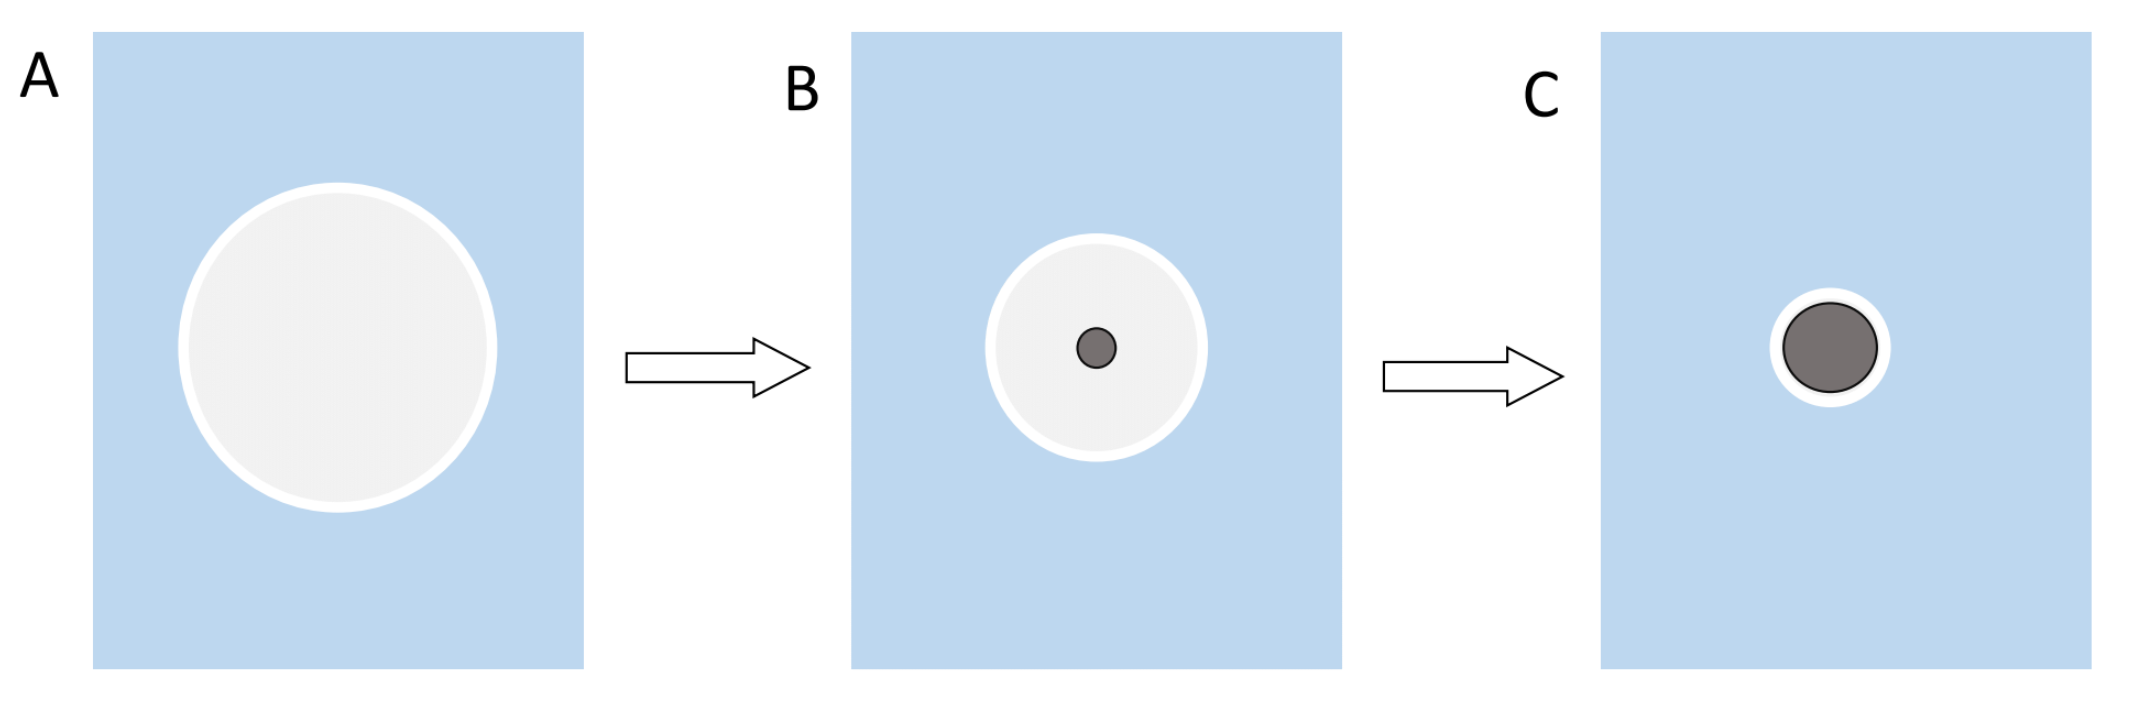
The ultrasonication not only forms an emulsion, but it also creates heat which causes the DCM to evaporate during the synthesis. The evaporation of the solvent then in turn leads to precipitation and formation of the particles. Reason for the precipitation is that the solubility of the polymer decreases as the volume of solvent decreases (Figure 2)[6].
Figure 2: Illustration of the precipitation of the polymer and the formation of nanoparticles. A shows the early DCM sphere as an emulsion and a big enough volume for the polymer to be completely in solution. B the volume of the sphere decreases over time until the concentration of the polymer reaches a critical value and it is forced to precipitate out of the solution. C this process continues until the particle reaches its final size.
Structure of the Particles
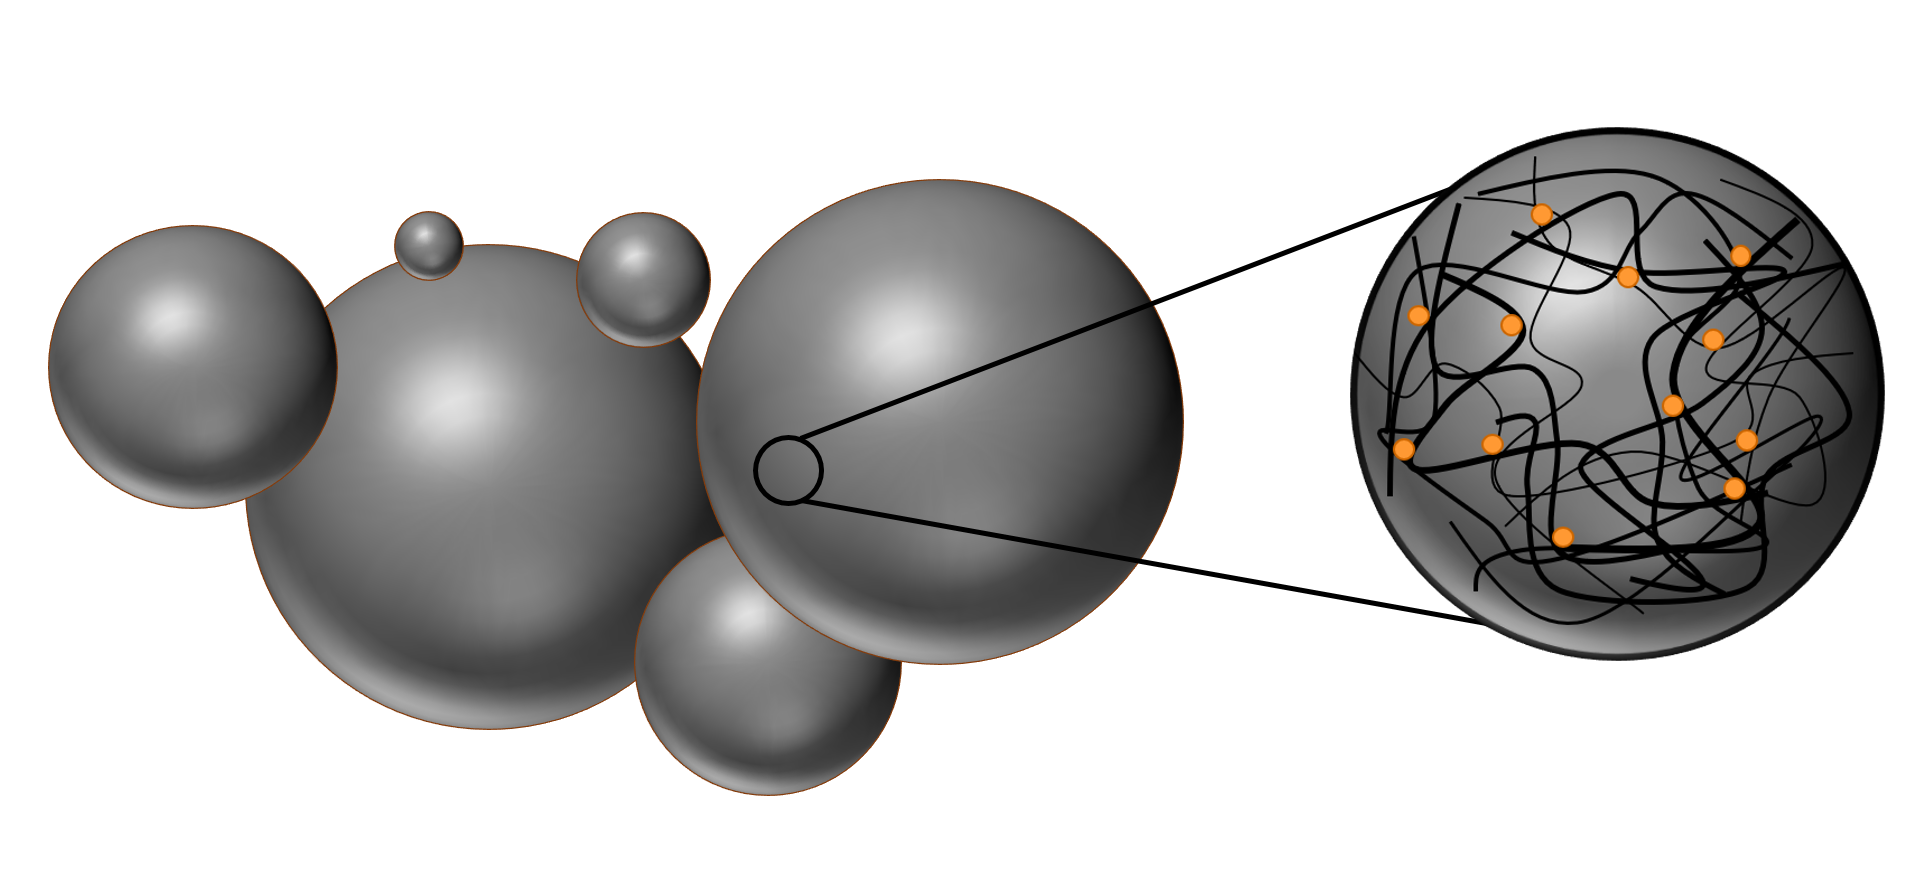
The nanospheres are randomly oriented coils of polymer strings which are held together by intramolecular forces, like Van‑der‑Waals-forces and dipole‑dipole‑interactions. The polymer matrix greatly influences the properties of the particles. Additionally, the porous structure eases the diffusion of water inside the matrix and this in turn speeds up the hydrolyzation process of the chemical bonds [PLGA]. Both hydrolyzation and porous structure are especially important for the application in drug delivery.
Encapsulation of Molecules
The polymer matrix can enclose molecules like fluorescent dyes or therapeutics like drugs or even proteins. This is exemplary done by simply dissolving the dye molecules together with the polymer in the organic solvent. The synthesis is analogous to the regular nanosphere synthesis, but with a difference in the self‑assembly process. Now, not only the polymer precipitates out of the solvent, but the molecules of the dye are attached to the polymer due to hydrophobic interactions between the polymer and the dye.
Figure 3: Illustration of the porous polymer matrix, which is loaded with dye molecules.
Results
During our project, both PLGA and PLGC nanospheres were successfully synthesized via solvent evaporation technique, according to the protocol described in the method section. The PLGA spheres differ in their lactide/glycolide ratios. Additionally, the samples were treated with an ultrasonic needle for 3, 4 or 5 minutes resulting in a size difference of corresponding spheres.
Light Microscopy and Dynamic Light Scattering (DLS)
All nanospheres were analyzed using a light microscope as well as dynamic light scattering technique (DLS). Mixtures containing only water, polyvinyl alcohol (PVA), and dichloromethane (DMC) served as negative controls.
Our first DLS measurements resulted in graphs of insufficient quality. Each one of the three determinations per measurement showed different peaks. Analysis via light microscopy showed various particles in different shapes and sizes. Many of them could be observed in both samples and negative controls. It was assumed that external particles contaminated the synthesis of our spheres and disturbed the DLS measurements.
Due to these observations, we changed our nanosphere synthesis. To remove any residual PVA crystals and other contamination such as dust particles, all solutions for the syntheses were filtrated. Additionally, all snap-on cap bottles were cleaned twice before using them.
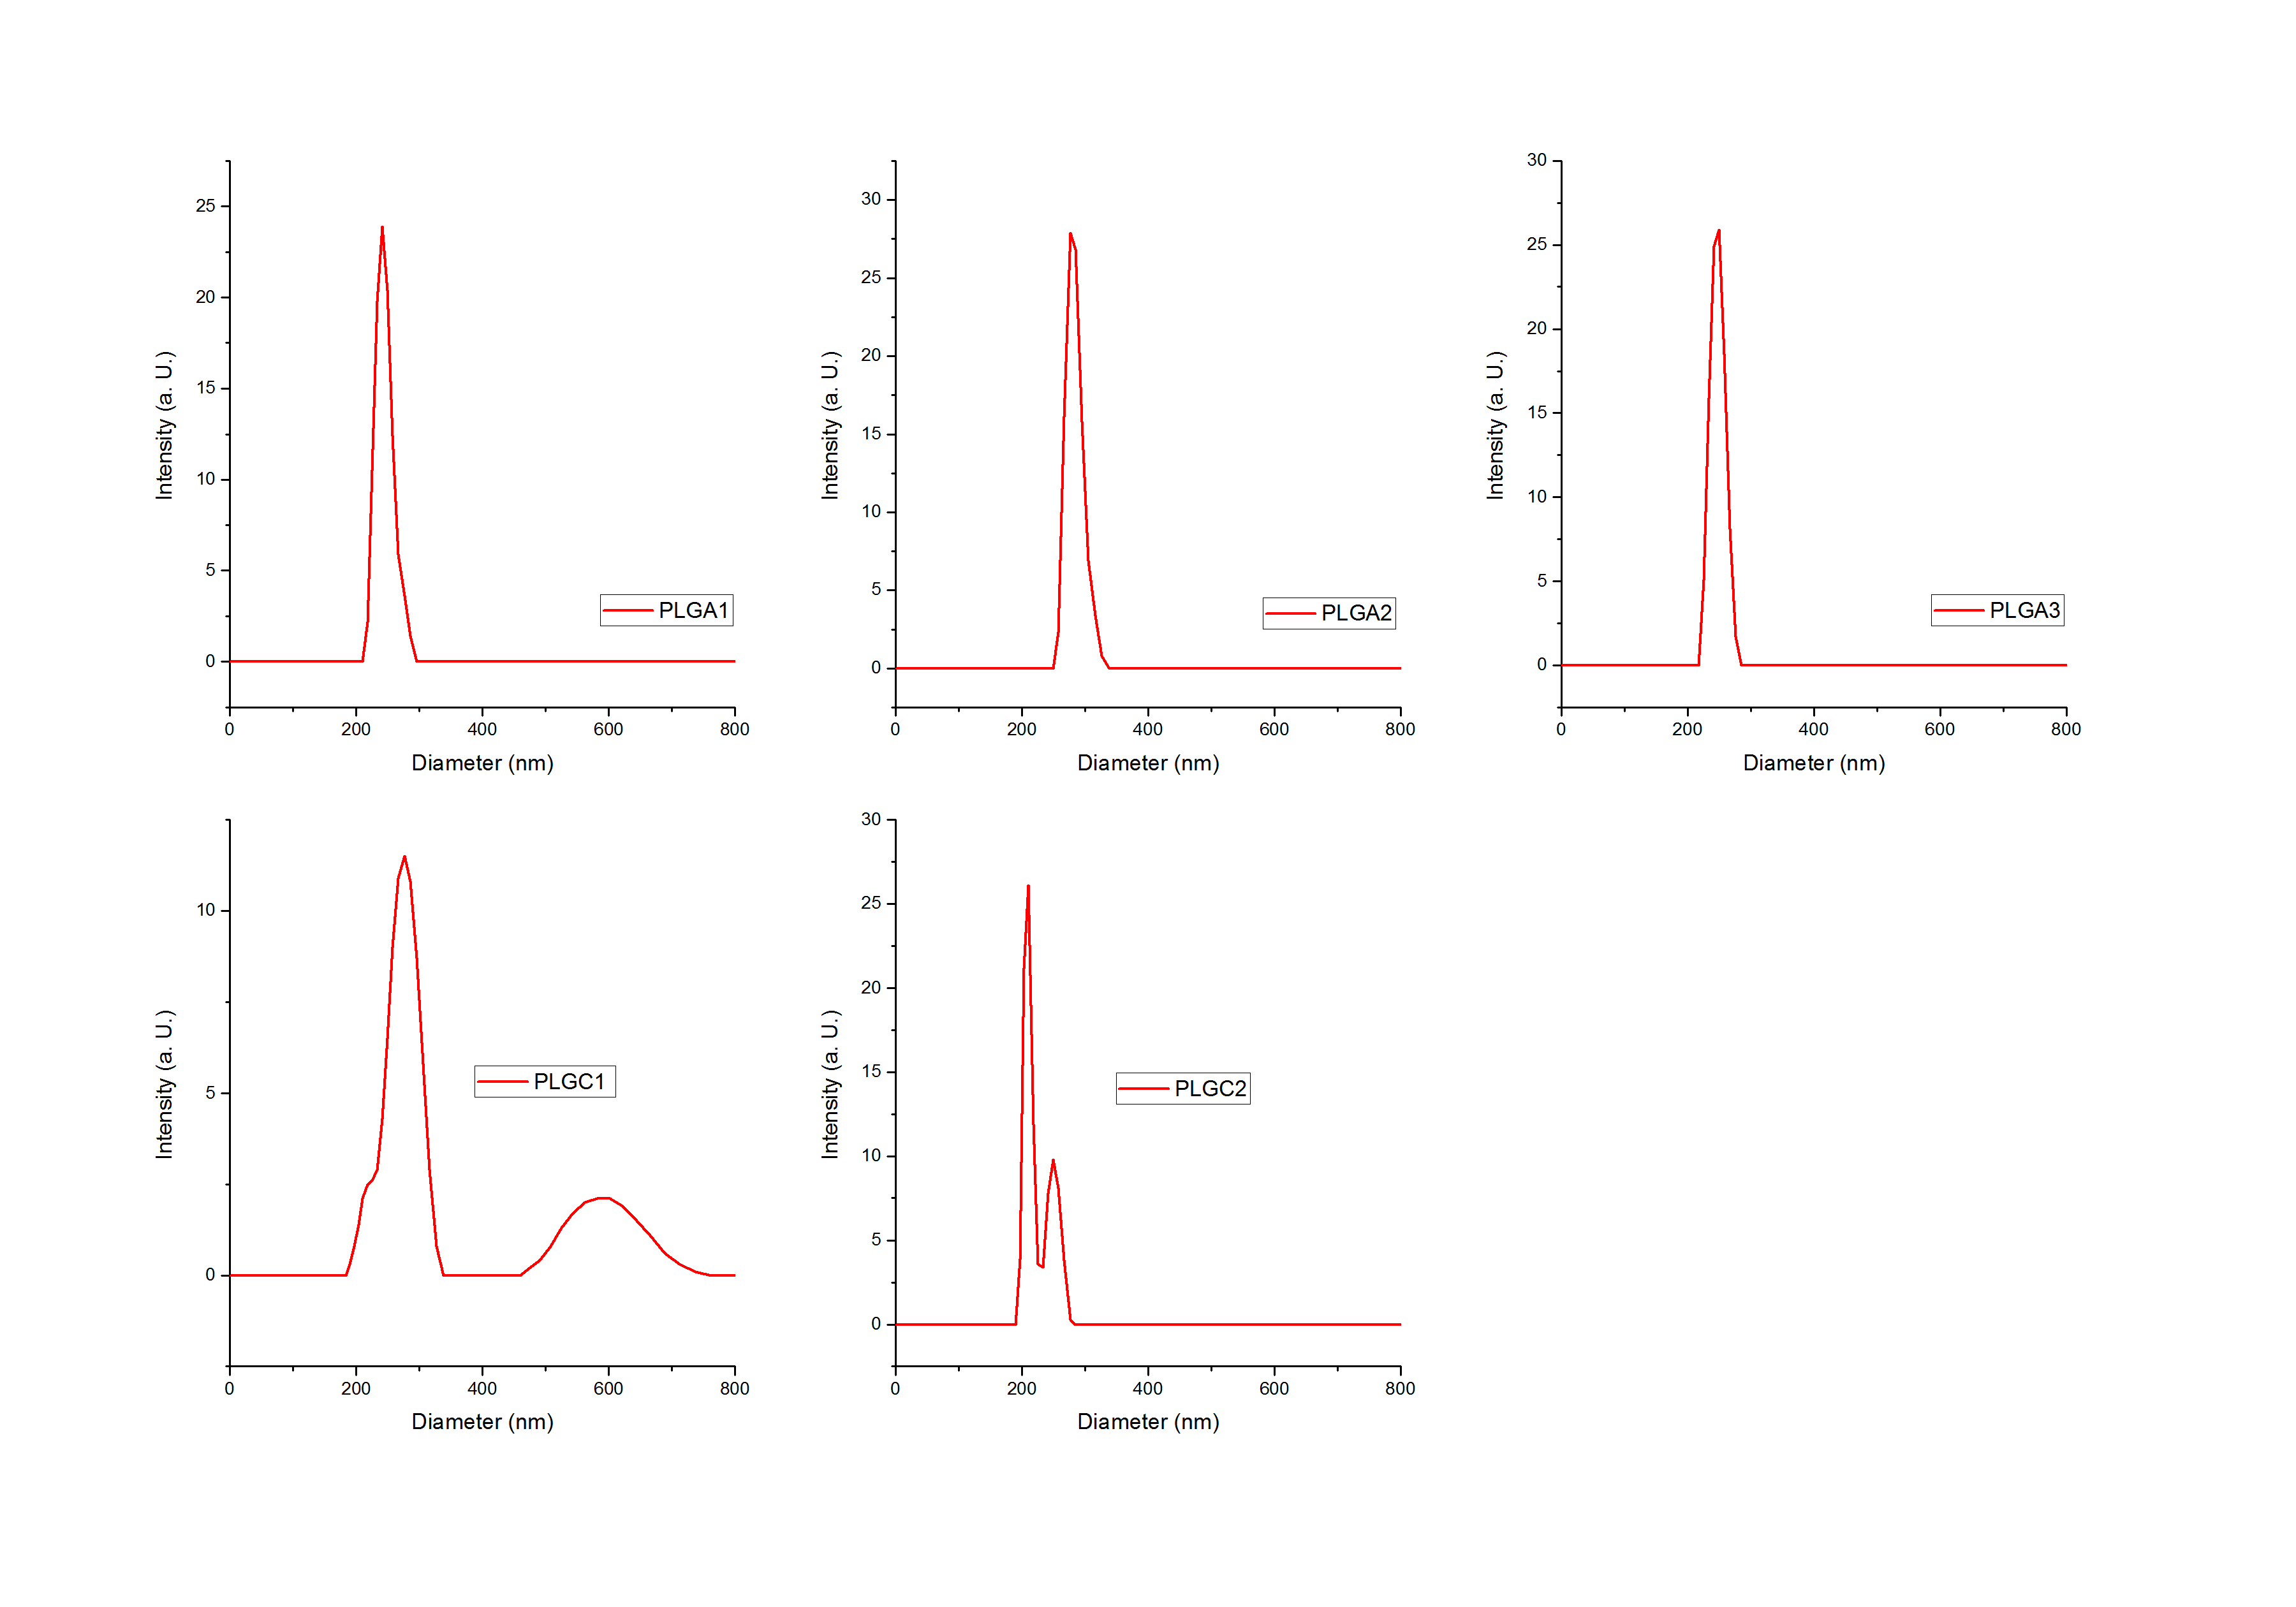
Our expectations were confirmed by new DLS measurements. Further results showed clear peaks and lower standard deviations. The following graphs show selected DLS measurements of both PLGA and PLGC spheres. Triple measurements were averaged and are presented in one graph only (see figure 4). The light intensity is plotted on the y-axis against the spheres’ size.
Figure 4: Dynamic Light Scattering (DLS) results of samples: PLGA (1), PLGA (I2), PLGA (3), PLGC (1) and PLGC (2). Light Intensity plotted against the size of the spheres (diameter) in nm.
It is clearly visible that all peaks, especially the ones of PLGA spheres, show a small width on the x-axis. For PLGA spheres, the maximal width in figure 4 is 100 nm, this distance is even smaller for the other two graphs. Therefore, the way we produce our spheres is reproducible.
For PLGC spheres, a smaller peak led to the assumption that a second species of larger particles was present in the solution. This might have been a contamination or the PLGC spheres might be polydisperse. Nevertheless, these peaks are relatively small compared to the larger peaks in the range between 200 and 400 nm.
Confocal Microscopy
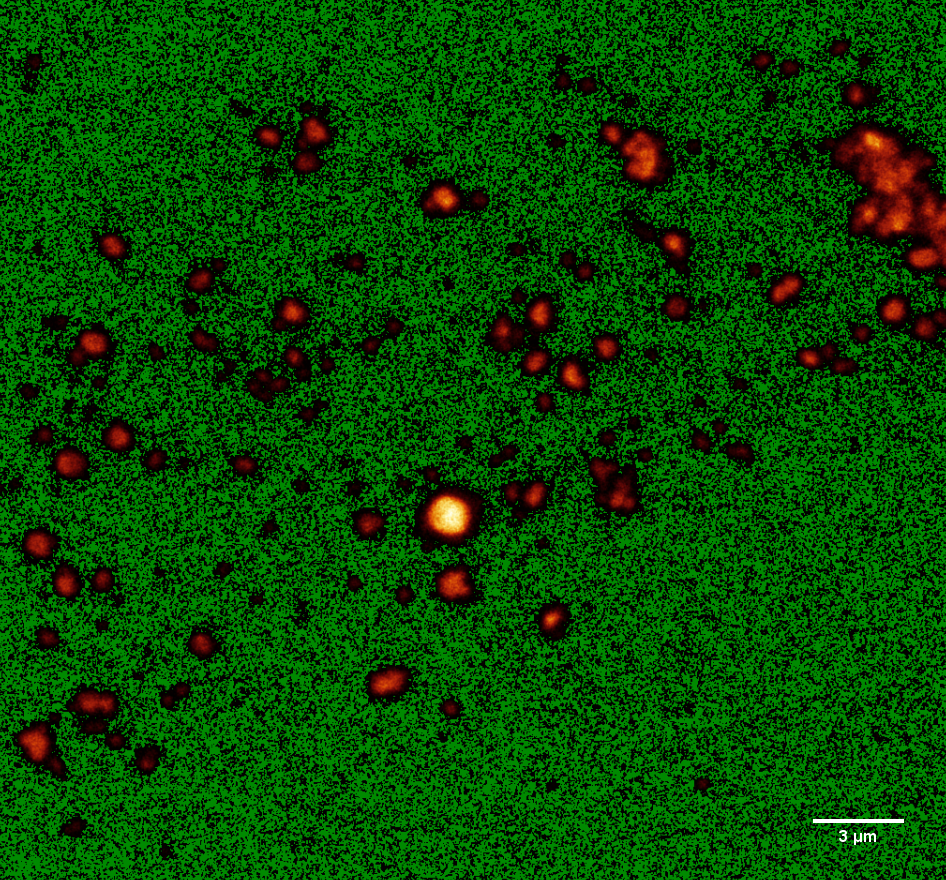
Due to the very small size of our spheres, observation with a light microscope was not sufficient. For a better analysis, confocal microscopy was applied (see Figure 5). For this purpose, fluorescent PLGA and PLGC spheres containing various concentrations of fluorescein (3, 5 or 7.5 % (w/w)) were manufactured (for further details visit method section).
The fluorescin loaded particles were analyzed via confocal microscopy and their sizes were determined using Fiji[7] and a special algorithm. Fiji was used to increase the contrast of the image so that the difference between single particles and accumulated particles becomes apparent (Figure 5).
Figure 5: Confocal microscope image of fluorescein loaded nanospheres optimized via Fiji.
The intensities of the fluorescent signals were also measured using Fiji and plotted against the horizontal distance. The plots were analyzed using the Adrian's FWHM algorithm.
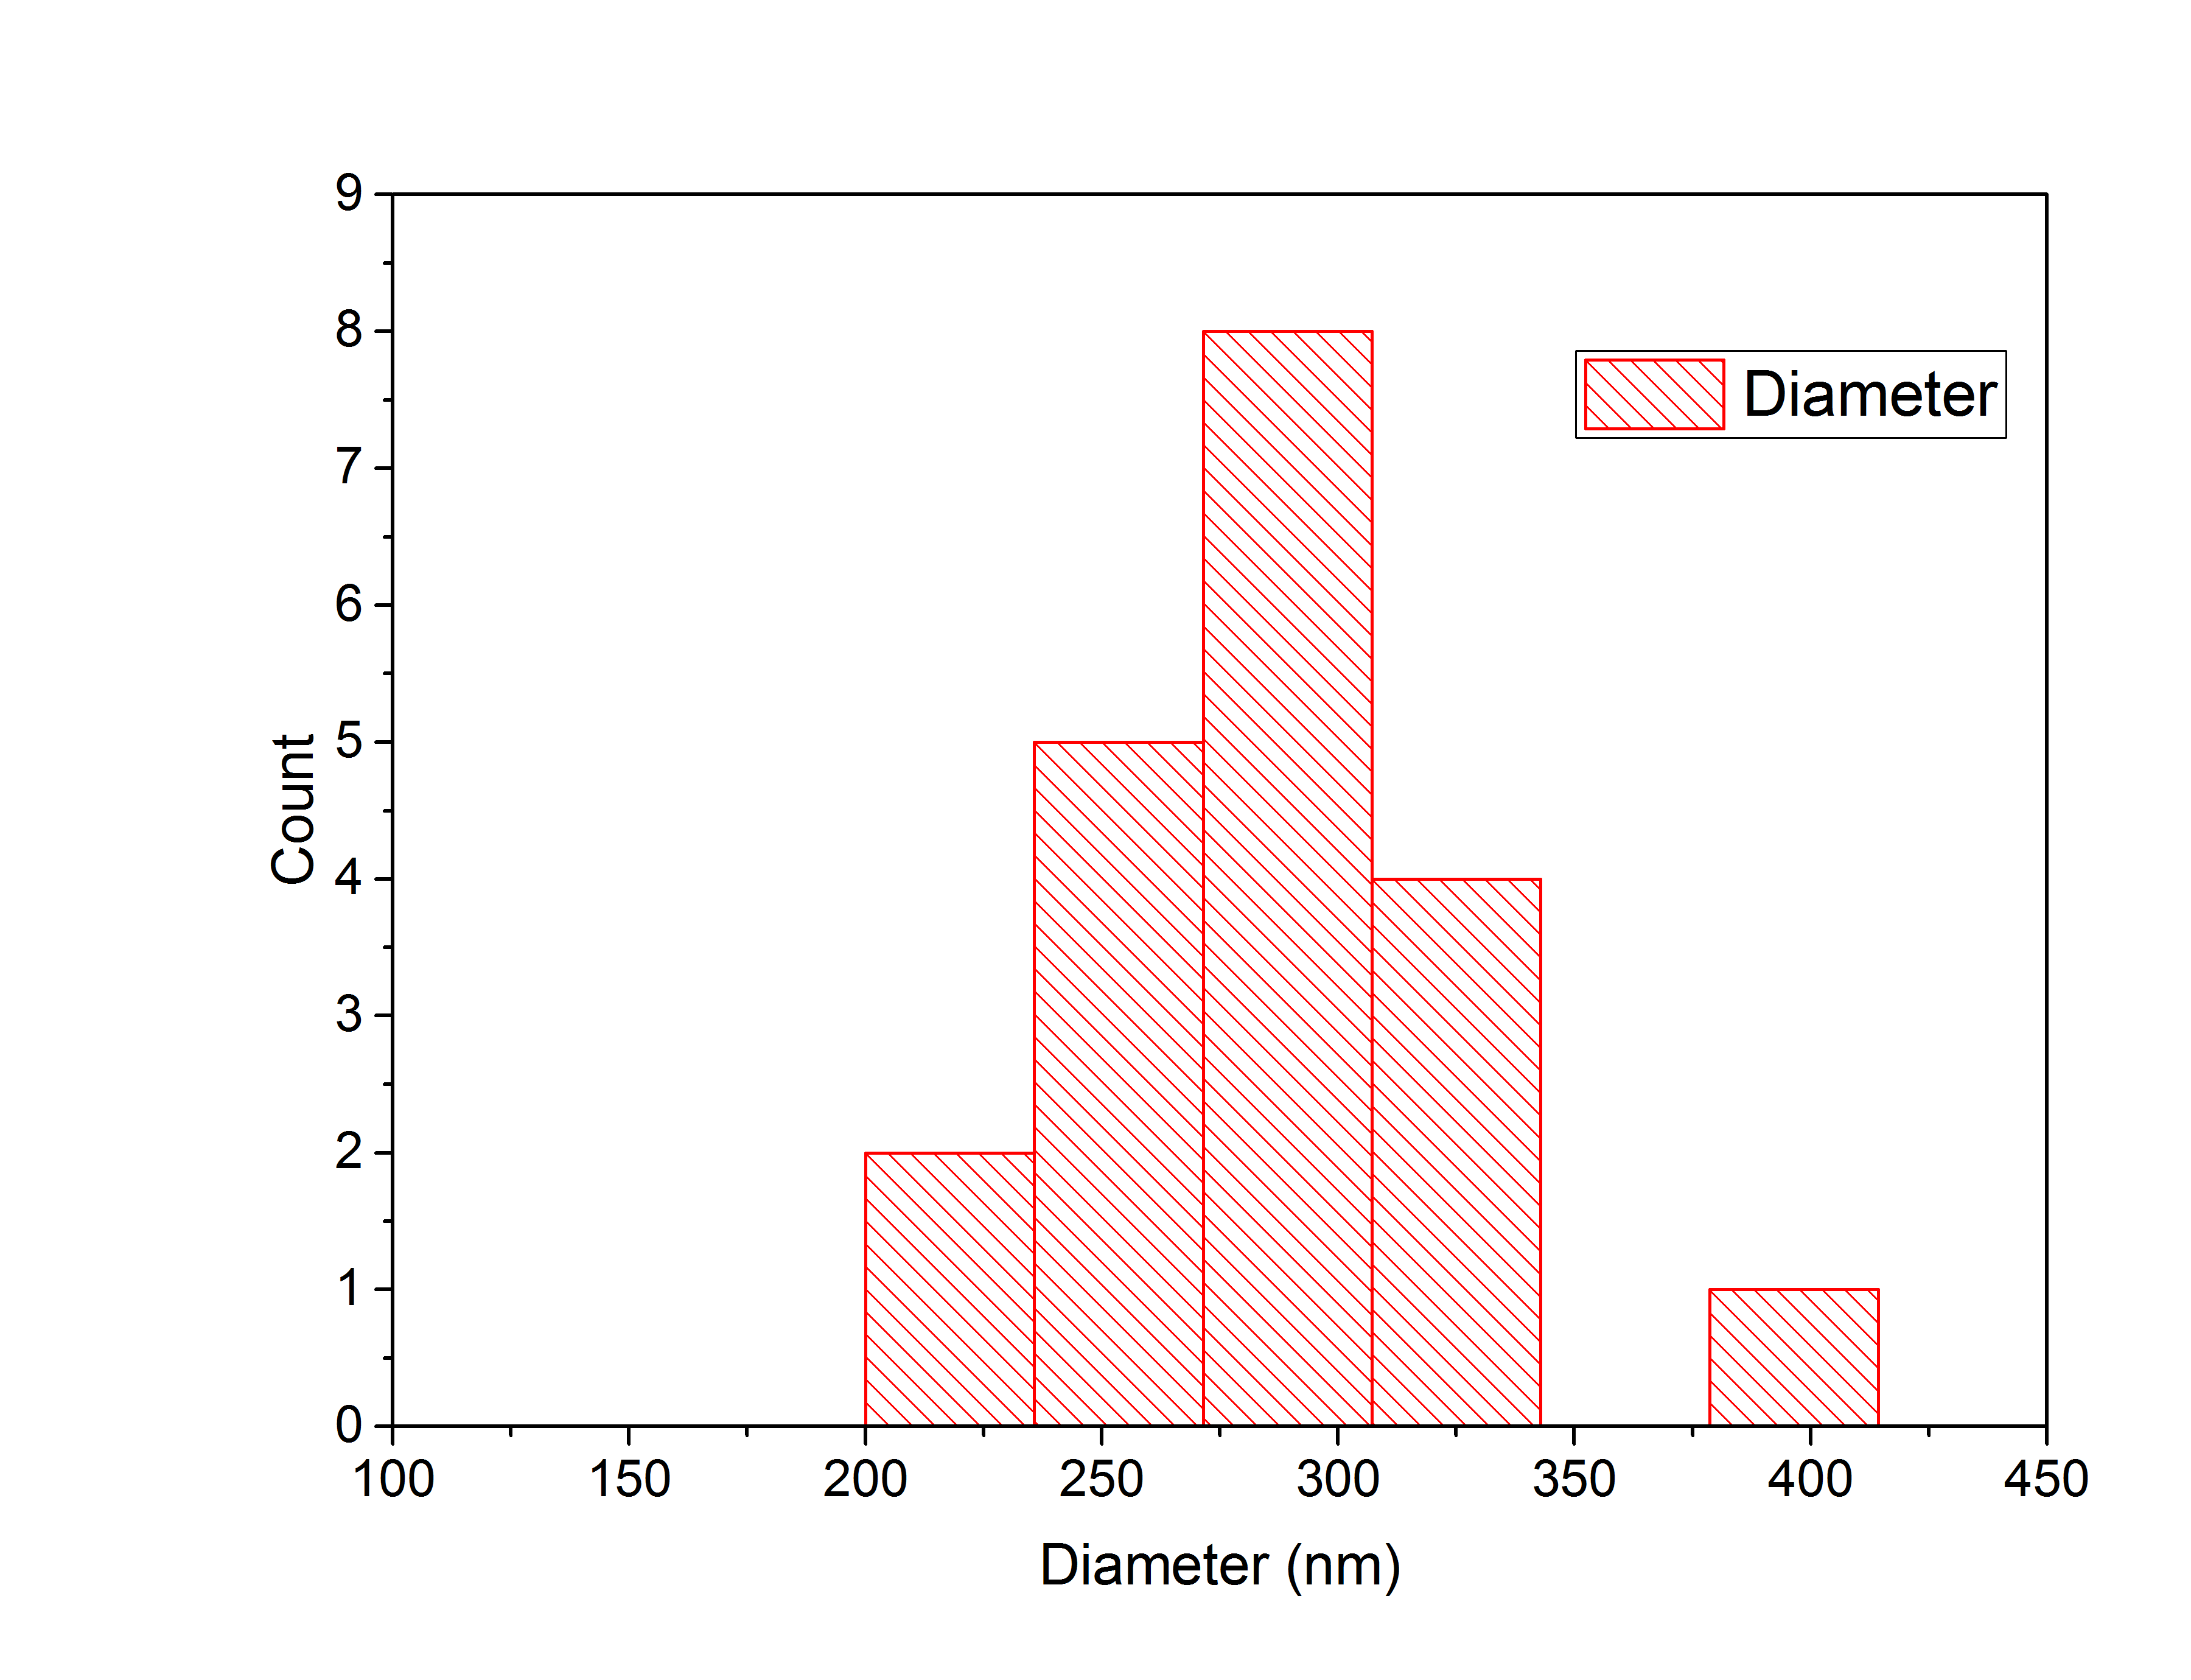
Only slightly glowing particles were measured, because bright glowing spheres were accumulated particles. Twenty particles were analyzed in total by laying a diagonal line through the center of the particle to the edges of the circle. The intensities of the signals along the line were plotted using the Adrian's FWHM algorithm, which determined the full width half maximum of the Gaussian plots automatically. The resulting particle widths were used to create a histogram (Figure 6), to display the distribution of the particles diameters.
Figure 6: Histogram of particle widths.
Through the histogram the average diameter of the nanospheres is determined to be 289 nm.
Transmission Electron Microscopy (TEM)
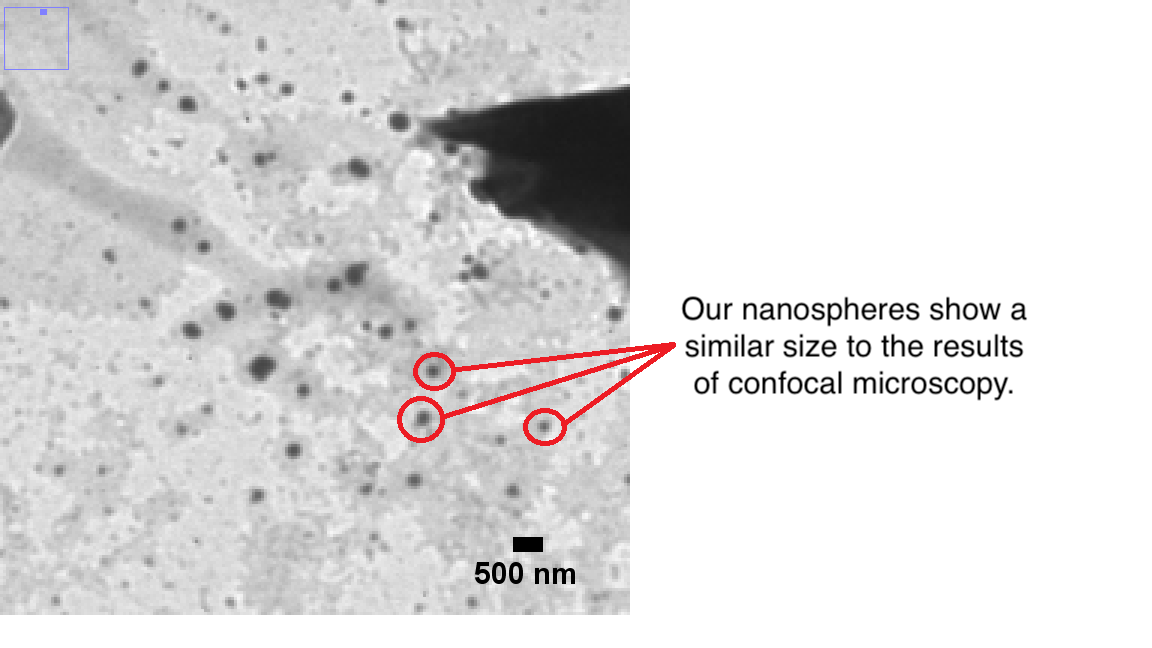
We also used TEM-pictures to analyze the diameter of our spheres. The pictures show both spherical elements and a trend of accumulation of those elements. Because we assume that the smallest visible spherical elements are our nanospheres, we focused only on these and tried to estimate their size. The accumulates were not considered, because without knowing how many nanospheres they include, it is not possible to determine the size of a single nanosphere through the accumulate size. By the comparison with the scale bar, we determined the average diameter of the nanospheres to be approximately 250 nm (Figure 7).
Figure 7: TEM image of our nanospheres.
Conclusion
First of all it is important to underline that all different analysis have advantages and disadvantages. The results of DLS analysis are highly stochastic with minor deviations but they are neither proof that our spheres cause the signal nor that we actually have spherical elements. Compared to that, the results of confocal microscopy and TEM show only small cut outs of the complete sample. Indeed the TEM gave us a precise shape of our sample particles and the confocal microscopy showed us if the process of loading the nanospheres with fluorescein succeeded. To summarize, all three analysis methods add up to a precise image of our nanospheres and we were able to proof that we successfully synthesized nanospheres with a diameter of about 250 nm to 289 nm and loaded their polymer matrix with fluorescein molecules.
Outlook
As shown above, we could successfully prove that we were able to create nanospheres with our polymers and load them with a substance of our choice. For further research, the next step would be to perform tests of loading the spheres with various hydrophobic and hydrophilic substances or therapeutics and investigate the behavior of the loaded spheres in vivo to see how they interact with blood vessels and tissue.
References
- ↑ Bioplastic packaging material [1]
- ↑ Bioplastic packaging material Jie Wang, Ze Lu, Delivery of siRNA Therapeutics: Barriers and Carriers, The AAPS Journal, Vol. 12, No. 4, December 2010
- ↑ Jian-Ming Lü, Xinwen Wang, Christian Marin-Muller, Hao Wang, Peter H Lin, Qizhi Yao, and Changyi Chen. Current advances in research and clinical applications of PLGA-based nanotechnology. Expert Rev Mol Diagn. 2009 May; 9(4): 325–341 [2]
- ↑ J.H.Park, B.K.Lee, S.H.Park, M.G.Kim, J.W.Lee, H.Y.Lee, H.B.Lee, J.H.Kim and M.S.Kim.Int J Mol Sci.18(3): 671 (2017). doi:10.3390/ijms18030671 .
- ↑ H.K.Makadia, S.J.Siegel. Polymers 3(3), 1377-1397 (2011).
- ↑ 6.0 6.1 Katja B. Ferenz, Long‑circulating poly(ethylene glycol)‑coated poly(lactid‑coglycolid) microcapsules as potential carriers for intravenously administered drugs, Journal of Microencapsulation, 2013, 1–11, Early Online [Link oder so].
- ↑ Schindelin, J.; Arganda-Carreras, I. & Frise, E. et al. (2012), "Fiji: an open-source platform for biological-image analysis", Nature methods 9(7): 676-682, PMID 22743772, doi:10.1038/nmeth.2019

