Team:UI Indonesia/Project
OVERVIEW
Diphtheria is becoming a prominent issue in Indonesia as its incidence is increasing recently. It also causes various complications, leading to morbidity and mortality. We realized the urgency of fast, reliable, and cheap early detection method for diphtheria infection as one of means necessary for its eradication. Therefore, we created a chimeric between native Escherichia coli Tar chemotaxis receptor and human HB-EGF receptor so the bacterium may recognize diphtheria toxin. Moreover, we combined CheA and CheY in E. coli chemotaxis system with LuxAB and eYFP, respectively. When in contact, LuxAB and eYFP create resonance energy transfer system in which LuxAB gives its emission to eYFP. Without diphtheria toxin, CheA will be in phosphorylated state, allowing interaction with CheY and energy transfer, resulting in yellow color. Toxin binding into chimeric receptor will inhibit CheA phosphorylation, hindering interaction with CheY and energy transfer, resulting in blue color (i.e. LuxAB native color).
Pathogenesis of Diphtheria: How Does Corynebacterium diphtheriae Cause the Disease?
Corynebacterium diphtheriae is a Gram-positive rod bacterium that causes diphtheria. It produces exotoxin with two fragments (AB toxin). Fragment B facilitates toxin internalization within host cell via endocytosis upon binding HB-EGF receptor,while fragment A catalyzes modification of ribosomal elongation factor-2; therefore, it suppresses protein synthesis
Tar-mediated Chemotaxis System in Escherichia coli
In E. coli, chemotaxis mediated by methyl-accepting chemotaxis proteins (MCPs) has been widely studied. MCPs are transmembrane chemoreceptors with periplasmic ligand binding domain and cytoplasmic signaling domain. To date, four different E. coli MCPs have been identified: Tar, Tsr, Trg and Tap chemoreceptors.
Tar chemoreceptor mediates E. coli movement towards aspartate and maltose (attractant molecules). It undergoes conformational change upon attractant molecule binding, leading to inhibition of CheA protein autophosphorylation and subsequent CheY activity. This causes the flagellum facilitates the bacterium to swin towards attractant substance via opposite motor protein FliM rotation. On the other hand, CheA autophosphorylation would cause prominent rotation of motor protein to make tumbling effect.
LuxAB-eYFP Fluorescence Resonance Energy Transfer (FRET) System
Basically, a molecule is excited to higher energy state when it absorbs a photon energy. This molecule relaxes back to ground state when the energy is emitted back to the environment or transferred into another molecule. FRET is a phenomenon in which non-radioactive energy is transferred from excited donor molecule to acceptor molecule via dipole-dipole interactions. Molecules involved in this phenomenon are called fluorophores as they emit fluorescence according to their respective emission spectrum after absorbing higher photon energy. LuxAB and eYFP are one of the most widely studied paired fluorophores. In this case, LuxAB is the donor fluorophore as it emits cyan colored light with relatively high energy (peak emission at 490 nm). eYFP serves as the acceptor fluorophore when in close contact with LuxAB, as it absorbs high energy from LuxAB that is overlapped with its own absorption spectrum and emits yellow colored light with lower energy (peak emission at 530 nm). To be utilized in macromolecules interaction studies, LuxAB and eYFP should be incorporated with the molecules of interest. When the molecules of interest are in contact, energy transfer between LuxAB and eYFP will happen and its efficiency can be measured with fluorescence-lifetime imaging microscopy method.
OUR PROJECT
Genetic circuit
The gene for the parts used in our project are all expressed through a inducible promoter. The product of the genes do not interact with and regulate the expression of the gene of another part itself. Product of genes only interact with products of other genes.
The system made use of the chemotactic pathway in E. coli used to detect the presence of amino acids. The first part of the original pathway is the Tar receptor which detected aspartate. In our project, the receptor domain of this protein is modified by inserting the receptor domain of HB-EGF, the receptor which diphtheria toxin binds in human cells. The design of the chimeric protein, which we named HBEGF-Tar (HT), is explained more deeply in the modelling page.
In the native pathway, when no aspartate binds the Tar receptor, the CheA protein autophosphorylates and interacted with the CheY protein. CheY then interacts with FliM protein in the motor section of the flagella. This interaction results in the tumbling movement of the flagella. When aspartate binds with the Tar receptor, the autophosphorylation of CheA stops, thus stopping the interaction of CheA with CheY. The interaction between CheA and CheY is what our team use to detect the binding of diphtheria toxin through the Lux-BRET (Bioluminescence Resonance Energy Transfer) system. For this purpose, we linked CheA to LuxAB protein and CheY to enhanced yellow fluorescence protein (eYFP).

When diphtheria toxin (in our project, a modified version of it) binds with the HB-EGF binding domain in HBEGF-Tar, the interaction between CheA and CheY is supposed to stop as if there’s aspartate binding. The input which is the binding of diphtheria toxin with HBEGF-Tar will create an output of blue color as a result of the lack of interaction between CheA and CheY. When there is no binding of diphtheria toxin, CheA and CheY could interact, thus resulting in LuxAB and eYFP being brought into close proximity, resulting in the fluorescence of eYFP which resulted in an output of yellow color.


Lab Notes and Protocol
here we attached our protocol used during the lab work and some notes that might be usefull in the future
RESULTS AND DISCUSSIONS
Introduction
Managing the realization of the usage of synthetic diphtheria exotoxin (i.e. DiphTox/DT) and chimeric HB-EGF/Tar (i.e. HT) receptor, our team proposed a focus on characterizing the part of each BioBrick’s function. This year, our team, would be more focusing on testing the binding ability of both BioBricks in living E. coli spheroplast. FRET system would proceed in the later project of Finding Diphthy next in iGEM 2019. Before heading on to the lab results, it is recommended to fully understand the structure of DT and HT gBlocks and their respective protein functions in Parts (https://2018.igem.org/Team:UI_Indonesia/Parts) and Model domain (https://2018.igem.org/Team:UI_Indonesia/Model) of UI_Indonesia Wiki page.

Materials and Equipment
Some of the materials are provided by IHVCB lab, as well as Promega sponsored kit and IDT.
Materials from 2018 DNA Distribution Kit
- Part BBa_J04450 containing mRFP BioBrick in the pSB1C3 backbone
Materials provided by IHVCB lab UI
- ddH2O or nuclease-free water (NFW)
- Chemical substances, such as MgCl2, NaCl, CaCl2, etc
- 96-well plate
- 96-well plate reader (GloMaxTM– Multi Detection System)
- Luria Bertani (LB) liquid or agar media
- Competent cell of Escherichia coli strain K12 derivates, such as TOP10 and DH5α, also strain B derivate such as BL21(DE3).
- Antibiotics consisting of chloramphenicol (Cam) and ampicillin (Amp)
- Polymerase chain reaction (PCR) thermal cycler
- Micropipettes and tips
- Microtubes and centrifuge tubes
- Ice and buckets
- Electrophoretic horizontal (DNA) and vertical (protein) chamber, power supply
- Vortex
- Minicentrifuge and ultracentrifuge
- Gel electrophoresis reader (Gel DocTM XR+ Gel Documentation System) and sodium dodecyl sulphate - polyacrilamide gel electrophoresis (SDS-PAGE) reader (ImageQuantTM)
- Buffers and enzymes (restriction enzymes such as EcoRI and PstI, ligase, etc.)
- Static incubator and roto-shaker
- Heatblock machine
- Autoclave and microwave machine
Methods
Our lab team started to use traditional cloning for insertion of desired gene into backbone plasmids for expression and iGEM 2018 submission. The traditional cloning would involve the methods of inserting gene fragments into MCS (multiple site cloning) of backbone or between prefix-suffix. The whole processes of gene cloning for further assays in this project are described in the Figure 1 and 2.

Figure 1. Principle methods of traditional cloning

Figure 2.. Original plan of how our lab team conducted the whole experiment in establishing parts for iGEM submission and characterizing our parts: DiphTox or DT (BBa_K2607000) and HB-EGF/Tar chimeric receptor or HT (BBa_K2607001).
Part I: DT and HT Cloning
Upon receiving our parts (in gBlocks) from Integrated DNA Technologies, Inc. (IDT), we performed PCR to amplify the gBlocks. PCR cloning for all gBlocks used the hand-made designed forward (Fwd) and reverse (Rev) cloning primers (i.e. specifications could be seen in Parts page). Furthermore, cycling formula for PCR cloning and confirmation could be accessed in the lab notes, as we applied GoTaqTM Long PCR enzyme as the Hi-Fi polymerase. The amplified gBlocks were then used as inserts to plasmid vectors. For HT BioBrick, IDT was unable to yield the full sequence in high purity, so we had to split HT into two fragments (HT-1 and HT-2), which would later be amplified, restricted with SalI, and ligated to obtain complete HT fragment
On the other hand, we also prepared vectors for carrying our parts. Backbone pSB1C3-mRFP (BBa_J04450) has been used widely in our process of traditional cloning, for it provides much sensitive selection upon transformed recombinant plasmids. Since this plasmid does not contain any available expression promoter for the designed BioBrick, our supervisor suggested the usage of pQE80L expression vector belonged to IHVCB lab for functional assays and analyses. Therefore, we used pSB1C3 as cloning vector for submission to iGEM Headquarters and pQE80L as cloning vector for expression
We conducted traditional cloning (restriction-ligation) method to introduce our previously amplified inserts into prepared vectors. Restriction digestion was done sequentially with EcoRI and PstI in total of 8 hours by using the same buffer (i.e. EcoRI buffer and bovine serum antigen (BSA) 1X) with a minimum DNA template of 10 µg. Desalting and low-melting agarose (LMA) 1% electrophoresis purification was done to further remove any possible contaminating enzymes and undesired polynucleotides. Ligation of both vectors and inserts were conducted by adding T4 ligase and its respective buffers to be later incubated 160C overnight
Transformation of resultant recombinant plasmids was done in wild-type E. coli K-12 (for submission purpose) and BL21(DE3) (for characterization and validation purpose) via “transformation protocol” methods in the other page. To enhance selection of recombinant E. coli, the transformed products were spread into selective LB agar containing appropriate antibiotic. Antibiotic formulation was complied to the lab’s proven antibiotics sensitivity test. We solubilized the powdered chloramphenicol in ethanol 95% and ampicillin in distilled water until final concentration of 25 mg/ml and 100 mg/ml, respectively. They were then added into LB media with ratio of 1:1000. After spread into LB agar, the transformed products were then incubated at 370C overnight.
In the case of transformation with pSB1C3, to select the colony with desired inserts, we performed red-white screening. If the grown colonies were red, it indicated that the colonies were transformed by native pSB1C3-mRFP and we excluded the colonies. We only picked white colonies (indicated that mRFP had been successfully removed from pSB1C3 and possibly replaced by insert) to be further confirmed for desired insert presence by colony PCR. We used VF2 and VR primers (i.e. iGEM standard primers) for confirmation of inserts in pSB1C3, while we used our hand-made designed primers for confirmation of inserts in pQE80L.
Finally, we performed mini-prep plasmid isolation for any confirmed colonies with desired inserts in pSB1C3. We grew the colonies in LB liquid medium at 370C shaken overnight. Sequencing was performed to confirm the sequence of inserts before submitted to iGEM Headquarters.
Part II: SDS-PAGE Confirmation of Expressing BioBricks
Confirmation of any expressing DT and HT protein in recombinant E. coli BL21(DE3) was done via SDS-PAGE after isopropyl-D-1-thiogalactopyranoside (IPTG) induction for 4 hours in 370C in terrific broth (TB) medium with ampicillin. Subsequent lysis of E. coli to expose the desired proteins was done chemically via ionic and temperature induction. For DT containing His-Tag at the C-terminus of the protein, we managed to do His-Tag purification using magnetic beads. Binding of the DT protein into the beads would be enhanced by adding NaCl 500 mM. Incubation and washing were done 3X to remove any protein debris. Elution of the beads would generate the purified DT protein to be analyzed in the SDS-PAGE.
Part III: DT-HT Binding Assay
Prior to this step, our team expressed HT in transformed E. coli BL21(DE3) with pQE80L-HT by IPTG induction. In addition, we also had to remove outer membrane of the E. coli. The membrane removal would enable the HT receptor (in inner membrane) exposed directly towards extracellular environment, and possibly detecting DT.
Binding assays of DT and HT was conducted within 96-well plates by measuring the absorbance of 600 nm. This absorbance index indicates amounts of E. coli spheroplasts that successfully bound into DT in various environmental conditions (i.e. pH, temperatures, and DT concentration variables). Incubation was done within 60 minutes and purified magnetically using the available His-Tag. The amount of HT receptor binds to DT correlates positively with the amount of spheroplasts available in the eluents. Therefore, OD600 is used as the primary quantification of spheroplasts amounts in the eluents. Specific details regarding methods of binding assays could be accessed via protocol page
Part IV: Luminescence (ADP-GloTM Kinase) Assays
To prepare the samples, we incubated E. coli BL21(DE3) transformed with empty pQE80L and pQE80L-HT cultures in LB liquid medium with ampicillin (1000:1) overnight. We created four replicates for each culture. On the following day, 1 mL from each replicate (eight in total) was aliquoted into 4 mL fresh TB medium with ampicillin (1000:1) and 4 µL IPTG 1 M. The replicates were incubated at 37oC, 220 rpm for four hours. Their OD600 were then determined and the replicates were subsequently pelleted at 12,000 rpm for one minute. The pellets were then lysed using Promega FastBreakTM cell lysis reagent according the manufacturer protocol.
The following luminescence assay procedures is based on kit protocol with some modifications. First, we created standard curve according to the kit protocol to estimate ATP-to-ADP conversion rate from luminescence data. This performed by creating series of 1 mM ATP+ADP mixture with varying percentage of ADP relative to ATP+ADP (Table 1) in first row of microplate well. Series of 100 µM, 10 µM, and 1 µM were created by serial dilution in subsequent rows. The luminescence was then determined using Promega GloMax®-Multi Detection System.
Table 1.ATP+ADP mixture with varying percentage of ADP relative to ATP+ADP in microplate wells for standard curve.

Next, the reaction between lysed cells and purified DT with the amount of 180 nM (i.e. from Part III we found that Kd for HB-EGF/Tar and DT binding is 88.43 nM in 250C, then the maximum binding activity in 250C is expected to be achieved at twice of Kd) was carried out under 1x kinase reaction buffer consisting of 40 mM Tris pH 7.5, 20 mM MgCl2, and 0.1 mg/mL BSA. Ten µL from each reaction was aliquoted into wells in microplate and 10 µL of ADP-GloTM reagent was added to each well to stop the reaction and deplete the remaining ATP in the samples. After 40 minutes of incubation, 20 µL of kinase detection reagent was added to each well to convert ADP to ATP which will be used to generate luminescence and introduce substances (i.e. luciferin and luciferase) for luminescence. After 30 minutes of incubation, the luminescence was measured. Further details regarding ADP-Glo methods could be accessed in the protocol page.
Result and Discussion
Part I: Gel Electrophoresis Confirmation of DT and HT cloning
Confirmation Insertion of DT into pQE80L and pSB1C3
Insertion of DT into pQE80L (for assays) and pSB1C3 (for submission) was done via traditional cloning using EcoRI and PstI restriction endonucleases. We have managed to maintain the workflow as preceding flowchart mentioned in methods. Transformation of recombinant plasmids is done into E. coli strain BL21(DE3) for pQE80L and TOP10 for pSB1C3, respectively. BL21(DE3) was chosen rather than TOP10 for assays, as it maintains anti-protease activity which would enable DT proteins undegraded intracellularly. In addition, BL21(DE3) is also a strain compatible for expression under T7 promoter (which is present in HT gBlock). Electrophoresis of colony PCR in the chamber utilized agarose 1% m/v soaked with TAE 1X, powered within 100 V for 30 minutes. Figure 3 and 4 shows the process of how we selected the colonies with recombinant plasmids, while Figure 5 and 6 were the final results of DT colony PCR confirmation.

Figure 3. Colonies of E. coli BL21(DE3) with pQE80L-DT in LB agar containing ampicillin

Figure 4. Ultraviolet (UV) illumination of E. coli transformed with pSB1C3-DT. Red-white screening could be utilized since our team used pSB1C3-mRFP as initial backbone vector.

Figure 5. Gel analysis of colony PCR on pQE80L-DT transformed into E. coli BL21(DE3). PCR colony primer would amplify ~250 bp bands that located inside the DT BioBrick, indicating that the DT fragment was successfully cloned into pQE80L.

Figure 6. Gel analysis of PCR colonies on pSB1C3-DT transformed E. coli TOP10. Universal flanked primers of VF2 and VR in pSB1C3 would amplify ~600 bp bands that were found in several following colonies, indicating that the DT fragment was successfully cloned into pSB1C3.
From these results, we concluded that DT BioBrick was successfully inserted into pSB1C3 and pQE80L backbone.
Confirmation Insertion of HB-EGF/Tar (HT) into pQE80L and pSB1C3
The methods for inserting HT complete fragment were quite challenging, since it must be linearly ligated in the first place prior to recombination into plasmid vector. Linear ligation of HT-1 and HT-2 fragments were conducted by using SalI restriction enzyme, yielding approximately 1954 bp complete HT BioBrick. Unfortunately, PCR amplification in the beginning using hand-made designed Fwd and Rev cloning primers could not generate specific bands (i.e. the primers anneals unspecific in various length of both HT fragments, see Collaborations page). Therefore, the gBlocks were shipped to Nanyang Technology University, Singapore (NTU-Singapore) team for ligation into pcDNA3 and pSB1C3. Our team conducted immediate transfer of complete HT BioBricks into pQE80L, while waiting for NTU finishing the cloning of the HT complete fragments into pSB1C3. The transfer of completed HT into pQE80L is shown in Figure 7 and 8, while the transfer of completed HT into pSB1C3 (done by NTU-Singapore) is shown in Figure 9.

Figure 7. Gel analysis of colony PCR on pQE80L-HT transformed E. coli BL21(DE3). The subsequent ~600s bp bands were found in the following colonies, indicating that the HT fragment was successfully inserted
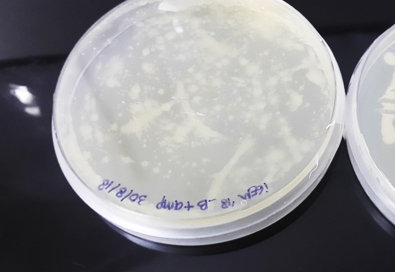
Figure 8. PCR colonies of pQE80L-HT in LB + Amp agar medium

Figure 9. Gel analysis of colony PCR of pSB1C3-HT. Universal VF2 and VR primers would amplify ~2000s bp bands that located inside the BioBrick HT, indicating that the HT fragment was successfully cloned into pSB1C3. Note: this datum was provided by team NTU-Singapore as gratitude for their aid in submission cloning for team UI_Indonesia’s HT fragments.
These results suggested that HT BioBrick was successfully cloned into pSB1C3 and pQE80L backbone
Part II: SDS-PAGE Confirmation of Expressing Biobricks
After insertion of both BioBricks into pQE80L, the assays could begin with expression confirmation. For transcription initiation of BioBricks require lac promoter provided by the vector, induction of IPTG was essential. Identification of positive control using E. coli TOP10 transformed with pBluescript KS(-) could be important in determining whether our IPTG used was expired or not. Wild-type E. coli BL21(DE3) and E. coli BL21(DE3) inserted with empty pQE80L were used as negative control. Furthermore, purification of DT was conducted to increase sensitivity of expression yield. Figure 10 and 11 shows the SDS-PAGE performed to confirm DT and HT expression, respectively.

Figure 10. SDS-PAGE analysis (photographed via ImageQuant) of pQE80L-DT expression in E. coli BL21(DE3). White arrow indicates LacZα (size ~20.7 kDa) protein expression due to IPTG induction, indicating our IPTG was in good condition. On the other hand, black arrow shows DT (size ~7 kDa) protein expression as it is induced with IPTG within 4 hours. Note: pKS(0) = E. coli TOP10 transformed with pBluescript KS(-) with no IPTG induction; pKS(4) = E. coli TOP10 transformed with pBluescript KS(-) after 4 hours of IPTG induction in 370C; BL21(DE3) = wild-type E. coli BL21(DE3); BL21(DE3) w/ pQE80L = E. coli BL21(DE3) containing empty pQE80L; pQE80L-DT(0) = E. coli BL21(DE3) containing recombinant pQE80L-DT with no IPTG induction; pQE80L-DT(0)p = purified protein of E. coli BL21(DE3) containing recombinant pQE80L-DT with no IPTG induction; pQE80L-DT(4) = E. coli BL21(DE3) containing recombinant pQE80L-DT with 4 hours of IPTG induction; pQE80L-DT(4)p = purified protein of E. coli BL21(DE3) containing recombinant pQE80L-DT after 4 hours of IPTG induction.

Figure 11. SDS-PAGE analysis (photographed via ImageQuant) of pQE80L-HT expression in E. coli BL21(DE3). White arrow indicates LacZα (size ~20.7 kDa) protein expression due to IPTG induction, while black arrow shows increasing HT (size ~57.8 kDa) protein expression as it is induced with IPTG within 4 hours. Note: pKS(0) = E. coli TOP10 transformed with pBluescript KS(-) with no IPTG induction; pKS(4) = E. coli TOP10 transformed with pBluescript KS(-) after 4 hours of IPTG induction in 370C; BL21(DE3) = wild-type E. coli BL21(DE3); BL21(DE3) w/ pQE80L = E. coli BL21(DE3) containing empty pQE80L; pQE80L-HT(0) = E. coli BL21(DE3) containing recombinant pQE80L-HT with no IPTG induction; pQE80L-HT(4) = E. coli BL21(DE3) containing recombinant pQE80L-HT after 4 hours of IPTG induction.
Extraction of the protein DiphTox from recombinant E. coli was done by prominent lysis of cells grown that is grown overnight. Native lysis buffer was utilized to maintain specific protein configuration for its function for binding. To measure protein concentration, our team would use Bradford assay using Coomassie Brilliant Blue solution and placed within plate reader for 595 nm absorbance test. Standard curve of the assay was produced using Bovine Serum Albumin (BSA) as concentration standards.

Figure 12. Standard curve of BSA in Bradford assay.
Part III: DT-HT Binding Assays
Effect of Temperatures on DT-HT Binding Kinetics
Upon confirmation of DT and HT expression, our team would like to testify the interaction of those proteins. Prior to binding assay, the recombinant E. coli possessing HT expression should be uncoated from the outer membrane layer. This lets huge molecules or proteins accessing the periplasmic layer or inner plasma membrane of the bacteria. Transforming E. coli into intact spheroplast could be a disadvantageous for the cell itself, since the membrane is more fragile to extracellular extremes. This would be one of the major challenges of the binding assays in determining specific pH and temperatures for keeping the spheroplasts alive. Methods for making spheroplasts could be accessed in the protocol page
Spheroplasts were subjected to different DT concentration during one hour incubation with different temperatures (Table 2). Binding of HT receptor towards intact DT in Magne-His beads would prevent spheroplasts elimination during washing process. Elution of spheroplasts would be the final variable in quantifying DT-HT binding strength.
Table 2. Net OD600 (minus blank: elution buffer) results of DT-HT binding assays in different temperatures and various DT concentrations. Triplicates were done to minimize bias of absorbance data.


Figure 13. Average amount of E. coli spheroplasts (expressed in OD600) remained in the eluent after magnetic binding with DT in different DT concentrations and temperatures. OD600 is expressed within arbitrary unit. Standard error of estimates is shown in between 0.005-0.008.
Plotting of the OD600 in the graph (Figure 13) could be referred classically as ligand-receptor dynamics. The increasing of DT concentration would enable huge amount binding of spheroplasts in the incubation. Therefore, the logarithmic trend occurs in the beginning. Nevertheless, there would be an amount of DT concentration where the number of spheroplast binding would be reaching its maximum. Affinity constant of the receptor towards ligands could be determined as the amount of substrate causing saturation of 50% receptors. Reverse plotting of Lineweaver-Burke would be required to determine the values of HT-DT affinity constant and maximum saturation. Modified receptor-ligand formulae could be further transformed as shown in Figure 14. (Note: y represents 1/OD600, and x represents 1/substrate concentration in linear equation)


Figure 14. P-P plot regression analysis to determine its Lineweaver-Burke linear equation. R square values and linear equations are shown within regression in each temperature via SPSS Basic Statistics v.21. Therefore, standardized values of Kd and OD600 max could be determined in different temperature conditions.
Different temperatures exhibit different affinity constant and maximum binding (Table 3). It is natural that HT receptor possesses optimum tertiary structure facilitating binding of DT in certain environmental condition. Highest affinity of HT towards DT occurs in temperature of 250C. Additionally, maximum binding of HT towards DT happens highest in 40C and 370C. Low temperature might increase the possibility of HT-DT binding, since the molecular kinetical energy is low. Therefore, extrapolation of affinity and maximum binding from different temperatures into single human body temperatures (370C) would be required in future research.
Table 3. Effect of temperatures towards binding kinetics of DT and HT.

In conclusion, positive binding of HT and DT shows that the designed ligand-receptor could be further used as predicted models of diphtheria toxins interaction in human body.
Effect of Extracellular pH Towards Optimization of DT-HT Binding.
Profound understanding of the natural HT and DT binding could be analyzed by measuring the binding activities in different pH concentration. This could serve as potential basis for prediction models of environment that supports the interaction. Principles of measuring the activities are the same as previous one. Triplicates are subjected to different pH solution, ranging from 4-8.5, during an hour incubation prior to elution (Table 4). The used concentration of DT in this assay was 180 nM (as it referred to maximum binding of DT concentration towards HT in 250C).
Table 4. Net OD600 (minus blank: elution buffer) results of DT-HT binding in different extracellular pH. Triplicates were conducted to minimize bias effect of absorbance index.


Figure 15. This clustered column represents amount of spheroplasts remained in the eluent buffer after washing in different pH solution. Triplicates with standard bar errors indicate any data bias optimized as samples. Different alphabetic indexes top of the column express data significances, such as a-b (p<0.05), a-c (p<0.05), and b-c (p<0.01).
Optimal pH for the binding interaction occurs at 7 to 7.5 (Figure 15). This is exactly the physiological pH condition inside human body. Significant drop of binding activity observed at pH 5.5 could indicate early spheroplast autolysis, since it triggers intracellular cascade of lysis protein according to Raam R, et al. Therefore, lab models of binding HT-DT could be conducted optimally within pH range of 7 to 7.5.
Part IV: Luminescence (ADP-GloTM Kinase) Assays

Figure 16. Standard curve for percent ATP-to-ADP conversion from luminescence with varying concentrations of ATP+ADP mixture (1 µM, 10 µM, 100 µM, and 1 mM). RFU = relative light units.
The standard curve obtained for percent ATP-to-ADP conversion from luminescence data is shown in Figure 16. With this standard curve, we can estimate how much ATP is converted into ADP (or how much ATP is conserved in HT-DT reaction compared to normal) based on given luminescence data later in the experiment.
Table 5. Net OD600 (minus blank) and luminescence (in RFU) after reaction with DT.


Figure 17. Luminescence per OD600 (RFU) of control (transformed E. coli BL21(DE3) with empty pQE80L) and experimental (transformed E. coli BL21(DE3) with pQE80L+HT) group. * indicates significant difference compared to control (p = 0.001).
Table 5 shows net OD600 (after deducted by blank Abs600) and their luminescence after reaction with DT for each replicate, while Figure 17 shows comparison between luminescence per OD600 for control (E. coli BL21(DE3) transformed with empty pQE80L) and experimental (E. coli BL21(DE3) transformed with pQE80L+ HT) group upon reaction with DT. We found that luminescence level in experimental group was significantly lower than control group (p = 0.001). This result suggested that experimental group has lower ADP concentration than control group, which likely to be caused by HT interaction with DiphTox inhibits CheA phosphorylation, ultimately leading to more ATP conserved and less ADP produced. Therefore, upon reaction with kinase detection reagent, less ADP will be converted into ATP in experimental group, causing less luminescence compared with control group.
From the experiment, we did not know the initial ATP+ADP concentration from each control and experimental group. Assuming the initial ATP concentration was 1 mM (mean ATP concentration in E. coli is 1.56 ± 1.27 mM according to Yaginuma et al.), with the help of standard curve from Figure 1, we can estimate that percent of ATP-to-ADP conversion inhibition upon HT-DT interaction was around 1%. This is due to luminescence of standard 0% ADP-ATP mixture was 1.69 x 10⁶, similar with mean luminescence of experimental group (1.55 x 10⁶), while luminescence of standard 1% ADP-ATP mixture was 2.2 x 10⁶, similar with mean luminescence of control group (2.1 x 10⁶). One note to be considered that E. coli cells may have varying level of intracellular ATP and ADP, as stated by large standard deviation of ATP concentration from Yaginuma et al. study. However, we grew and treated E. coli used in this experiment equally, also we created replicates for each group to minimize the possible bias.
Hence, our present result suggested that our HT works as expected to inhibit phosphorylation, shown by less luminescence generated compared with control, indicating that less ADP was produced upon HT-DT interaction.
Reference
- Mohan, R. R., Kronish, D. P., Pianotti, R. S., Epstein, R. L., & Schwartz, B. S. (1965). Autolytic Mechanism for Spheroplast Formation in Bacillus cereus and Escherichia coli. Journal of Bacteriology, 90(5), 1355–1364.
- Yaginuma H, et al. Diversity of ATP concentrations in a single bacterial cell population revealed by quantitative single-cell imaging. 2014. Available from: https://www.nature.com/articles/srep06522
- ddH2O or nuclease-free water (NFW)
- Chemical substances, such as MgCl2, NaCl, CaCl2, etc
- 96-well plate
- 96-well plate reader (GloMaxTM– Multi Detection System)
- Luria Bertani (LB) liquid or agar media
- Competent cell of Escherichia coli strain K12 derivates, such as TOP10 and DH5α, also strain B derivate such as BL21(DE3).
- Antibiotics consisting of chloramphenicol (Cam) and ampicillin (Amp)
- Polymerase chain reaction (PCR) thermal cycler
- Micropipettes and tips
- Microtubes and centrifuge tubes
- Ice and buckets
- Electrophoretic horizontal (DNA) and vertical (protein) chamber, power supply
- Vortex
- Minicentrifuge and ultracentrifuge
- Gel electrophoresis reader (Gel DocTM XR+ Gel Documentation System) and sodium dodecyl sulphate - polyacrilamide gel electrophoresis (SDS-PAGE) reader (ImageQuantTM)
- Buffers and enzymes (restriction enzymes such as EcoRI and PstI, ligase, etc.)
- Static incubator and roto-shaker
- Heatblock machine
- Autoclave and microwave machine
Figure 1. Principle methods of traditional cloning
Figure 2.. Original plan of how our lab team conducted the whole experiment in establishing parts for iGEM submission and characterizing our parts: DiphTox or DT (BBa_K2607000) and HB-EGF/Tar chimeric receptor or HT (BBa_K2607001).
Part I: DT and HT Cloning
Upon receiving our parts (in gBlocks) from Integrated DNA Technologies, Inc. (IDT), we performed PCR to amplify the gBlocks. PCR cloning for all gBlocks used the hand-made designed forward (Fwd) and reverse (Rev) cloning primers (i.e. specifications could be seen in Parts page). Furthermore, cycling formula for PCR cloning and confirmation could be accessed in the lab notes, as we applied GoTaqTM Long PCR enzyme as the Hi-Fi polymerase. The amplified gBlocks were then used as inserts to plasmid vectors. For HT BioBrick, IDT was unable to yield the full sequence in high purity, so we had to split HT into two fragments (HT-1 and HT-2), which would later be amplified, restricted with SalI, and ligated to obtain complete HT fragment
On the other hand, we also prepared vectors for carrying our parts. Backbone pSB1C3-mRFP (BBa_J04450) has been used widely in our process of traditional cloning, for it provides much sensitive selection upon transformed recombinant plasmids. Since this plasmid does not contain any available expression promoter for the designed BioBrick, our supervisor suggested the usage of pQE80L expression vector belonged to IHVCB lab for functional assays and analyses. Therefore, we used pSB1C3 as cloning vector for submission to iGEM Headquarters and pQE80L as cloning vector for expression
We conducted traditional cloning (restriction-ligation) method to introduce our previously amplified inserts into prepared vectors. Restriction digestion was done sequentially with EcoRI and PstI in total of 8 hours by using the same buffer (i.e. EcoRI buffer and bovine serum antigen (BSA) 1X) with a minimum DNA template of 10 µg. Desalting and low-melting agarose (LMA) 1% electrophoresis purification was done to further remove any possible contaminating enzymes and undesired polynucleotides. Ligation of both vectors and inserts were conducted by adding T4 ligase and its respective buffers to be later incubated 160C overnight
Transformation of resultant recombinant plasmids was done in wild-type E. coli K-12 (for submission purpose) and BL21(DE3) (for characterization and validation purpose) via “transformation protocol” methods in the other page. To enhance selection of recombinant E. coli, the transformed products were spread into selective LB agar containing appropriate antibiotic. Antibiotic formulation was complied to the lab’s proven antibiotics sensitivity test. We solubilized the powdered chloramphenicol in ethanol 95% and ampicillin in distilled water until final concentration of 25 mg/ml and 100 mg/ml, respectively. They were then added into LB media with ratio of 1:1000. After spread into LB agar, the transformed products were then incubated at 370C overnight.
In the case of transformation with pSB1C3, to select the colony with desired inserts, we performed red-white screening. If the grown colonies were red, it indicated that the colonies were transformed by native pSB1C3-mRFP and we excluded the colonies. We only picked white colonies (indicated that mRFP had been successfully removed from pSB1C3 and possibly replaced by insert) to be further confirmed for desired insert presence by colony PCR. We used VF2 and VR primers (i.e. iGEM standard primers) for confirmation of inserts in pSB1C3, while we used our hand-made designed primers for confirmation of inserts in pQE80L.
Finally, we performed mini-prep plasmid isolation for any confirmed colonies with desired inserts in pSB1C3. We grew the colonies in LB liquid medium at 370C shaken overnight. Sequencing was performed to confirm the sequence of inserts before submitted to iGEM Headquarters.
Part II: SDS-PAGE Confirmation of Expressing BioBricks
Confirmation of any expressing DT and HT protein in recombinant E. coli BL21(DE3) was done via SDS-PAGE after isopropyl-D-1-thiogalactopyranoside (IPTG) induction for 4 hours in 370C in terrific broth (TB) medium with ampicillin. Subsequent lysis of E. coli to expose the desired proteins was done chemically via ionic and temperature induction. For DT containing His-Tag at the C-terminus of the protein, we managed to do His-Tag purification using magnetic beads. Binding of the DT protein into the beads would be enhanced by adding NaCl 500 mM. Incubation and washing were done 3X to remove any protein debris. Elution of the beads would generate the purified DT protein to be analyzed in the SDS-PAGE.
Part III: DT-HT Binding Assay
Prior to this step, our team expressed HT in transformed E. coli BL21(DE3) with pQE80L-HT by IPTG induction. In addition, we also had to remove outer membrane of the E. coli. The membrane removal would enable the HT receptor (in inner membrane) exposed directly towards extracellular environment, and possibly detecting DT.
Binding assays of DT and HT was conducted within 96-well plates by measuring the absorbance of 600 nm. This absorbance index indicates amounts of E. coli spheroplasts that successfully bound into DT in various environmental conditions (i.e. pH, temperatures, and DT concentration variables). Incubation was done within 60 minutes and purified magnetically using the available His-Tag. The amount of HT receptor binds to DT correlates positively with the amount of spheroplasts available in the eluents. Therefore, OD600 is used as the primary quantification of spheroplasts amounts in the eluents. Specific details regarding methods of binding assays could be accessed via protocol page
Part IV: Luminescence (ADP-GloTM Kinase) Assays
To prepare the samples, we incubated E. coli BL21(DE3) transformed with empty pQE80L and pQE80L-HT cultures in LB liquid medium with ampicillin (1000:1) overnight. We created four replicates for each culture. On the following day, 1 mL from each replicate (eight in total) was aliquoted into 4 mL fresh TB medium with ampicillin (1000:1) and 4 µL IPTG 1 M. The replicates were incubated at 37oC, 220 rpm for four hours. Their OD600 were then determined and the replicates were subsequently pelleted at 12,000 rpm for one minute. The pellets were then lysed using Promega FastBreakTM cell lysis reagent according the manufacturer protocol.
The following luminescence assay procedures is based on kit protocol with some modifications. First, we created standard curve according to the kit protocol to estimate ATP-to-ADP conversion rate from luminescence data. This performed by creating series of 1 mM ATP+ADP mixture with varying percentage of ADP relative to ATP+ADP (Table 1) in first row of microplate well. Series of 100 µM, 10 µM, and 1 µM were created by serial dilution in subsequent rows. The luminescence was then determined using Promega GloMax®-Multi Detection System.
Table 1.ATP+ADP mixture with varying percentage of ADP relative to ATP+ADP in microplate wells for standard curve.
Next, the reaction between lysed cells and purified DT with the amount of 180 nM (i.e. from Part III we found that Kd for HB-EGF/Tar and DT binding is 88.43 nM in 250C, then the maximum binding activity in 250C is expected to be achieved at twice of Kd) was carried out under 1x kinase reaction buffer consisting of 40 mM Tris pH 7.5, 20 mM MgCl2, and 0.1 mg/mL BSA. Ten µL from each reaction was aliquoted into wells in microplate and 10 µL of ADP-GloTM reagent was added to each well to stop the reaction and deplete the remaining ATP in the samples. After 40 minutes of incubation, 20 µL of kinase detection reagent was added to each well to convert ADP to ATP which will be used to generate luminescence and introduce substances (i.e. luciferin and luciferase) for luminescence. After 30 minutes of incubation, the luminescence was measured. Further details regarding ADP-Glo methods could be accessed in the protocol page.
Result and Discussion
Part I: Gel Electrophoresis Confirmation of DT and HT cloning
Confirmation Insertion of DT into pQE80L and pSB1C3
Insertion of DT into pQE80L (for assays) and pSB1C3 (for submission) was done via traditional cloning using EcoRI and PstI restriction endonucleases. We have managed to maintain the workflow as preceding flowchart mentioned in methods. Transformation of recombinant plasmids is done into E. coli strain BL21(DE3) for pQE80L and TOP10 for pSB1C3, respectively. BL21(DE3) was chosen rather than TOP10 for assays, as it maintains anti-protease activity which would enable DT proteins undegraded intracellularly. In addition, BL21(DE3) is also a strain compatible for expression under T7 promoter (which is present in HT gBlock). Electrophoresis of colony PCR in the chamber utilized agarose 1% m/v soaked with TAE 1X, powered within 100 V for 30 minutes. Figure 3 and 4 shows the process of how we selected the colonies with recombinant plasmids, while Figure 5 and 6 were the final results of DT colony PCR confirmation.
Figure 3. Colonies of E. coli BL21(DE3) with pQE80L-DT in LB agar containing ampicillin
Figure 4. Ultraviolet (UV) illumination of E. coli transformed with pSB1C3-DT. Red-white screening could be utilized since our team used pSB1C3-mRFP as initial backbone vector.
Figure 5. Gel analysis of colony PCR on pQE80L-DT transformed into E. coli BL21(DE3). PCR colony primer would amplify ~250 bp bands that located inside the DT BioBrick, indicating that the DT fragment was successfully cloned into pQE80L.
Figure 6. Gel analysis of PCR colonies on pSB1C3-DT transformed E. coli TOP10. Universal flanked primers of VF2 and VR in pSB1C3 would amplify ~600 bp bands that were found in several following colonies, indicating that the DT fragment was successfully cloned into pSB1C3.
From these results, we concluded that DT BioBrick was successfully inserted into pSB1C3 and pQE80L backbone.
Confirmation Insertion of HB-EGF/Tar (HT) into pQE80L and pSB1C3
The methods for inserting HT complete fragment were quite challenging, since it must be linearly ligated in the first place prior to recombination into plasmid vector. Linear ligation of HT-1 and HT-2 fragments were conducted by using SalI restriction enzyme, yielding approximately 1954 bp complete HT BioBrick. Unfortunately, PCR amplification in the beginning using hand-made designed Fwd and Rev cloning primers could not generate specific bands (i.e. the primers anneals unspecific in various length of both HT fragments, see Collaborations page). Therefore, the gBlocks were shipped to Nanyang Technology University, Singapore (NTU-Singapore) team for ligation into pcDNA3 and pSB1C3. Our team conducted immediate transfer of complete HT BioBricks into pQE80L, while waiting for NTU finishing the cloning of the HT complete fragments into pSB1C3. The transfer of completed HT into pQE80L is shown in Figure 7 and 8, while the transfer of completed HT into pSB1C3 (done by NTU-Singapore) is shown in Figure 9.
Figure 7. Gel analysis of colony PCR on pQE80L-HT transformed E. coli BL21(DE3). The subsequent ~600s bp bands were found in the following colonies, indicating that the HT fragment was successfully inserted
Figure 8. PCR colonies of pQE80L-HT in LB + Amp agar medium
Figure 9. Gel analysis of colony PCR of pSB1C3-HT. Universal VF2 and VR primers would amplify ~2000s bp bands that located inside the BioBrick HT, indicating that the HT fragment was successfully cloned into pSB1C3. Note: this datum was provided by team NTU-Singapore as gratitude for their aid in submission cloning for team UI_Indonesia’s HT fragments.
These results suggested that HT BioBrick was successfully cloned into pSB1C3 and pQE80L backbone
Part II: SDS-PAGE Confirmation of Expressing Biobricks
After insertion of both BioBricks into pQE80L, the assays could begin with expression confirmation. For transcription initiation of BioBricks require lac promoter provided by the vector, induction of IPTG was essential. Identification of positive control using E. coli TOP10 transformed with pBluescript KS(-) could be important in determining whether our IPTG used was expired or not. Wild-type E. coli BL21(DE3) and E. coli BL21(DE3) inserted with empty pQE80L were used as negative control. Furthermore, purification of DT was conducted to increase sensitivity of expression yield. Figure 10 and 11 shows the SDS-PAGE performed to confirm DT and HT expression, respectively.
Figure 10. SDS-PAGE analysis (photographed via ImageQuant) of pQE80L-DT expression in E. coli BL21(DE3). White arrow indicates LacZα (size ~20.7 kDa) protein expression due to IPTG induction, indicating our IPTG was in good condition. On the other hand, black arrow shows DT (size ~7 kDa) protein expression as it is induced with IPTG within 4 hours. Note: pKS(0) = E. coli TOP10 transformed with pBluescript KS(-) with no IPTG induction; pKS(4) = E. coli TOP10 transformed with pBluescript KS(-) after 4 hours of IPTG induction in 370C; BL21(DE3) = wild-type E. coli BL21(DE3); BL21(DE3) w/ pQE80L = E. coli BL21(DE3) containing empty pQE80L; pQE80L-DT(0) = E. coli BL21(DE3) containing recombinant pQE80L-DT with no IPTG induction; pQE80L-DT(0)p = purified protein of E. coli BL21(DE3) containing recombinant pQE80L-DT with no IPTG induction; pQE80L-DT(4) = E. coli BL21(DE3) containing recombinant pQE80L-DT with 4 hours of IPTG induction; pQE80L-DT(4)p = purified protein of E. coli BL21(DE3) containing recombinant pQE80L-DT after 4 hours of IPTG induction.
Figure 11. SDS-PAGE analysis (photographed via ImageQuant) of pQE80L-HT expression in E. coli BL21(DE3). White arrow indicates LacZα (size ~20.7 kDa) protein expression due to IPTG induction, while black arrow shows increasing HT (size ~57.8 kDa) protein expression as it is induced with IPTG within 4 hours. Note: pKS(0) = E. coli TOP10 transformed with pBluescript KS(-) with no IPTG induction; pKS(4) = E. coli TOP10 transformed with pBluescript KS(-) after 4 hours of IPTG induction in 370C; BL21(DE3) = wild-type E. coli BL21(DE3); BL21(DE3) w/ pQE80L = E. coli BL21(DE3) containing empty pQE80L; pQE80L-HT(0) = E. coli BL21(DE3) containing recombinant pQE80L-HT with no IPTG induction; pQE80L-HT(4) = E. coli BL21(DE3) containing recombinant pQE80L-HT after 4 hours of IPTG induction.
Extraction of the protein DiphTox from recombinant E. coli was done by prominent lysis of cells grown that is grown overnight. Native lysis buffer was utilized to maintain specific protein configuration for its function for binding. To measure protein concentration, our team would use Bradford assay using Coomassie Brilliant Blue solution and placed within plate reader for 595 nm absorbance test. Standard curve of the assay was produced using Bovine Serum Albumin (BSA) as concentration standards.
Figure 12. Standard curve of BSA in Bradford assay.
Part III: DT-HT Binding Assays
Effect of Temperatures on DT-HT Binding Kinetics
Upon confirmation of DT and HT expression, our team would like to testify the interaction of those proteins. Prior to binding assay, the recombinant E. coli possessing HT expression should be uncoated from the outer membrane layer. This lets huge molecules or proteins accessing the periplasmic layer or inner plasma membrane of the bacteria. Transforming E. coli into intact spheroplast could be a disadvantageous for the cell itself, since the membrane is more fragile to extracellular extremes. This would be one of the major challenges of the binding assays in determining specific pH and temperatures for keeping the spheroplasts alive. Methods for making spheroplasts could be accessed in the protocol page
Spheroplasts were subjected to different DT concentration during one hour incubation with different temperatures (Table 2). Binding of HT receptor towards intact DT in Magne-His beads would prevent spheroplasts elimination during washing process. Elution of spheroplasts would be the final variable in quantifying DT-HT binding strength.
Table 2. Net OD600 (minus blank: elution buffer) results of DT-HT binding assays in different temperatures and various DT concentrations. Triplicates were done to minimize bias of absorbance data.
Figure 13. Average amount of E. coli spheroplasts (expressed in OD600) remained in the eluent after magnetic binding with DT in different DT concentrations and temperatures. OD600 is expressed within arbitrary unit. Standard error of estimates is shown in between 0.005-0.008.
Plotting of the OD600 in the graph (Figure 13) could be referred classically as ligand-receptor dynamics. The increasing of DT concentration would enable huge amount binding of spheroplasts in the incubation. Therefore, the logarithmic trend occurs in the beginning. Nevertheless, there would be an amount of DT concentration where the number of spheroplast binding would be reaching its maximum. Affinity constant of the receptor towards ligands could be determined as the amount of substrate causing saturation of 50% receptors. Reverse plotting of Lineweaver-Burke would be required to determine the values of HT-DT affinity constant and maximum saturation. Modified receptor-ligand formulae could be further transformed as shown in Figure 14. (Note: y represents 1/OD600, and x represents 1/substrate concentration in linear equation)
Figure 14. P-P plot regression analysis to determine its Lineweaver-Burke linear equation. R square values and linear equations are shown within regression in each temperature via SPSS Basic Statistics v.21. Therefore, standardized values of Kd and OD600 max could be determined in different temperature conditions.
Different temperatures exhibit different affinity constant and maximum binding (Table 3). It is natural that HT receptor possesses optimum tertiary structure facilitating binding of DT in certain environmental condition. Highest affinity of HT towards DT occurs in temperature of 250C. Additionally, maximum binding of HT towards DT happens highest in 40C and 370C. Low temperature might increase the possibility of HT-DT binding, since the molecular kinetical energy is low. Therefore, extrapolation of affinity and maximum binding from different temperatures into single human body temperatures (370C) would be required in future research.
Table 3. Effect of temperatures towards binding kinetics of DT and HT.
In conclusion, positive binding of HT and DT shows that the designed ligand-receptor could be further used as predicted models of diphtheria toxins interaction in human body.
Effect of Extracellular pH Towards Optimization of DT-HT Binding.
Profound understanding of the natural HT and DT binding could be analyzed by measuring the binding activities in different pH concentration. This could serve as potential basis for prediction models of environment that supports the interaction. Principles of measuring the activities are the same as previous one. Triplicates are subjected to different pH solution, ranging from 4-8.5, during an hour incubation prior to elution (Table 4). The used concentration of DT in this assay was 180 nM (as it referred to maximum binding of DT concentration towards HT in 250C).
Table 4. Net OD600 (minus blank: elution buffer) results of DT-HT binding in different extracellular pH. Triplicates were conducted to minimize bias effect of absorbance index.
Figure 15. This clustered column represents amount of spheroplasts remained in the eluent buffer after washing in different pH solution. Triplicates with standard bar errors indicate any data bias optimized as samples. Different alphabetic indexes top of the column express data significances, such as a-b (p<0.05), a-c (p<0.05), and b-c (p<0.01).
Optimal pH for the binding interaction occurs at 7 to 7.5 (Figure 15). This is exactly the physiological pH condition inside human body. Significant drop of binding activity observed at pH 5.5 could indicate early spheroplast autolysis, since it triggers intracellular cascade of lysis protein according to Raam R, et al. Therefore, lab models of binding HT-DT could be conducted optimally within pH range of 7 to 7.5.
Part IV: Luminescence (ADP-GloTM Kinase) Assays
Figure 16. Standard curve for percent ATP-to-ADP conversion from luminescence with varying concentrations of ATP+ADP mixture (1 µM, 10 µM, 100 µM, and 1 mM). RFU = relative light units.
The standard curve obtained for percent ATP-to-ADP conversion from luminescence data is shown in Figure 16. With this standard curve, we can estimate how much ATP is converted into ADP (or how much ATP is conserved in HT-DT reaction compared to normal) based on given luminescence data later in the experiment.
Table 5. Net OD600 (minus blank) and luminescence (in RFU) after reaction with DT.