Team:Valencia UPV/Experiments


During the development of Printeria, experimentation has been one of the fundamental aspects in each step of our project. The design of new experiments and protocols has allowed us to validate the results obtained from the device or the laboratory with the theoretical schemes and to guarantee the repeatability of each experience. These experiments were intended to cover three key objectives of the project:
-
To demonstrate the functioning of the Printeria device through the concept tests of the technologies separately and through the tests and protocols related to Printeria established in the Wet Lab.
-
To characterize the parts in an experimental way in order to include the maximum information in our Printeria Part Collection.
-
To obtain as much information as possible about the reporter proteins commonly used in Web Lab experiments, such as GFP, YFP or sfGFP.
Check the results of our experiments yourself...
Printeria protocols & experiments
Printeria Wet Lab
In regard to the lab work, several lines of experiments have been carried out with the objective of ensuring the biological functioning of Printeria. We have kept a record of our daily lab work through different notebooks, so you can access the documents for each group of experiments by clicking their respective buttons.
You can also read the collection of protocols we have followed to proceed with our experiments, so they could be easily repeated by future iGEM teams.
Level 0 assembly (DNA Basic parts adaptation)
Printeria needs a toolkit of DNA basic parts adapted to be assembled with the Golden Gate assembly method. We have designed them as they appear on our Design page. You can check the chronological construction phases of these parts going to:
Destination vector experiments
We have done several experiments to select the way to introduce the Level 1 destination plasmid, in order to obtain the lowest number of bacteria without the desired insert resulting from the Golden Gate assembly reaction, and thus trying to avoid the necessity of the plate screening step. The progressive process of decision has been recorded in our:
Experiments with competent cells
Several experiments were done to decide how to introduce the E. coli chassis into Printeria. It included transformation efficiency experiments with freeze drying competent cells and with competent cells maintained at -20ºC and room temperature. All the experiments are chronologically listed in our:
Level 1 assembly (Composite Parts Assembly)
In order to characterize our DNA basic parts, we had to assemble composite parts using the Golden Gate technology (Level 1 assembly) with our DNA basic part collection. By this way we were able to check the robustness of the protocol and to verify that its efficiency was high enough to be done by Printeria.
pBioBrickator plasmid construction and composite parts adaptation
As it is explained in the Part Collection page , we have designed the BBa_K2656200 vector, adapted from the standard pSB1C3 backbone, to convert our Golden Gate transcriptional units to BioBricks. Thus, we were able to introduce each transcriptional unit into a BioBrick compatible vector with a Type IIS enzyme reaction. This process can be checked going to:
Printeria device
In the Printeria project, the experiments carried out on the machine developed by the Printeria Hardware team stand out in importance. With them, we have tried to verify the automation process that our device offers to the user. Below are described both the materials and the procedures of the most important experiments our Printeria equipment.
Input system
-
Arduino
-
Peristaltic pump
-
Solenoid
-
Syringe
-
Input carrousel
-
Stepper motor
-
Sealed pipette tips
-
The pipette tips are loaded with 4 μL of liquid and are placed in place on the input carrousel.
-
The stepper motor spins it to get the filled pipette tips under the syringe.
-
The solenoid is activated, moving down the syringe into the tip.
-
The pump blows filtered air into the tip, releasing the liquid.
In this experiment we wanted to test the feasibility of the concept of breaking the seal we put in pipette tips and blowing through the synge to get the contents out.
Materials:
Procedure:
Digital microfluidics
-
HV supply
-
Pad prototype PCB 1
-
Parafilm
-
Silicone oil
-
A thin layer of silicone oil is placed on top of the pads of the PCB.
-
The parafilm is stretched to be as thin as possible.
-
Another layer of silicone oil is placed on top of the parafilm.
-
15 μL of water are placed on top of one of the pads.
-
We manually connected and disconnected wires from the HV voltage supply set at 300 V.
-
HV supply
-
Pad prototype PCB 2
-
IC: HV507
-
Arduino
-
Parafilm
-
Silicone oil
-
A thin layer of silicone oil is placed on top of the pads of the PCB.
-
The parafilm is stretched to be as thin as possible.
-
Another layer of silicone oil is placed on top of the parafilm.
-
15 μL of water are placed on top of one of the pads.
-
Using the arduino we send commands of which pad to turn on, moving the droplet
-
HV supply
-
Pad prototype PCB final
-
IC: HV507
-
Arduino
-
Parafilm
-
Silicone oil
-
A thin layer of silicone oil is placed on top of the pads of the PCB.
-
The parafilm is stretched to be as thin as possible.
-
Another layer of silicone oil is placed on top of the parafilm.
-
15 μL of water are placed on top of one of the pads.
-
Using the arduino we send commands of which pad to turn on, moving the droplet.
For the first experiment of droplet movement the objective was to determine the important parameters that affect this technology.
Materials:
Procedure:
For the second iteration of droplet movement test the objective was to add automation to the movement:
Materials:
Procedure:
Extending onto the previous experiment we designed a PCB that would serve as the surface from printeria. This time we used 6 concatenated IC.
Materials:
Procedure:
Hot/cold zone
The objective of this experiment is to test the concept of a hot and cold zone to replace a thermocycler.
-
Peltier device
-
Power resistor
-
Arduino
-
Variable voltage power supply
-
IRFZ44N mosfet
-
Thermistors
-
2k2 and 10k resistors
-
Intel stock cooler
gBlock of BBa_K2656024 adapted to be assembled into P10500
-
BsmBI endonuclease
-
T4 DNA ligase
-
Bovine serum albumine
-
T4 DNA ligase buffer
-
10G electrocompetent cells
-
Electroporator
-
Electroporation cuvette
-
LB-agar plates with Kanamycin
-
SOC recovery medium
-
Assemble the circuit.
-
Set up the reaction following the Golden Gate assembly protocol.
-
Pipette the drop where the reaction is taking place between the zone at 16ºC and the one at 37ºC during 25 cycles following these times:
-
Transform the electrocompetent cells with 9 μL of the reaction result.
Materials:
Procedure:
|
Temperature (ºC) |
Time (minutes) |
|---|---|
|
37 |
3 |
|
16 |
4 |
Electroporator
-
Electroporator PCB
-
Arduino
-
HV Supply
-
Electroporation cuvette
-
Pipette 1 μL of DNA (80.5 ng/ μL) into 50 μL 10G aliquot
-
Transfer into the electroporation cuvette
-
Turn on the electroporation module, with 5 ms of set point and 1.5 kV.
-
Add 700 μL SOC liquid medium and incubate for 1h with vigorous shaking
-
Plate 300 μL into agar plate with kanamycin antibiotic
-
Incubate for 16-18h at 37ºC
On this experiment the objective was to test the electroporator module for Printeria.
Materials:
Procedure:
To test the electroporation module, we transformed 10G electrocompetent cells with 1 to 2 μL of the BBa_K26560105 transcriptional unit previously assembled into an alpha GoldenBraid vector (KmR). Thus, this plasmid express the sfGFP protein and so express fluorescence under UV light.
Parts characterization
This year, Valencia UPV iGEM team has designed an extensive Part Collection in purpose of allowing the user to design multiple genetic constructions and experiments. One of our main objectives has been to show the user clear and structured information about the pieces that make up the Printeria kit. For this reason, we have considered the characterization of the parts as a priority when developing the project. In this way, we have elaborated an experimental protocol which have allowed us to systematically obtain and structure information from the parts.
Experimental protocol
The Printeria Modeling and Lab team and have jointly designed an experimentation protocol for the laboratory experiments. Thanks to it, and from the colonies of the different TU the experimental data can be obtained, processed and ready to be optimized.
Materials:
-
Printeria transcriptional units (see our Printeria Part Collection)
-
Measuring equipment: Biotek Cytation3
-
96 well plate
-
MATLAB 2018a software
Protocol:
-
A colony or a Glycerol stock corresponding to a TU assembled by our Lab team is used to inoculate LB culture medium (with the appropriate antibiotic, in the cases of the TU, with Kanamycin) and grow overnight at 37ºC and 250 r.p.m.
-
A 10:1 dilution of the culture is performed changing the culture media to M9 minimal medium and grow for 4 hours at 37ºC and 250 r.p.m.
-
The culture is chilled in an ice-water bath anfd the optical density at 600nm (OD600) of the culture is measured with a spectrophotometer. Then a calculation is performed (using this Excel sheet) to make a dilution in order to bring the OD600 of the culture to 0.1OD600 with the appropriate culture volume to inoculate 8 replicas into 200uL wells.
-
The experiment is designed on the measuring equipment. In our case, we use the Biotek Cytation3 equipment. We establish the equipment parameters.
Parameters
Description
Time
06:00:00 (HH:MM:SS) usually. Measurement interval: 05:00 (MM:SS)
Number of samples
We normally set 8 samples of reporter protein for each TU colony
Number of medium samples
We normally set 8 samples of medium. We normally use LB or M9 medium with Kanamycin
Temperature
37 ºC
Shake
Double Orbital. Continuously. We shake the plate before each measure
Absorbance. Optical Density (OD) measure
Wavelenght at 600 nm emission
Excitacion wavelength
We normally set 485 nm for GFP or sfGFP and 500 nm for YFP
Emission wavelength
We normally set 528 nm for GFP or sfGFP and 540 nm for YFP
Gain (G)
Normally the gain value is G = 60, although for proteins with lower fluorescence, it is recommended that G takes higher values.
Biotek Cytation 3 experiment parameters
-
Samples are introduced into the 96 well plate and the experiment begins.
-
After the experiment, fluorescence and absorbance data obtained are exported to an Excel file.
-
We run the MATLAB convert_data.m script. This script uses several additional MATLAB files with which:
-
We extract the fluorescence and absorbance matrices from the Excel file (see readExperiment3.m MATLAB function).
-
We apply the corrections to the data (see plotExperiment_yb.m MATLAB function).
-
We save the data of FOD, OD, molecules and time in a .mat format file.
-
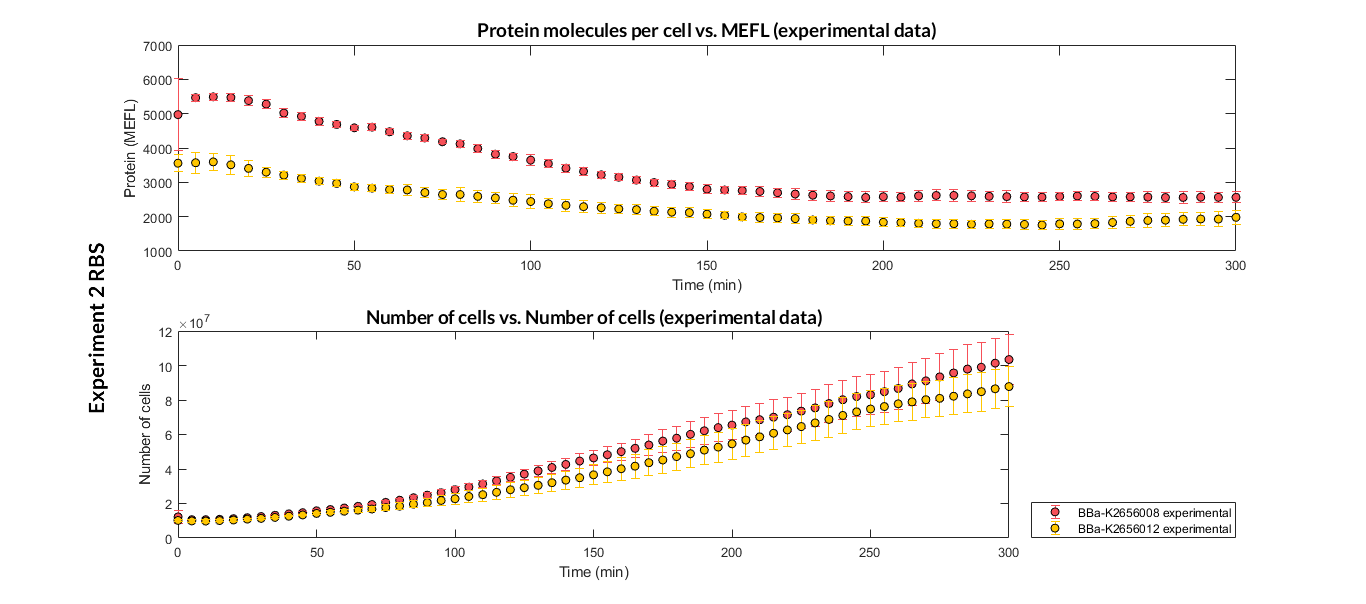
We have designed two experiments following the same experimental protocol. In them we have assembled different Printeria TU with the same promoters, CDS (sfGFP reporter protein) and transcriptional terminator, but with different RBS. These experiments were used in our modeling to complete the characterization of the part in the Printeria Collection.
Printeria TU:
Strong expression: BBa_K2656101.
Medium expression: BBa_K2656103.
Weak expression: BBa_K2656102.
Very weak expression: BBa_K2656100, BBa_K2656104.
Printeria RBS:
-
Strong expression: BBa_K2656009.
-
Medium expression: BBa_K2656011.
-
Weak expression: BBa_K2656010.
-
Very weak expression: BBa_K2656008, BBa_K2656012.
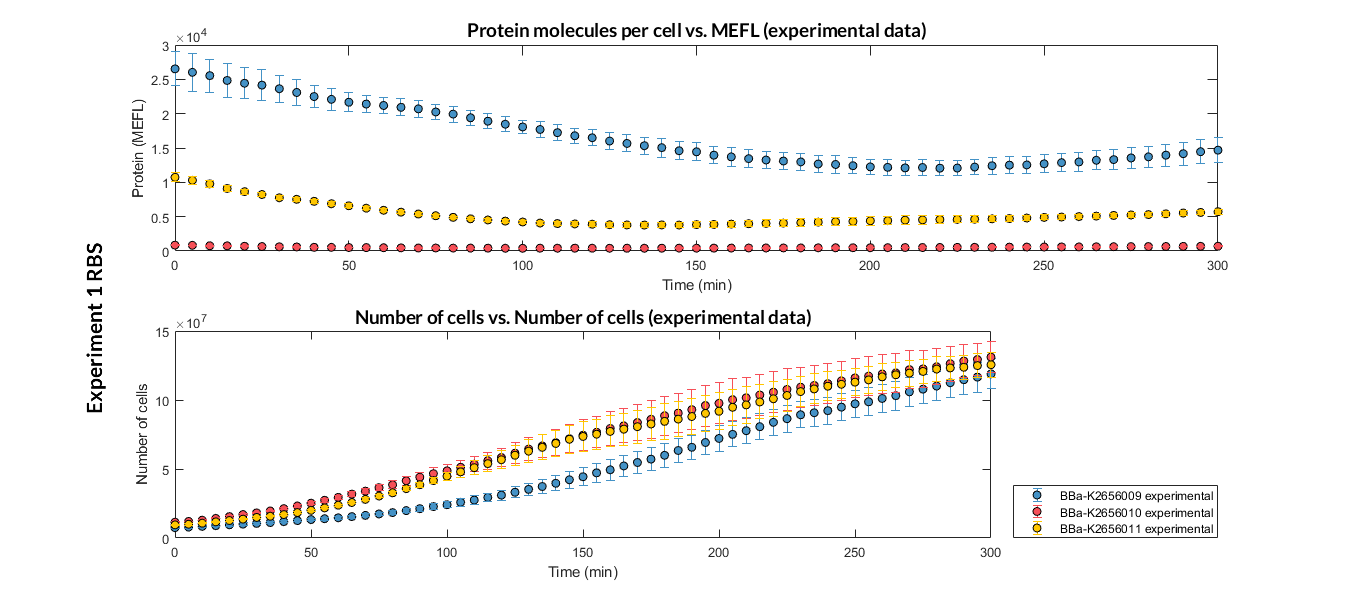
Experiment 1 changing RBS. Experimental data of strong, medium and weak protein expression RBS

Experiment 2 changing RBS. Experimental data of strong and very weak protein expression RBS
Experiment 2 changing RBS. Experimental data of very weak protein expression RBS
We have designed an experiment following the experimental protocol. In them we have assembled different Printeria TU with the same RBS, CDS (GFP reporter protein) and transcriptional terminator, and with different promoters. After obtaining the results, and following the optimization protocol, we have obtained the parameters of the model and have validated our model.
Printeria TU:
Strong promoters: BBa_K2656106
Medium promoters: BBa_K2656107
Weak promoters: BBa_K2656105
Printeria promoters:
-
Strong promoters: BBa_K2656005
-
Medium promoters: BBa_K2656007
-
Weak promoters: BBa_K2656004
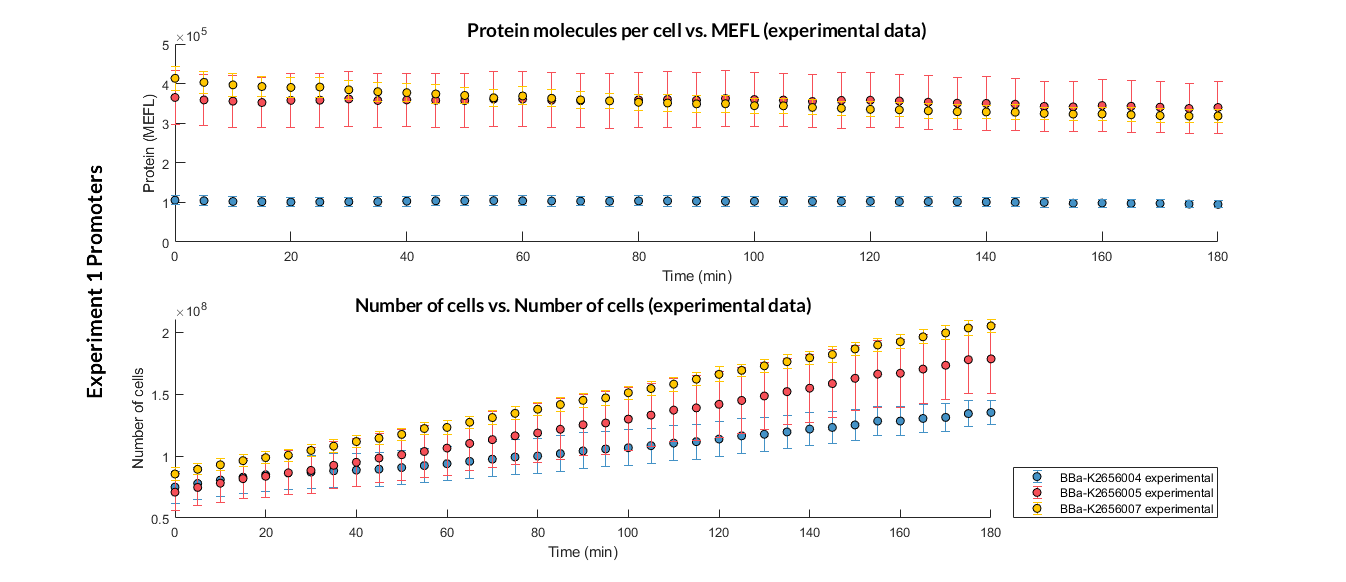
Experiment 1 changing promoters. Experimental data of strong, medium and weak promoters.
In this experiment, that we have performed following the experimental protocol, we have designed two TU. Both have the same promoters, RBS and transcriptional terminators, but different CDS. The CDS express the reporter protein YFP, however, one of them has a degradation LVA tag, which causes faster degradation.
Printeria TU:
YFP with LVA tag: BBa_K2656111
YFP without LVA tag: BBa_K2656112
Printeria CDS:
YFP with LVA tag: BBa_K2656020
YFP without LVA tag: BBa_K2656021
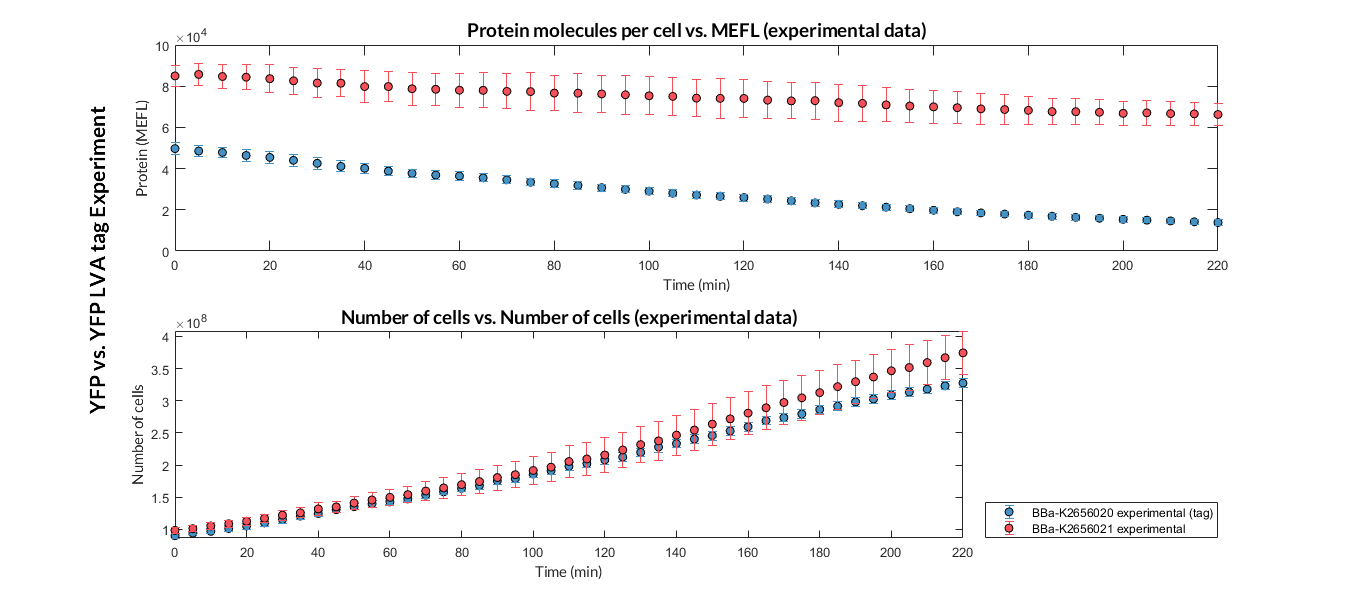
Experiment 1 YFP vs. YFP LVA tag. Experimental data of YFP and YPF LVA tag reporter proteins.
The comparison experiment aims to compare the protein expression of two genetic constructs obtained by the Golden Gate and BioBricks assembly methods. The BBa_K2656117 TU has been designed for this purpose, whose parts are identical to those constituting the BioBricks BBa_J364001 construction. Both parts have been introduced in the same vector, and this one has been introduced in turn in the same strain E. Coli 10G. Finally, the fluorescence and absorbance of both constructions have been measured, following the usual experimental protocol, and the following results have been obtained.

Reporter proteins comparisons
The reporter proteins are one of the essential elements in the experimentation process of the Valencia UPV iGEM team. Thanks to them, we can quantify the protein expression of our modified bacteria, and relate it to the theoretical models designed. Proteins such as GFP, YFP, sfGFP, mRFP... are the proteins that provide us with information about the Printeria product, and that we want to show our user.
For this reason, the Printeria Modeling team and Web Lab have jointly elaborated a series of experimental procedures to obtain new information from the reporter proteins and use it in the treatment of experimental data.
Procedure for obtaining protein spectra
Obtaining excitation and emission spectra is a fundamental aspect in the process of a fluorescent protein characterization. Each protein has a characteristic spectrum, which indicates the emitted energy of the fluorescent molecule when it is excited at a certain wavelength.
The characterization of the reporter proteins by excitation and emission spectra are very importance during experimentation. When contrasting experimental information with theoretical results of our mathematical models, we experiment with numerous reporter proteins, such as fluorescence proteins or chromoproteins. However, the fluorescence data obtained must be corrected by applying diferent operations in order to obtain representative fluorescence data:
-
The subtraction of the medium fluorescence:

-
The quotient of the fluorescence with the gain:

-
The quotient of the fluorescence with excitation and emission efficiency:


Correction process of fluorescence data
Until now, the corrections applied to the experiments were the subtraction of the fluorescence of the medium, and the division by the gain factor of the equipment. However, the measured protein spectra can be normalized with respect to the values that would have been obtained at the maximum excitation and emission wavelength.
Owing to this reason, a protocol has been established by the Lab and Modeling team to obtain a more accurate spectrum of any reporter protein.
Materials:
-
Measuring equipment: Biotek Cytation3
-
96 well plate
-
MATLAB 2018a software
Procedure:
-
We look for the theoretical spectra of the protein to be measured or similar molecules in order to determine the wavelength at which the protein is excited or emitted at maximum energy, i.e. where the theoretical spectral peaks occurs.
-
We define the protocol of our equipment to get the absorbance and fluorescence dataset. In our protocol, the most important parameters to be established are summarized in the following Table.
Parameters
Description
Number of samples
From 3 to 6 samples of reporter protein and 3 samples of medium (LB or M9 medium)
Temperature
37 ºC
Shake
Double Orbital. 01:00 (MM:SS)
Absorbance. Optical Density (OD)
Wavelenght at 600 nm emission
Excitacion and emission scans
The scans occur between two wavelength limit values. The established range will depend on the theoretical spectrum of the protein.
Excitacion and emission wavelengths
These values will depend on the range, and therefore on the spectrum. Values far from the theoretical peak lead to more attenuated fluorescence curves, and values very close to the peak can lead to overlap and error in reading the data. Therefore, a compromise must be reached between curve resolution and reading overlap.
Gain (G)
Normally the gain value is G = 60, although for proteins with lower fluorescence, it is recommended that G takes higher values.
Experimental parameters
-
The experiment is introduced, and the experimental absorbance data and the fluorescence curves of the samples are obtained with the medium fluorescence correction applied.
-
The dataset is exported to an Excel file.
-
The MATLAB script spectrum.m for fluorescent proteins is executed:
-
Dataset is extracted from the Excel file. We discard readings that have suffered overlap, or that take negative values.
-
The fluorescence curves of all samples are averaged, and the result is normalised (from 0 to 100%).
-
Graphs of the normalized absorption and emission spectra are plotted. The X-axis represents the wavelength (nm), and the Y-axis represents the normalized fluorescence intensity (%).
-
In practical terms, the protocol has been applied to all of our reporter proteins: GFP, sfGFP, YFP and mRFP. All results can be found in our parts collection as well as in the iGEM catalog.

GFP spectra
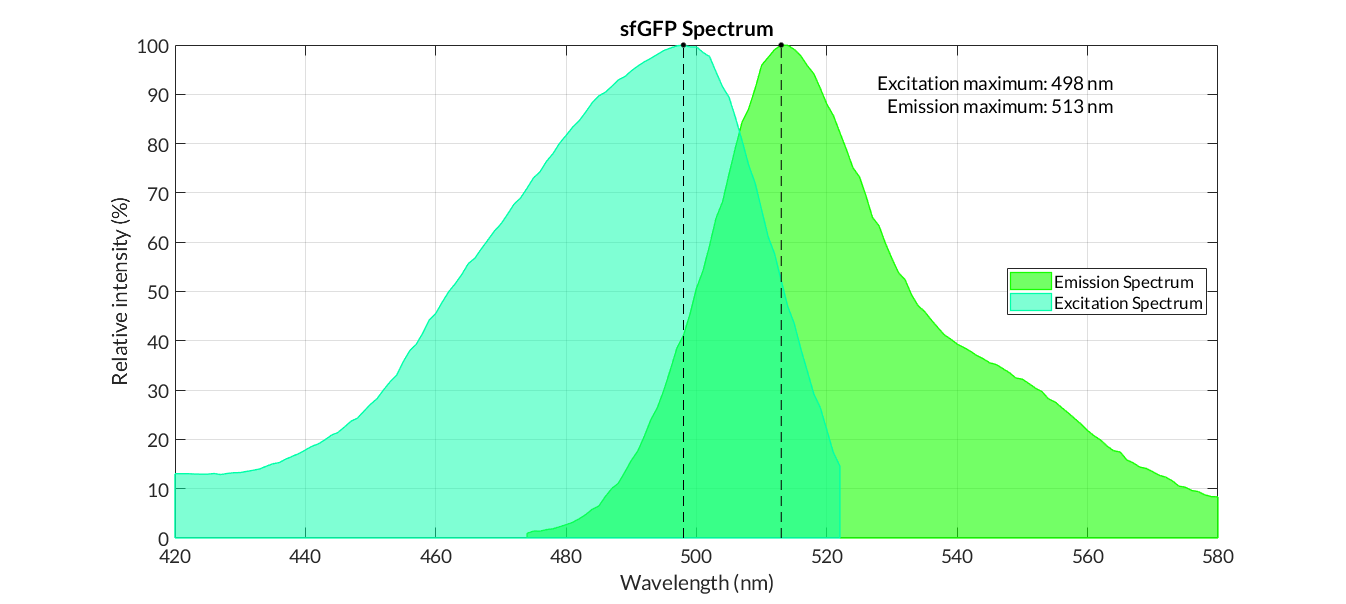
sfGFP spectra

YFP spectra

mRFP spectra
In the particular case of the reporter chromoprotein, such as amilCP, we do not measure fluorescence, but absorbance. In this case, in order to obtain the corrected absorbance curve, we must subtract the absorbance of a medium with cells without chromoprotein from the cell absorbance data with the reporter protein. Once the data have been corrected, we normalized them in a range of 0 and 100. The figure below shows the blue cromoprotein spectra. The protocol used can be found in the MATLAB script amilCP_spectrum.m.
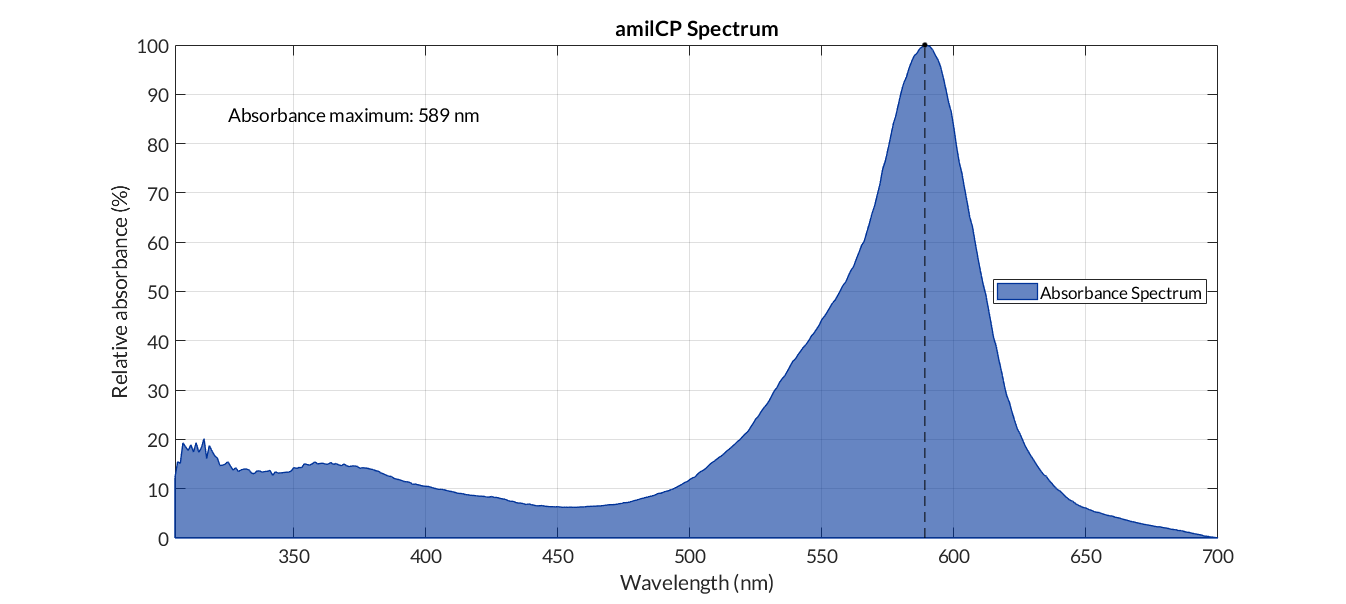
amilCP spectra
Finally, we have also obtained the spectra of the fluorescein molecule. These spectra have been used to correct the fluorescence data used in the Interlab Study to obtain the Relative Fluorescence Units (RFU) to Molecules of Equivalent Fluorochrome (MEFL) conversion factor. In addition, the comparison between GFP and sfGFP proteins RFU has been possible thanks to fluorescein spectra.
|
Parameters |
Value |
|---|---|
|
Number of samples |
6 samples. 3 samples of medium (LB or M9 medium) |
|
Temperature |
37 ºC |
|
Shake |
Double Orbital. 01:00 (MM:SS) |
|
Absorbance. Optical Density (OD) |
Wavelenght at 600 nm emission |
|
Emission range |
[495 - 580] nm |
|
Fixed excitation wavelength |
480 nm |
|
Excitation range |
[430 - 520] nm |
|
Fixed emission wavelength |
545 nm |
|
Gain (G) |
60 |
Experimental parameters

Fluorescein spectra
Comparison between sfGFP, GFP and YFP relative fluorescence intensity
Units of fluorescence data are one of the main problems during processing the results of experiments in SynBio projects. Unlike absorbance, where there is a simple conversion between Optical Density (OD) and cell number, there is no direct relationship between the Relative Units of Fluorescence (RFU) and the number of protein molecules in the cell. Moreover, RFUs vary among reporter fluoroproteins: for example, an RFU of the GFP protein does not have to be equivalent to an RFU of the mRFP protein, sfGFP, etc.
Thanks to initiatives such as the Interlab Study, we have been able to go a step further and obtain a MEFL/cellGFP factor for the equivalence between the RFU of the GFP protein and the Molecules of Equivalent Fluorochrome (MEFL). This relationship is an important breakthrough, as it can give us a more accurate estimation of the amount of GFP molecules in the cell.
However, another reporter protein have been widely used in Printeria experiments, such as the sfGFP or YFP. In the case of sfGFP, these protein has a much faster folding than GFP, which translates into a higher fluorescence intensity per molecule. And that's really interesting in the field of experimentation. In the case of YFP, the Wet lab Printeria team has realized that very little is known about this reporter protein, so it has been proposed in this project to get as much information as possible about YFP and its variants (check Printeria Improve). But in both cases, the equivalence factor between fluorescence and equivalent molecules is unknown.
Therefore, in order to obtain the MEFL/cellsfGFP and MEFL/cellYFP factors, the Printeria Modeling and Lab teams have designed a comparative experiment between GFP and both reporter proteins. The experiment consists of designing two identical transcriptional units (TU), changing only the CDS sequence so that each TU will produce GFP and our protein reporter (sfGFP or YFP), respectively. It should be added that this experiment is based on two fundamental assumptions:
-
The number of GFP molecules produced in the cells is equivalent to the number of MEFL.
-
Given two TU with identical promoters, RBS and terminators, but with different CDS, under the same experimental conditions, the number of molecules produced by each TU is the same.
Taking these axioms into account, the materials and procedure followed to calculate the MEFL/cell factors were as follows.
Materials:
-
Measuring equipment: Biotek Cytation3
-
96 well plate
-
MATLAB 2018a software
Procedure:
-
From the fluorescein spectrum, and the fluorescence data obtained from the Interlab Study experiment, we apply medium, gain and efficiency corrections .
-
The data are introduced in the Excel file of the Interlab Study. From the Fluorescein standard curve sheet we can obtain the MEFL/RFU factor, and then calculate the MEFL/cellGFP factor.

Parameters
Value
Culture volume (96 well plate)
200 μL
Cells per μL per OD unit
200 cells/OD μ L
MEFL/RFU factor
4,38.1010 MEFL/RFU
MEFL/cellGFP factor
273.7 MEFL OD/RFU cell
MEFL/cell factor calculation
-
We establish the protocol of the experiment and the parameters of our equipment. The experiment consists in the measurement of the absorbance and fluorescence of two TU with identical promoter, RBS and transcriptional terminator, but whose CDS codifies for GFP and our reporter protein. We have done two differente experiments with the same protocol, by using sfGFP TU and YFP TU. The most relevant information of the experiment is detailed in the following Table.
Parameters
Description
Time
06:00:00 (HH:MM:SS). Measurement interval: 05:00 (MM:SS)
Number of samples
8 samples for each TU. Total samples: 16
Temperature
37 ºC
Shake
Double Orbital Continuous
Absorbance. Optical Density (OD)
Wavelenght at 600 nm emission
Excitacion wavelength
485 nm
Emission wavelength
528 nm
Gain
60
Experimental parameters
-
The experiment is introduced into the equipment and the absorbance and fluorescence curves are obtained, as well as the curve of Fluorescence F/Absorbance OD or FOD ratio with the applied medium fluorescence correction.
-
The absorbance and fluorescence data are exported to an Excel file.
-
Running the MATLAB GFP_sfGFP_comparison.m and GFP_YFP_comparison.m script (for each experiment):
-
We extract the FOD data from the GFP and sfGFP from the Excel file.
-
We apply the gain and efficiency corrections of the spectrum to the FOD.
-
We plot the FOD curves and look for a stationary equilibrium time interval in the expression of the GFP and sfGFP proteins. In our experiment, we have decided to chose the interval [145 - 290] min for sfGFP experiment and [40 - 350] min for YFP experiment.
-
We obtain the average value of both regions.
-
We calculate the number of GFP equivalent molecules or MEFL by multiplying the FOD data by the MEFL/cellGFP factor.
-
If we assume that the number of molecules expressed by both TU in th experiment is the same, the number of MEFL for the calculated GFP is the same as the number of MEFL for the other reporter protein (sfGFP or YFP).
-
We calculate the MEFL/cellsfGFP and MEFL/cellYFP factors by dividing the MEFL number by the average FOD value of the sfGFP and YFP in the stationary region, respectively.
-

Comparison between fluorescence intensity of GFP and sfGFP reporter proteins

Comparison between fluorescence intensity of GFP and YFP reporter proteins
|
Reporter protein |
MEFL/cell factor (MEFL·OD/RFU·cell) |
|---|---|
|
GFP |
273.7 |
|
sfGFP |
121.4 |
|
YFP |
57.3 |
MEFL/cell factors calculated applying comparison protocol
With MEFL/cell factors, FOD data obtained in any experiment in which GFP, sfGFP or YFP are used as reporter proteins can be transformed into equivalent fluorescein molecules by applying the following ratio:

The new data give us more accurate estimation of the number of molecules in the cell. Consequently, by relating the experimental results with the theoretical mathematical models in the optimization process, the parameters of the model acquire values more consistent with their physical meaning. Also, we can work with equivalent molecules instead of using arbitrary units.