Team:XMU-China/Measurement


For our ABCD system, there are three parts in our Design, generally, namely Sensor, Amplifier and Reporter. However, to verify the feasibility of this system, we divided the whole ABCD system into four parts by flexibly utilizing the modular features of Synthetic Biology.
Part Ⅰ
First of all, the aptamer SYL3C [1] and its "complementary strand" must form a structure of double-strand, which is the basis of competition (see more details in our Design page). The electrophoretic behavior of ssDNA would be evidently different from that of dsDNA due to their different conformations. [2] On this basis, we used electrophoresis to prove that the SYL3C-C3 complex indeed formed (Figure 1, see more details in our Results page). The C3 strand is 10nt complementary to the SYL3C strand; however, we set controls of C4 strand (9nt complementary to the SYL3C strand) and SYL3C strand, noticing that C4 strand failed to form the complex but C3 strand succeeded, according with our expectations of modeling. (see more details in our Modeling page ).

Figure 1. The result of electrophoresis. W1: SYL3C. W2: C4 strand. W3: C3 strand. W4: C4 strand + SYL3C. W5: C3 strand + SYL3C.
Multiple verification: We've done the electrophoresis experiment for many times to make sure the SYL3C-C3 complex could form successfully. See more details in our Engineering page.
[Protocols]: Forming double strands
Part Ⅱ
It's also significant for the aptamer to bind its target because this is the propulsion of competition. It is worth mentioning that there are many ways to display these two molecules' binding and their affinity. [3] We failed to verify the binding by using ultrafiltration and flow cytometry previously, which was a really big obstacle for us during the whole process. Later, following Prof. Zhi Zhu's suggestion, we utilized an approach of fluorescence polarization to prove the binding between SYL3C and EpCAM successfully. According to the principle of fluorescence polarization, the FP value would depend directly on the effective molecular size of the fluorophore at a certain temperature and viscosity of the solution. The FP value of SYL3C-FAM was low at first because it was free in the system, (Figure 2.1) then high due to bind with EpCAM (Figure 2.2, see more details in our Results page).

Figure 2.1. The fluorescence intensity of SYL3C-FAM.

Figure 2.2. The fluorescence intensity of SYL3C-FAM after incubating with EpCAM.
Interestingly, we just had a fluorescence spectrometer (Figure 3) without related function of fluorescence polarization in our lab. So we added two polarizers from a pair of 3D glasses to the fluorescence spectrometer then completed the measurement from vertical and parallel direction successfully. We had to say it was a good modification of our instrument.

Figure 3. Fluorescence spectrometer (Shimadzu® RF-6000).
[Protocols]: SYL3C binding EpCAM
Part Ⅲ
Subsequently, to prove whether competition was feasible or not, the traditional fluorescence approach was used properly. The C3 strand was modified with a FITC label. If competition succeeded, it could verify that EpCAM squeeze out the C3 from SYL3C-C3 complex, and the fluorescence intensity of supernatant of "adding EpCAM" would show significant difference to that of "without EpCAM" (Figure 4, see more details in our Results page ). Setting the control of "without EpCAM" was essential for us because this control was as a "background" for the tests, especially those in our hardware and practical application in the future. We used a fluorescence spectrometer (Figure 3) to carry out the measuring task.

Figure 4. The result of competition.
[Protocols]: Competition
Part Ⅳ

Figure 5. The result of trans-cleavage activity of Cas12a.
Last but not least, the effectiveness of the amplifier and reporter of ABCD system is also quite essential (see more details in our Design page). A special short ssDNA of 21nt was used to activate the Cas12a protein which had been incubated with the corresponding crRNA in advance to form the RNP complex. After this, we set controls and made distributions by manipulating DNaseAlertTM Substrate Nuclease Detection System [4] (provided by IDT®) to test if the activity of trans-cleavage [5-6] of Cas12a was activated. Such a method was reported before to check DNase activity of Cas12a. [6] The microplate reader (Figure 6) was used to measure the fluorescence intensity due to continuous measurement over time, which meant that diverse measurement methods were involved appropriately and reliable in our experiments. A significant trend of increase of fluorescence intensity indicated a satisfying result that the activity was activated evidently (Figure 5, see more details in our Results page). We fitted our results with Gaussian method, furnishing a convincing best incubation time for the instruction of our hardware.

Figure 6. Microplate reader (Tecan Infinite® M200 Pro).
[Protocols]: Trans-cleavage activity of Cas12a
Integration
We also did the integrated experiment to verify our system. Starting with adding EpCAM, we extracted the supernatant after competition, then utilized this supernatant which contained C3 strand (without a FITC label) squeezed out by the EpCAM to activate Cas12a, whose effect could be checked by DNaseAlertTM Substrate Nuclease Detection System. The fluorescence intensity was measured by fluorescence spectrometer (Figure 3), just as what we did in Part Ⅳ. See more details in our Results page.
[Protocols]: Integrated experiment
Improvement
We tested the protein, EpCAM, bought from ACROBiosystem®, to see whether it had certain activity or not, using fluorescent antibody of EpCAM which could coat the Ni-beads to check the activity by flow cytometry test (Figure 7). The results demonstrated the EpCAM was active, so we could carry out the following experiments (Figure 8, see more details in our Results page).

Figure 7. Flow cytometer (BD FACSVerseTM).

| Name | Events | % Parent | % Grandparent | % Total | PE-A Mean | PE-A Geo Mean |
|---|---|---|---|---|---|---|
| ni-beads:P1 | 5,087 | 94.52 | *** | 94.52 | 108 | 82 |
| ni-beads+antiepcam:P1 | 5,208 | 91.45 | *** | 91.45 | 2,880 | 2,626 |
| EpCAM+Anti-EpCAM:P1 | 4,238 | 93.53 | *** | 93.53 | 14,816 | 14,211 |
Figure 8. The result of flow cytometry.
[Protocols]: Verifying the EpCAM's activity
It seemed too simple to verify whether the trans-cleavage of Cas12a was activated by directly using the DNaseAlertTM Substrate Nuclease Detection System. It's necessary to verify the system itself feasible to transfer the molecular signals to fluorescent signals. Then, directly exploiting DNase I for verification, we'd like to observe the change in fluorescence intensity in the presence of DNase I at certain time points or not. As we expected, the efficiency of DNase I was so high that the fluorescence intensity almost reached the maximum within 3 min. What's more, the results of two groups distinguished from each other significantly (Figure 9, see more details in our Results page). Likely, the fluorescence spectrometer (Figure 3) was involved in the measuring process again.
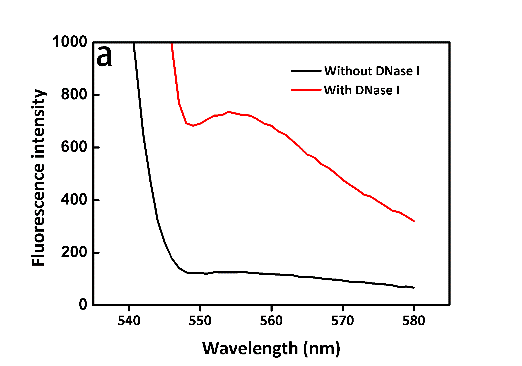


Figure 9. a) The result at 3 min. b) The result at 15 min. c) The result at 30 min.
Summary
In general, measuring fluorescence intensity occupied a majority of our measuring tasks. We've also done lots of experiments by attempting variable methods to verify each part (no matter succeeded or failed), especially the Part Ⅰ and Part Ⅱ. We carefully modified our protocols for the sake of making it useful and universal for different teams and their projects. And we were very cautious about setting controls in every experiment, which was necessary and critical for us in analyzing results we got.
References
[1] Yanling Song, Zhi Zhu, Yuan An, Weiting Zhang, Huimin Zhang, Dan Liu, Chundong Yu, Wei Duan, Chaoyong James Yang. Selection of DNA Aptamers against Epithelial Cell Adhesion Molecule for Cancer Cell Imaging and Circulating Tumor Cell Capture. Anal. Chem. 2013, 85: 4141-4149.
[2] Janet Iwasa, Wallace Marshall. Karp's Cell and Molecular Biology: Concepts and Experiments (8th ed.). Wiley: Hoboken, NJ. 2016, 719.
[3] Ge Yang, Qiang Wei, Xinying Zhao, Feng Qu. Research advances of aptamers selection for protein targets. Chinese Journal of Chromatography. 2016, 34: 370-381.
[4] https://static.igem.org/mediawiki/2018/4/4c/T--XMU-China--dnasealert-detection-manual.pdf
[5] Shiyuan Li, Qiuxiang Cheng, Jiakun Liu, Xiaoqun Nie, Guoping Zhao, Jin Wang. CRISPR-Cas12a has both cis- and trans-cleavage activities on single-stranded DNA. Cell Research. 2018, 28: 491-493.
[6] Janice S. Chen, Enbo Ma, Lucas B. Harrington, Maria Da Costa, Xinran Tian, Joel M. Palefsky, Jennifer A. Doudna. CRISPR-Cas12a target binding unleashes indiscriminate single-stranded DNase activity. Science. 2018, 360: 436-439.
HSFCM
We utilized high-sensitivity flow cytometer (HSFCM) built by Yan's lab to analyze our OMVs labeled with fluorescence proteins (Figure 1). [1] It has been reported that HSFCM could be a high throughput and multiaparameter instrument for single-OMV analysis. We detected the GFP positive or RFP positive OMVs from total OMVs isolated to evaluate the functions of our parts.

Figure 1. Schematic illustration of HSFCM. [1]
SDS-PAGE
We used SDS-PAGE to distinguish proteins secreted in both bacteria and OMVs (Figure 2). Because of limited time, we could neither purify our proteins nor further characterize them. We would finish these experiments in the future.

Figure 2. Schematic illustration of SDS-PAGE.
TEM
We isolated our OMVs and sent them to the NIDVD [2] to take pictures by TEM. We'd like to extend our heartfelt thanks toward Prof. Chen for his kind help.

Figure 3. Schematic illustration of TEM. [3]
References
[1] Tian Y, Ma L, Gong M, et al. Protein Profiling and Sizing of Extracellular Vesicles from Colorectal Cancer Patients via Flow Cytometry. Acs Nano. 2018, 12(1): 671-680.
[2] http://nidvd.xmu.edu.cn/
[3] https://en.wikipedia.org/wiki/Transmission_electron_microscopy
In order to verify the effectiveness of our TDP system, we validate SAHS and CAHS separately. CAHS is validated by validating the biological activity of preserved bacteria, and SAHS is validated by validating the biological activity of preserved proteins. In view of the principle of TDP proteins preserve biological activity, we all adopt freeze-drying method to ensure that TDP proteins play a role.
The following is each step of our experimental verification.
The validation of SAHS protein is divided into three steps. The first step is to verify whether it is abundantly expressed. The second step is to verify the purification effect of the protein. The final step is to verify the role of SAHS in preserving biological activity of proteins.
Verify the expression of SAHS protein
The expression level of SAHS protein and whether it was secreted out of the cell are detected by small-quantity identification. First, we cultured the single colony that we obtained, cultured to OD=1.0 and centrifugated. Then we took supernatants and bacterial precipitation separately, added SDS loading buffer, heated and boiled for 15 minutes, separated by SDS-PAGE, stained with Coomassie Brilliant Blue for 40 minutes, decolorized and observed the results.

Figure 1. The results of the expression of SAHS protein.
The results showed that our SAHS protein was not highly expressed in the supernatant, the possible reason is bacteria has cell walls. The purified protein could not be extracted abundantly from the supernatant, so we transfected SAHS gene into pET-28a plasmid and verified it by BL21.
Verify purification effect of SAHS protein
In the process of protein purification, we used nickel column chromatography and heat treatment, and combined the two methods, then carried out the verification by Protein SDS polyacrylamide gel electrophoresis. First, we verified the effect of nickel column chromatography purification and explored the temperature of heat treatment. We determined that the final heat treatment temperature was 85 ° C and the time was 15 min. Since the purification by a single method is not ideal, we have combined the two methods for purification. Finally, we tested two patterns, heating-Ni-NTA and Ni-NTA-heating, and found the latter one is better. The figure below is a gel map of our purified SAHS protein.
The following figure shows the gel of purified SAHS protein. (Figure 2, see more details in our Results).

Figure 2. The results of the purify of SAHS protein.
Verify the role of SAHS protein in preserving biological activity
In order to verify the preservation effect of SAHS protein, we tried verifying by lyophilization. First, we measured protein concentration at concentrations ranging from 0.3 g/L to 0.6 g/L via spectrophotometry (Multiskan GO 1510) and BCA assay. Then, we concentrated the purified protein to control the protein concentration to about 1 g/L.
We selected Taq enzyme as the protein preserved in our experiment. Preparing Taq into 100μ preservation system and freeze-drying (Advantage ES-53), dividing the samples into PBS group and ultrapure water group according to different lyophilization buffers. Setting up a series of concentration gradients of SAHS protein in each group, 1g/L, 0.5g/L, 0.1g/L, 0.01g/L and 0g/L respectively. After lyophilization, dry-preserving the system at room temperature for a certain period of time, then adding ultra-pure water for recovery. Using resuscitative Taq to do PCR test (T100 Thermal Cycles) and verifying the activity. The activity of Taq was judged by brightness of bands and weather there were correct bands.

Figure 3. The results of the role of SAHS protein in preserving biological activity.

Figure 4. Lyophilization (Advantage ES-53).

Figure 5. T100 Thermal Cycles 1861096.

Figure 6. spectrometer (Multiskan GO 1510).

Figure 7. Biorad imager (ChemiDoc MP).
Similarly, Cas12a protein was preserved and resuscitated in the same way. According to the instructions on the kit, the activity of Cas12a was judged by fluorescence intensity. (see more details from https://static.igem.org/mediawiki/2018/4/4c/T--XMU-China--dnasealert-detection-manual.pdf)
