Team:BIT/InterLab
<!DOCTYPE html>
Interlab
The goal of the iGEM InterLab Study is to improve the measurement tools available to both the iGEM community and the synthetic biology community as. In the previous studies, we showed that by measuring GFP expression in absolute fluorescence units calibrated against a known concentration of fluorescent molecule, we can greatly reduce the variability in measurements between labs. while measuring a population of cells ,the number of cells in the sample can lead to variability in the results.
So,the aim of the fifth InterLab study is trying to reduce lab-to-lab variability in fluorescence measurements by normalizing to absolute cell count or colony-forming units (CFUs) instead of OD.
We performed three calibration experiments and cell measurements, including flow cytometry.
Calibration 1: OD600 Reference point - LUDOX Protocol
Using LUDOX CL-X and H2O as point reference to obtain a conversion factor to transform the data later.The average of OD600 is 0.053;the correction factor (OD600/Abs600) is 3.761.
 Table1,OD600 Reference point
Calibration 2:Particle Standard Curve - Microsphere Protocol
Preparing a dilution series of monodisperse silica microspheres and measure the Abs 600 to abtain the particle standard curve.
 Figure1,Particle Standard Curve
 Figure2,Particle Standard Curve(log scale)
Calibration 3: Fluorescence standard curve - Fluorescein Protocol
Dilution serious of fluorescein were prepared in four replicates and measure the fluorescence in a 96 well plate,so the standard curve of fluorescence for fluorescein concentration is generated.
 Figure3,Fluorescein Standard Curve
 Figure4,Fluorescein Standard Curve(log scale)
Cell measurement
1.Using E. coli K-12 DH5-alpha to do the Cell measurement, detecting the Fluorescence and Abs600.
 Figure5,The workflow of cell measurement
Here is our experimental data:

Table2,The Fluorescence Raw Reading of 0 Hour

Table3,The Fluorescence Raw Reading of 6 Hour

Table4,The Abs Raw Reading of 0 Hour
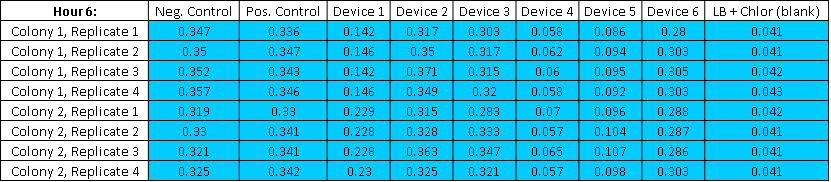
Table5,The Abs Raw Reading of 6 Hour
2.The measurement of Colony Forming Units per 0.1 OD600 E. coli cultures.
 Figure6,The workflow of Dilution Series
The following is our experimental data. Since we forgot to dilute the solution ten times at the end, only two diluents with concentration gradient are effective.

Table6,The number of colonies
Here are pictures of our E.coli culture:


Flow Cytometry
Here are some of our results:
 Figure7,The negative control
 Figure8,The positive control
The closer to the left, the less fluorescence The closer to the right, the more fluorescence
 Figure9,Resule of BBa_j364001
 Figure10,Result of BBa_j364002
For more results, click here
The following is a diagram of the parallel experimental results of the SpheroTech Rainbow calibration beads, and eight peaks can be clearly seen.
