Team:BIT/Model
<!DOCTYPE html>
Model
The modeling work is ahead of experimental work to provide the necessary guidance for the success of our subsequent experiments and is roughly divided into two parts. Part 1 aims to provide the theoretical basis for the proof of the sensing line and the verification of the inverse line. Based on the Hill equation and preliminary experimental data, we guarantee the input signal was further linear amplified by the ratio of green fluorescent signal. And Part 2 is designed for the proof of scheme 2. We construct the analog reaction line to verify the correctness of the experimental circuit as well as provide detection limits for the reaction. The final result shows that the gene line of scheme 1 feasible and gives the result prediction of scheme 1,2.
Assumption
In the modeling process, we made the following assumptions:
1)the promoter sequence unchanged after the inhibition of protein binding to the promoter.
2)the terminator can completely terminate the promoter.
3)when the inhibitory protein is absent, the promoter can stably express green fluorescent protein (GFP)
4)not considering the expression of the leakage of gene lines.
Part 1-1
The part 1 aims to give stable theoretical basis for scheme 1 as well as predict some of the experiment data of the first gene line.
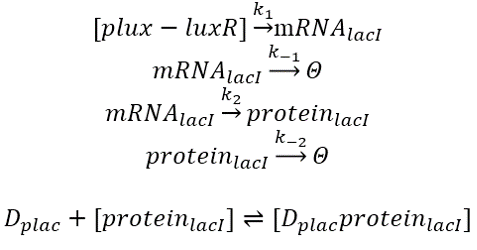
First, according to the gene figure of the above figure, the expression of the following genes and the equation of the degradation process can be obtained. Among them, k(1) is the rate of production of mRNA lacI, k(-1) is the degradation rate of mRNA lacI, k(2) is the rate of proteinlacI production, and k(-2) is the degradation rate of proteinlacI:
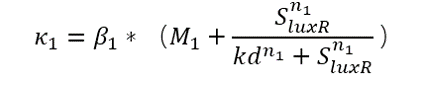
The Hill's equation was then used to construct a promoter expression formula. 11 is the maximum start-up ability of the promoter (generally set to 1), M1 is the amount of leakage of the promoter, SluxR is the amount of regulatory factor, and kd is the value of SluxR when the trend of the model changes:
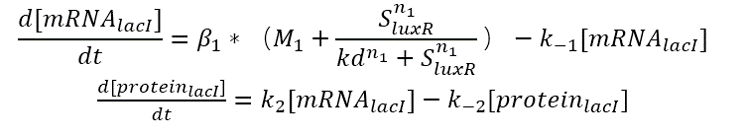
Finally, according to the differential equation, the expression transcription and degradation process of the whole gene are expressed:
According to our genetic map, the amount of proteinlacI can be approximated as the amount of proteinGFP (green fluorescence). therefore:
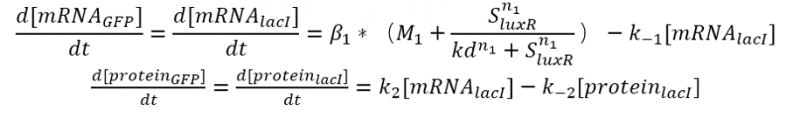
Among them, according to the database of igem official website, we can know the value of some parameters among them: the maximum starting ability of the promoter is β1=0.6; the leakage amount of the promoter is M1=0; n1=2. So we take these known parameters and put the values of kd equally spaced 50, 100, 150, 200, and draw a rough image:
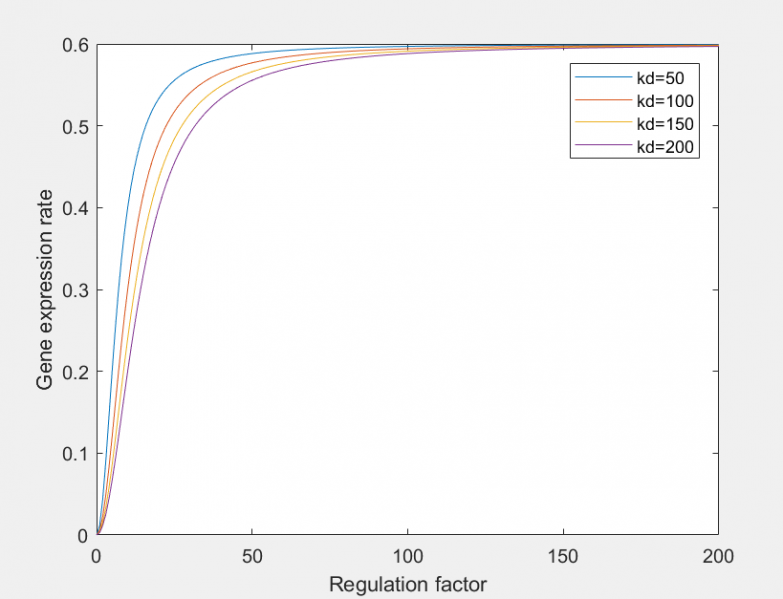 Figure 2 relationship between gene expression rate and regulation factor under different kd
From this differential equation, combined with the gene figure of the whole expression group, we can model the expression rate of green fluorescent protein, and obtain: the higher the concentration of SAM from the upstream, the higher the survival rate of E. coli, the fluorescence of GFP. The conclusion that the intensity will be greater. This is also consistent with the original intention of the expression group members to design this circuit diagram, which proves the feasibility of this genetic line.
Part 1-2
 Figure 3 inverse gene line of scheme 1
From this differential equation, combined with the gene figure of the whole expression group, we can model the expression rate of green fluorescent protein, and obtain: the higher the concentration of SAM from the upstream, the higher the survival rate of E. coli, the fluorescence of GFP. The conclusion that the intensity will be greater. This is also consistent with the original intention of the expression group members to design this circuit diagram, which proves the feasibility of this genetic line.
This gene line uses the combination of SAM and riboswitch to inhibit subsequent GFP expression. The content of SAM and GFP is inversely related.
Test data from the test of the SAM riboswitch is as follows:
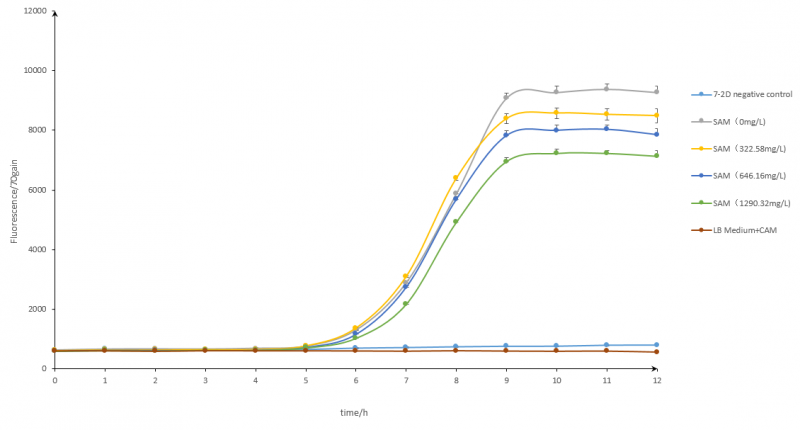 Figure 4 fluorescence under different concentration of SAM
We can get the inhibition of the riboswitch by SAM. Moreover, since the expression of GFP is controlled by the riboswitch, the expression of the final amount of fluorescence is affected. Here we use the function fitting form of a/(x+b)+c model to substitute the data measured in the previous stage, and then obtain the prediction relationship between SAM and fluorescence (as shown below).
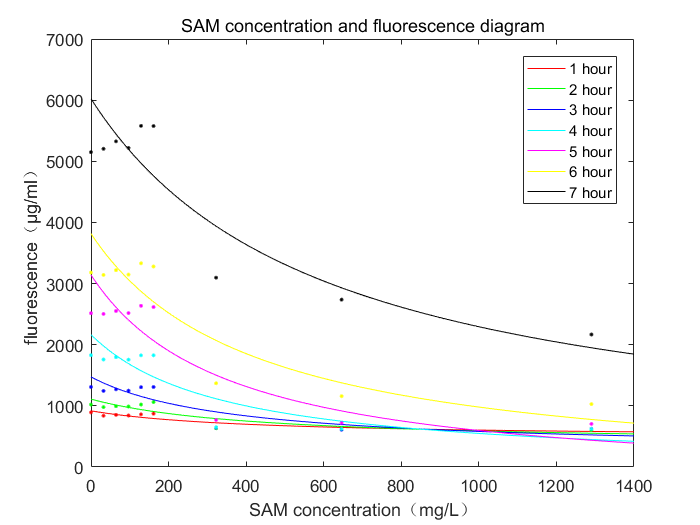 Figure 5 the relationship between fluorescence and SAM concentration
By observing the graph, we can conclude that the content of SAM is inversely proportional to the amount of fluorescence expressed, and during the reaction, the inhibition of SAM is gradually strengthened and finally stabilized. This verifies the feasibility of the experimental line 2 in principle. And through this data, we can calculate the final expression of green fluorescent protein content according to the content of SAM, and achieve the effect of predicting experimental results.
Conclusion
According to the modeling work of Part 1, we could guarantee that the feasibility verification of gene line. Based on the modeling of two parts, we can also get this conclusion: The input signal was further linear amplified by the ratio of green fluorescent signal. So we succeeded in part 1, providing theoretical basis for the expression group as well as providing theoretical support for the purpose of our team's final testing. Further, we provide the necessary guidance for the success of their subsequent experiments.
Part 2
The second part of the modeling mainly uses the construction simulation gene lines of scheme 2. The concentration of the reaction chain is changed under the condition of constant protein concentration, and the concentration of the product and the reactants are finally determined by the intermediate product and the reaction coefficient. This chart is ultimately used as a function of the overall response to time and applied.
Based on the Michaelis-Menten equation, we constructed the competitive experimental route of the second scheme. The amount of the protein was fixed and the amount of the reaction chain was changed to determine the relationship between the target product and the target product. The relationship between the target product and the reaction chain under different reaction conditions was determined by limiting the reaction constants of the two steps of the reaction.
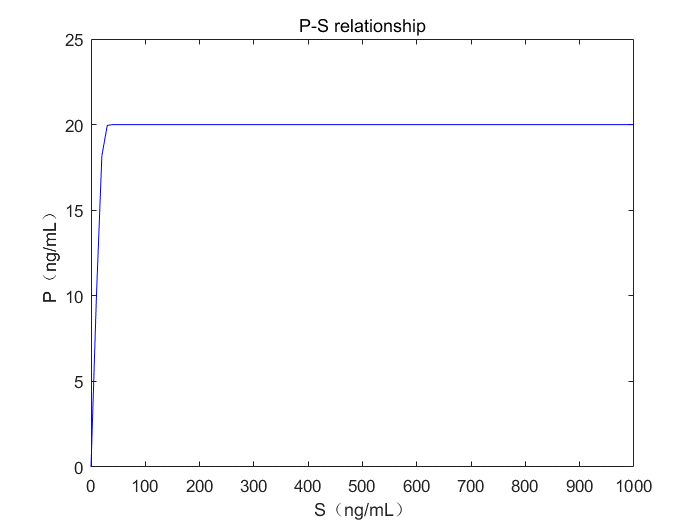 Figure 6 the relationship between reaction chain and the target product
Given more time, we could make this piece of result play a bigger role among the whole project. Since we have got the relationship between the product and reactant, the next step is to give predictions of the following experiments including the amount of GFP, etc.
Conclusion
According to the modeling work of Part 2, we could get the conclusion that the gene line of scheme 2 is feasible, while also we can get a relationship between product and reactant. Furthermore, we give mathematical proof of gene line of scheme 2, provide a stable theoretical basis for the lab group. If given more time in the future, we can also get a precise relationship between the product we add and theoretical values for subsequent experiments.
