Template:Groningen/Results

Achievements
  - Enzymatic degradation of cellulose, phosphorylated cellulose and Recell.

  - Growth of Saccharomyces cerevisiae on 1-4 beta linked glucose in the form of cellobiose.

  - Conversion of phenylalanine to trans-cinnamate using PAL2.

  - Styrene production from glucose using S. cerevisiae.
- Growth of Saccharomyces cerevisiae on 1-4 beta linked glucose in the form of cellobiose.
- Conversion of phenylalanine to trans-cinnamate using PAL2.
- Styrene production from glucose using S. cerevisiae.
Our EGII can degrade cellulose and pretreatments are effective
As raw cellulose sources such as ReCell do not have high solubility in aqueous solutions, the strands are difficult to access for our enzymes. Therefore, we investigated different methods of cellulose pretreatment [B]. We compared enzymatic degradation of pure ReCell, ball-milled ReCell, pure cellulose and phosphorylated pure cellulose. On these cellulose sources, we tested three purchased enzyme analogs of the cellulases used in our design: CBHI from Trichoderma sp., EGII from Aspergillus niger (EGA) and BGLI from A. niger. In a follow-up assay we furthermore tested our own purified EGII from Trichoderma reesei (EGII), which was expressed in E. coli and isolated using his-tag purification. (insert image western blot with ladder). As a positive control, we used a purchased cellulose enzyme blend containing a mixture of cellulases.
The cellulase activity assay we used will give a pink color as output in case the cellulase was successful in cellulose degradation [Y]. Cellulases produce hydrolysis products. Because of a two-step reaction with oxidases in the cellulase activity assay mix, a chromogenic substrate will be converted and give a colorimetric pink signal. The intensity of the pink color is proportional to the amount of hydrolytic product and therefore cellulase activity (read more about the assay here).
In the first experiment, we incubated the three purchased cellulases separately and in a mix (representing the cellulosome mixture) with the different cellulose sources; in this manner we investigate which pretreatments would enhance the enzymatic degradation. Overnight incubation of the cellulases and cellulose resulted in the chromogenic pattern as can be seen below. The positive control contains such large amounts of cellulases that it becomes pink under all conditions tested (it is brownish because the blend has a brown color). Out of the types of cellulose tested phosphorylated cellulose shows the most degradation, especially by CBHI. Pure cellulose and ball-milled ReCell can be degraded as well, but this requires more time than degrading phosphorylated pure cellulose. Unprocessed ReCell is not visibly degraded under the conditions tested here. The mix of the three enzymes was just as effective as CBHI, but degradation of this mix is likely mostly due to CBHI, since EGA and BGLI did not show visible activity alone under these conditions.

EGA, CBHI and BGLI were added in the same concentrations, but CBHI showed much higher enzyme activity. Therefore, it can be suggested to alter the expression ratio of the cellulosome enzymes, for example by the use of different promoters, to obtain synergistic activity levels. Follow-up experiments should determine an optimal ratio of the three enzymes, perhaps while bound to a recombinantly expressed scaffold molecule. Phosphorylated cellulose was degraded more efficiently than ball-milled ReCell, however, the process does require more harmful chemicals than ball-milling. Therefore, our bioreactor design applies ball-milling instead of phosphorylation.
In a following assay we tested the endoglucanases specifically. We compared our own purified EGII with the purchased EGA, on the same cellulose substrates used in the assay above. We tested undiluted EGII, EGA in approximately the same concentration, and 1:1000 EGII and 1:10.000 diluted EGII to estimate the enzyme activity.

Again, we see degradation by the positive control on all substrates. However, the purchased EGA enzyme did not show much activity. Our undiluted purified EGII did show activity on all substrates except for unprocessed ReCell. This is surprising, because we expected that the purchased EGA contains more enzyme units than our EGII and as such should have a higher activity. The results show that our own cellulase has cellulolytic activity and highlight the fact that preprocessing of cellulose or ReCell for enzymatic processes is highly beneficial for the degradation process.
S. cerevisiae strain containing artificial cellulosome can grow on cellobiose
In order to demonstrate that our strain S. cerevisiae BJ1991 expressing the cellulosome (BJ1991+) is able to degrade cellulose and grow, a growth assay is performed. Because long strands of cellulose are poorly soluble, a growth assay is performed on cellobiose. Cellobiose is a glucose dimer, in essence the shortest glucose polymer and form of cellulose. Cells are grown on fructose induced with galactose for 6 hours, after which the cells are pelleted, washed and transferred to medium containing cellobiose. The strains are loaded in a plate reader with different starting OD600s, and measured over a 24 hour timespan.

As shown in figure 3, the BJ1991+ strains are able to grow on cellobiose after 6 hours of galactose induction. Strains with a higher starting OD600 grow faster, and reach a higher OD600 before plateauing. The positive control, containing an additional 0.5% glucose, shows the most growth, and the negative control (wildtype strain) shows no growth. The induced strain without cellobiose also does not show any growth, indicating that residual galactose is not responsible for growth. The uninduced strain with cellobiose does show a little bit of growth, although much less than the induced strains. This is likely caused by leakage of the promoter.

We also compared growth with different galactose induction times. As shown in figure 4, samples with equal starting OD600 show faster growth when the galactose induction time is longer. The strain induced for 6 hours grows approximately 2 times faster than the strain induced for 2 hours. To obtain even higher growth rates longer induction can be used, as induction for longer than 6 hours has not been tested.
We also tried growing our strain on cellulose and phosphorylated cellulose, but were unsuccessful. However, longer growing times and constitutive expression of our system could enable this. Additionally, the degree of phosphorylation of the phosphorylated cellulose was not fully characterized and may have failed.
Styrene Detection with RP-HPLC UV DAD
After testing PAL2 in E. coli, we tested styrene production in YPH499 with PAL2 we used RP-HPLC UV DAD. A test run gave us the elution conditions and retention time of styrene. This resulted in the following HPLC method for styrene detection: using a gradient of methanol and ddH2O with 30% methanol at the start to 100% methanol over 45 minutes. The retention time of styrene under these conditions is 17,5 min. The strains were grown for two days on 2% glucose and styrene production was boosted with 0,5 g/L phenylalanine (L-phenylalanine). Four different cultures were prepared: a control with phenylalanine (Ctrl), a strain containing PAL2 with phenylalanine (PAL2+), a strain containing PAL2 without phenylalanine (PAL2-) and a strain containing both PAL2 and the cellulosome with phenylalanine (PAL2++). After incubation, the cell culture was centrifuged and the supernatant was loaded onto the column.

As can be seen in (Figure 5) a peak is observed at the retention time of 17,5 min, indicating production of styrene by our cells. Another peak can be observed at 10 minutes retention time. As this peak is not present in the control sample, we hypothesize this is trans-cinnamate. To test this we ran trans-cinnamate on the HPLC system, which indeed showed a peak at the same retention time. The trans-cinnamate peak is considerably larger than the styrene peak. We hypothesize this data indicates that the conversion from trans-cinnamate to styrene by FDC1 is limiting under these conditions.
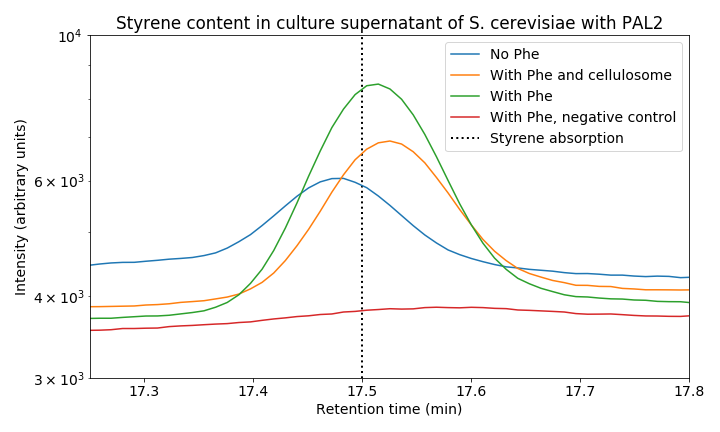
When we zoom in on the styrene peak we can see differences between the tested strains (Figure 6). There is a clear difference between all three PAL2 containing strains compared to the control, indicating successful production of styrene. Both our consolidated bioprocessing strain and our PAL2 containing strain are able to produce styrene. Comparing PAL2 and PAL2+ shows that addition of phenylalanine is not necessary for styrene production; however, it does boosts styrene production indicating that phenylalanine production might be a bottleneck for styrene production. In the table below, an approximation of the produced quantity of styrene can be seen. These results show we have successfully produced styrene in yeast from glucose. We have tried producing styrene from cellobiose, but were unsuccessful. This was likely due to low titer and could be remedied by increasing the incubation time.
Table 1: Approximation of styrene production per dry weight cells. Method of calculation can be seen here. Peak area is corrected using a negative control. The OD600 of PAL++ was lower than expected for unknown reasons, which gives an inflated image of the amount of styrene produced by this strain.
| OD600 | Peak area (arbitrary units) | styrene/Dryweight cells (ug/mg) | |
|---|---|---|---|
| PAL2 | 4.2 | 17887 | 3.773894298 |
| PAL2+ | 2.41 | 35929 | 13.21081475 |
| PAL2++ | 0.38 | 23768 | 55.4256197 |