Team:Georgia State/InterLab
Interlab
Trial 1
Names: Rehmat, Christina, Laura, Lynda, Gloria
Dates: 5/29/18-6/1/18
Trial 2
Names: Rehmat, Christina, Yash, Julia
Dates: 6/7/18-6/8/18
At the beginning of this year’s competition an Interlab has been requested to be performed by the iGEM Measurement Committee. Each team had to complete a study and collect data with a given protocol, as well as given supplies such as a LUDOX- CL (colloidal silica suspension), silica beads (microsphere suspension), and the fluorescein protein. The highlight of this Interlab study was to measure the absorbance and fluorescence of a protein called fluorescein as well as using plate readers. The Interlab was divided into three main parts : (1) Calibration protocols, (2) Cell measurements protocol and (3) Calculations of Colony Forming Units (CFU) of E.coli. The goal was to obtain three types of measurements: an OD600 reference point, a particle standard curve and a fluorescein standard curve. Another goal was to be in the exact same conditions as if we were doing our project, to make the calibration valid (same volumes, same plates, temperature, settings, etc..). First, the calibration protocols were performed. The use of microsphere suspension or silica beads was to mimic the cells used in the lab since their size and characteristics were similar. However, since they were given, their amount per volume were known, which helped in the calculation of Abs600. Then the calculation would help determine the concentration of cells, and from the concentration of particles (from the standard curve created), an estimated number of cells was determined. The use of fluorescein was to mimic GFP, however GFP is costly and considerably unstable, so fluorescein was used instead. Fluorescein has similarities with GFP as it has the same emission and excitation properties. The purpose of this measurement was to calibrate the output of fluorescence between the instruments of every teams. With this measurement a standard curve of fluorescein concentration was obtained. Next, the cell measurements were performed. Each team was required to use E.coli K-12 DSH alpha for consistency and reproducibility purposes. The protocol was followed as given by the iGEM Measurement Committee from transformation of the E.coli cells to the pipetting of the colonies in the plate reader. Last, calculating the CFU was the final step of interlab. CFU counts are an indication of the concentration of cells in per mL. The protocol was followed and cells were counted accordingly (See Figure 5).
Our Data
According to Figure 1 and Figure 2, which gave the particle curve for both trials respectively, the first trial gave the best results. This is due to the trend observed in the curve for Figure 1, it is linear, as opposed to Figure 2. A linear trend indicates that as the number of particles (particle count) increases, the absorbance increases too. This makes sense because the higher the number of particles present, the more they should emit, and the more light should be absorbed. A linear trend is a good indication, and it is an expected result. Figure 2, show a somewhat linear trend, because the curve is not straight enough and it flattens between 0.200 and 0.300 Absorbance at 600 nm. This flat part of the curve, is not a good indication, according to the expected results.
In Figure 3 and 4, the fluorescein standard curve is shown for both trials respectively, as well. Figure 3, shows a linear trend between the fluorescein concentration and the fluorescence. The fluorescence indicates the amount of protein present, through the light emitted by fluorescein . So, a linear trend means that as the fluorescein concentration increases the fluorescence increases as well. This is a good indication, and it is an expected result as well, because the more fluorescein is present, the more light will be emitted, hence the fluorescence would be higher. Figure 4, shows a line that is flat at first, then dramatically increases. This finding is inconsistent with the expected results, since the fluorescein concentration was always increasing. So, the fluorescence should have been increasing as well.
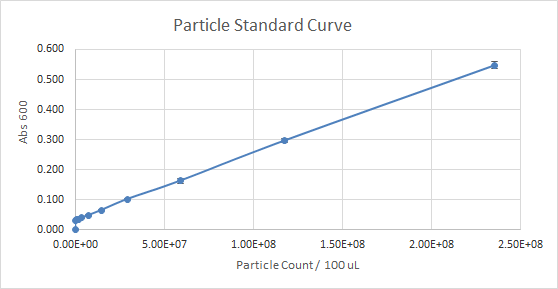
Figure 1 — Particle Standard Curve, Trial 1
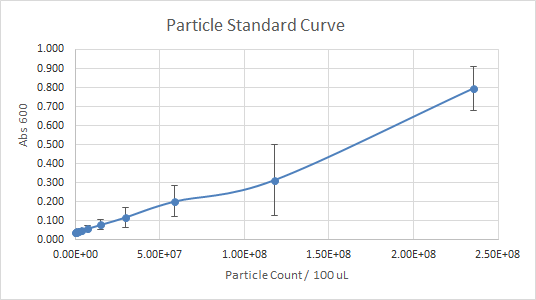
Figure 2 — Particle Standard Curve, Trial 2
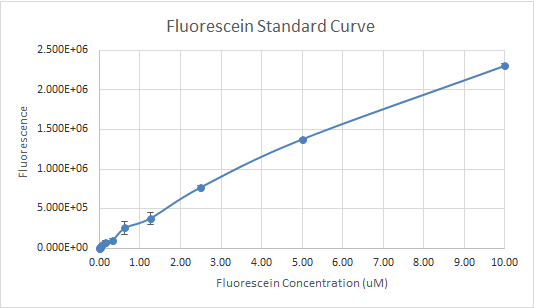
Figure 3 — Fluorescein Standard Curve, Trial 1
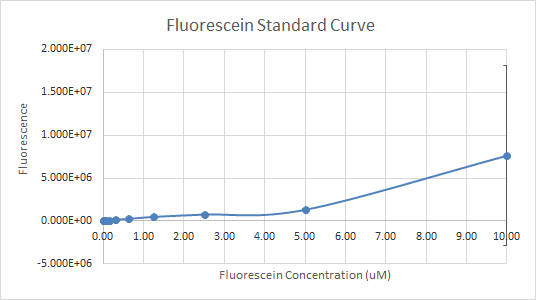
Figure 4 — Fluorescein Standard Curve, Trial 2
For the interlab, the data of the first trial, according to Figures 1 and 3 was much more reliable than the data of the second trial (Figures 2 and 4). So, the more reliable data, should be used as a reference. Overall, our experience with Interlab was a good one. Everything ran smoothly because we created a 4 day plan that enabled us to get everything done profficently and effectively. The first trial was performed by students that had more experience with lab procedures relating to the interlab. The second trial was performed by students with little to no experience in the lab. Both trials had results that were useful and good enough to submit because the standard curve in each experiment done wasn’t too far off. However, the standard curves for trial 1 were significantly better than trial 2. The numbers in the table for serial dilutions made more “sense”. Perhaps, if we performed both trials with the same number of experienced students as the first trial our results for trial 2 could’ve been better not worse. In addition, we learned that students who had a better grasp of what interlab was, and why we were doing the protocol outlined, were more beneficial and performed the lab protocol accurately.
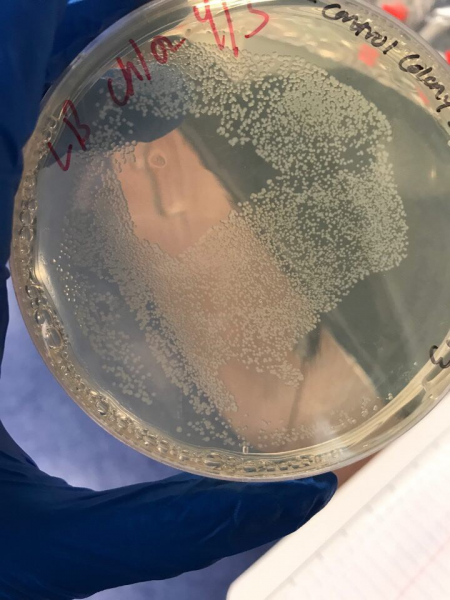
Figure 5 — Plates with colonies of the culture made to take the fluorescence measurements.

“ The Interlab experience was good, it felt like a little warm up before really starting the project. It was very detailed and involved some new techniques that I did not see before, such as using the plate reader. But the new techniques were pretty easy to catch on. Doing serial dilutions was included multiple times and it was a good way to review, and practice again. Also, we did not get to use the actual GFP, but we got to use fluorescein which is a protein that mimics GFP, and that was amazing. I was there only for the first part of Interlab, and we did not get the results that we wanted but, the second time around, the results, were worse, according to my teammates. At first, Interlab sounded kind of tedious but understanding and learning the reason behind it, made it easier. Also, Interlab helps to put all of the teams on the same page, which is nice, especially, when testing new technology or a particular strain of E.coli. Sharing our results with other teams would be very beneficial since we are all part of the competition. Let say if there is a deficient protein that we are all testing and we all get inconsistent results, then it can indicate that something is wrong either with the methodology (protocol) or the protein, and that is what makes it fair for every team. Last, I think that Interlab foster collaborations between teams, and we can always learn from one another. ” —Lynda Waku Kouomou