Team:Edinburgh UG/InterLab
InterLab
Introduction
Accurate and reproducible measurements are essential to all science and this is no different in Synthetic Biology. The comparison of fluorescence and/or optical density data remains a big challenge as measurements that are taken in different labs vaires hugely. We were delighted to participate in an InterLab study with iGEM teams around all over the world with the goal of determining the accuracy of GFP fluorescence data of some particular test devices. The main issue that iGEM InterLab 2018 addressed was whether can we reduce lab-to-lab variability in fluorescence measurements by normalizing to absolute cell count or colony-forming units (CFUs) instead of OD. This year we characterized eight plasmids (BBa_R0040, BBa_I20270, BBa_J364000, BBa_J364001, BBa_J364002, BBa_J364007, BBa_J364008, BBa_J364009) by following the iGEM InterLab 2018 protocol provided.
Materials and Methods
DHT5 alpha strain was obtained by collaboration with Edinburgh Overgraduate iGEM team. Then, everything was done by following iGEM interlab protocol. Lab notebook with all time points and deviations from the protocol can be found here.
Results
Calibration
OD600 Reference Point
Absorbance of 0.051 of LUDOX CL-X was obtained with standard deviation of 0.005 while double distilled water had all four replicates at the same value of 0.034, implying that both measurements were done precisely.
Particle Standard Curve
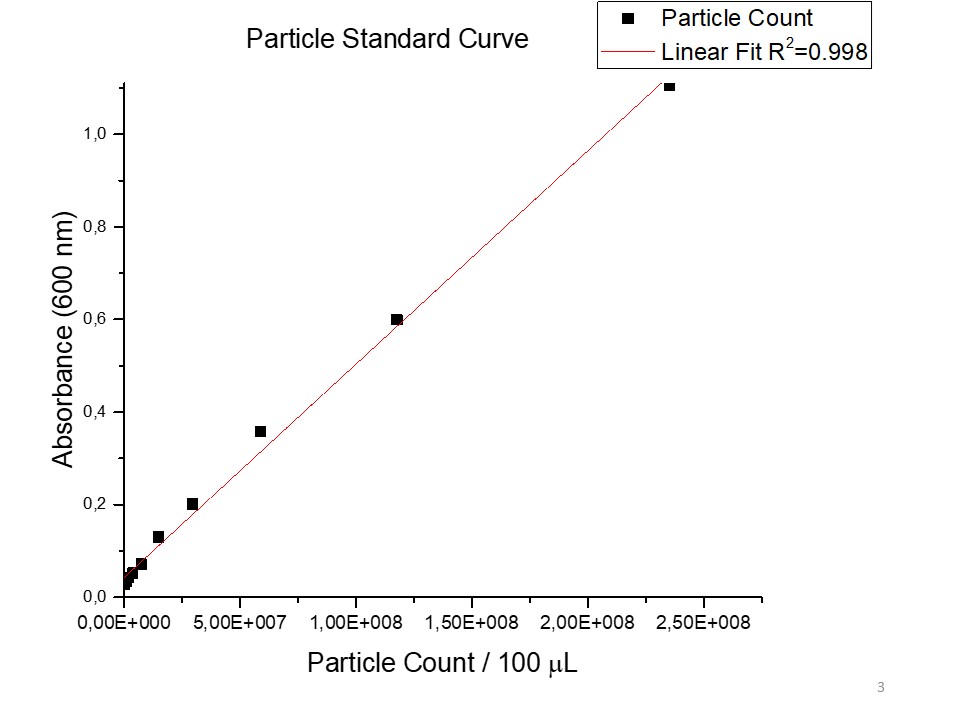
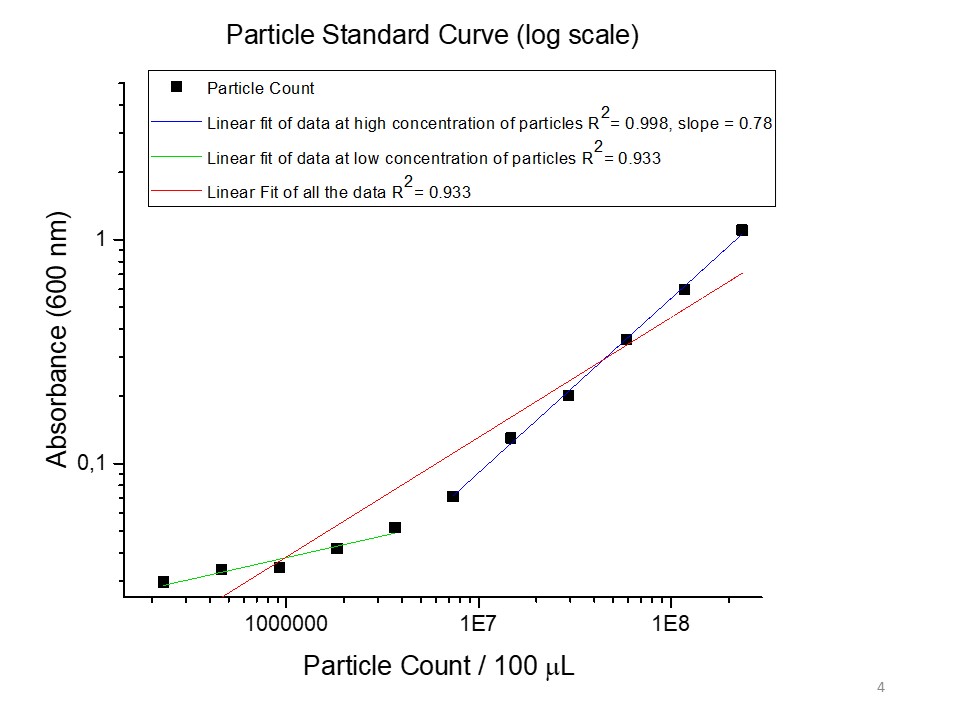
Particle standard curve was obtained with R2 value of 0.998 (Figure 1). However, logarithmic scale graph (Figure 2) represented less accurate measurement than linear curve (R2=0.993, red line), as linear graph was obtained only in high concentration of particles. Not very high precision may be due to the low absorbance values that is not in a plate reader range or when the absorbance is less than 0.1. Analysing the calibration curve in higher concentrations only, linear fit represented high accuracy in logarithmic scale with R2=0.998.
Fluoresence Standard Curve
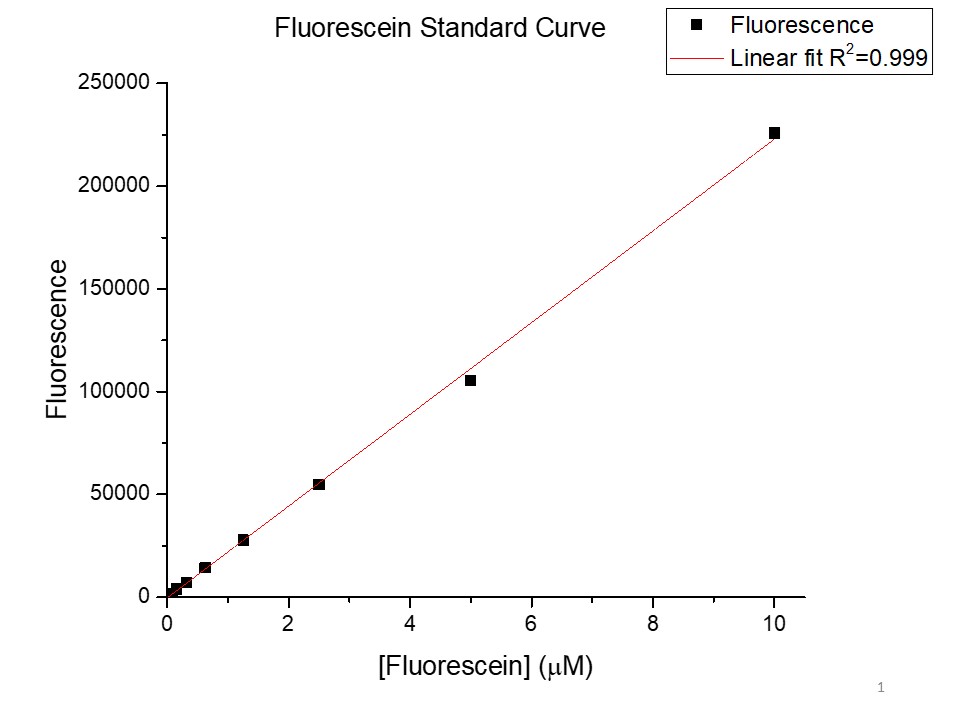
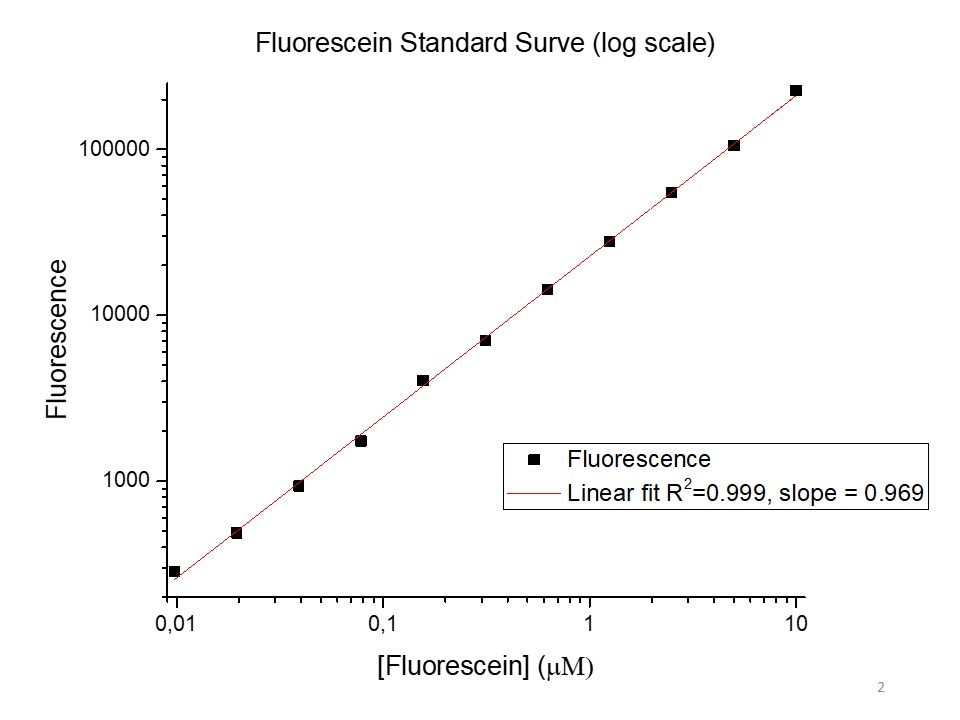
Fluoresence measurement may be considered as accurate as the data in both graphs (Figure 3 and Figure 4 for logarithmic scale) fit to a line with a value of R2 very close to 1. The slope on logarithmic scale is very close to 1 as well (slope = 0.969, Figure 4) which suggest that the data is considerably good.
Cell Measurement
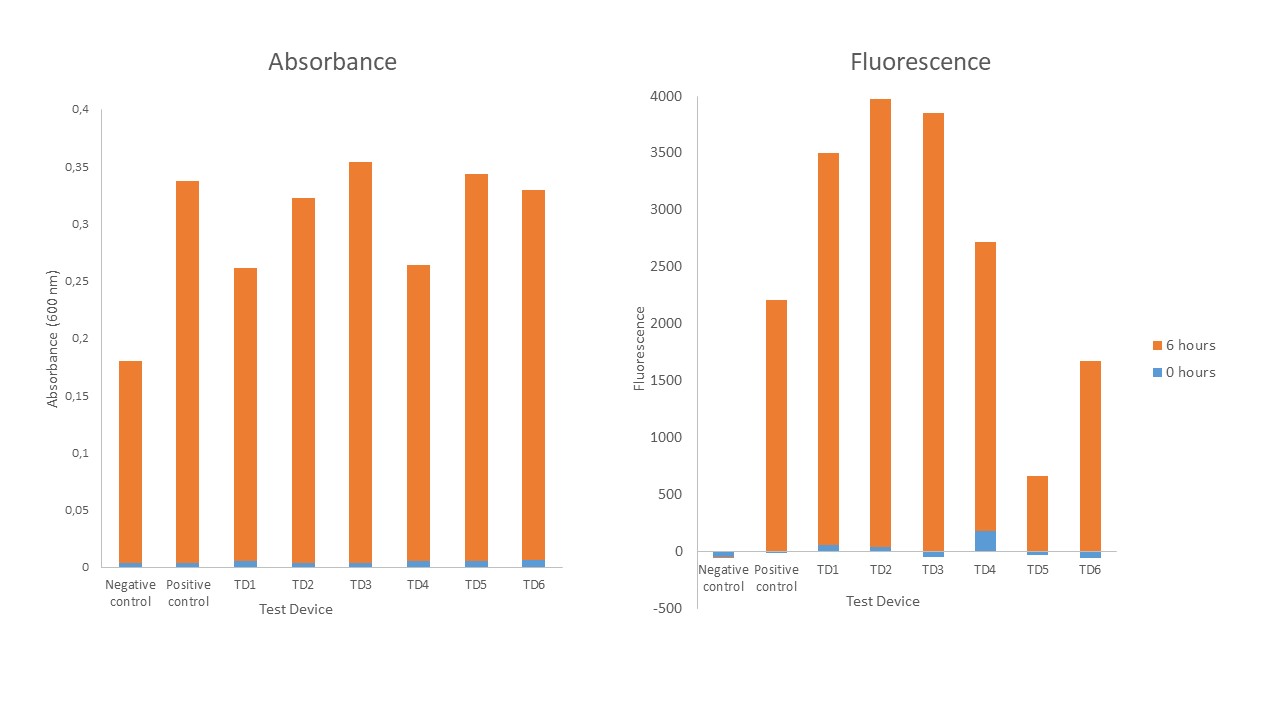
Absorbance and fluorescence measurement using a plate reader
As the absorbance increased in time in all devices and both (positive and negative) controls (Figure 5), it suggests that cells grew in all devices during 6 hours time period, indicating that negative control grew slowest, then TD1 and TD4 grew slightly faster, while all the other devices were similar in the speed of growth. There is no significant relation between cells growth and fluorescence as an order of increasing absorbance or fluorescence varies among different test devices. As expected, negative control has no significant fluorescence. Least measurement of fluorescence was obtained in Test Device 4 and highest was obtained in Test Device 2.
Colony forming units
No correlation was observed among colony forming units (CFU) and absorption as only in the highest dilution factor (8 *108) concentration of the overnight cultures was countable (less than 300 colonies formed).
Attributions
We are very grateful to Dr Martin Waterfall, Head of Flow Cytometry, Institute of Immunology & Infection Research at the University of Edinburgh, for teaching of the use and showing how the work is conducted with flow cytometer apparatus and also, for performing flow cytometry measurement for our InterLab study.
Contact EdiGEM18
Feel free to leave us a comment on social media!