Team:OLS Canmore Canada/Model


Project 
Parts 
Safety 
Practices - Overview
- Public
Engagement - Accessible iGEM
Human Practices

Team
MODELLING
Modelling
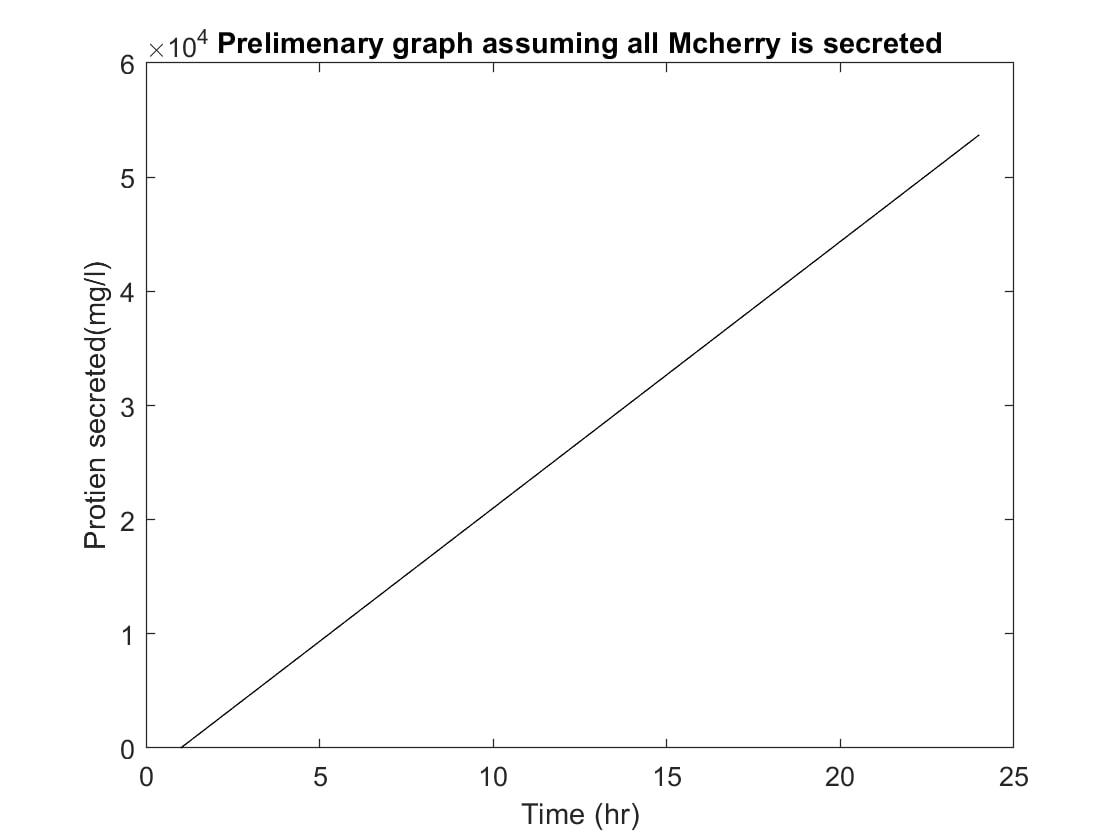 |
| Figure-1 (click to see full resolution) |
When examining our project, we need to consider how long it will take for the proteins to secrete out of the chassis organism. This is where our basic models come into play. We used these models to determine approximately how much of the protein our bacteria would be able to produce over any given 24 hour period. We began this process by researching how long, on average, it may take one of our Bacillus subtilis bacteria to produce and secrete this protein. With our results, we continued on further, creating a graph (Figure- 1) portraying this data.The first graph (Figure-1) was based on the assumption that all of the protein created inside of the cell in a 24 hour period would then also be completely secreted by cell. This was done to get an average baseline, which might then be used later as a way to determine if the data graphed later on still followed the same general linear path so that we may be able to see approximations and identify clear outliers.
 |
| Figure-2 (click to see full resolution) |
This creates the graph that you see as Figure-1. That is obviously not the case, as no bacteria is able to secrete 100% of all its protein. The next graph is a graph based on the assumption that not all the protein will be secreted and allows for an approximation of about a 10e^3 for each hour mark, as seen in figure-2. After that the next logical step, of course, was to run the test multiple times. This will yield a more accurate result in hopes to get a more precise representation of protein yield. As you can see, we are able to generate a result which closely matches that of our control line above. However, it is clear that through our calculations, some major outliers were found and marked in a different colour than black in our figure-3 graph.
 |
| Figure-3 (click to see full resolution) |