| Line 132: | Line 132: | ||
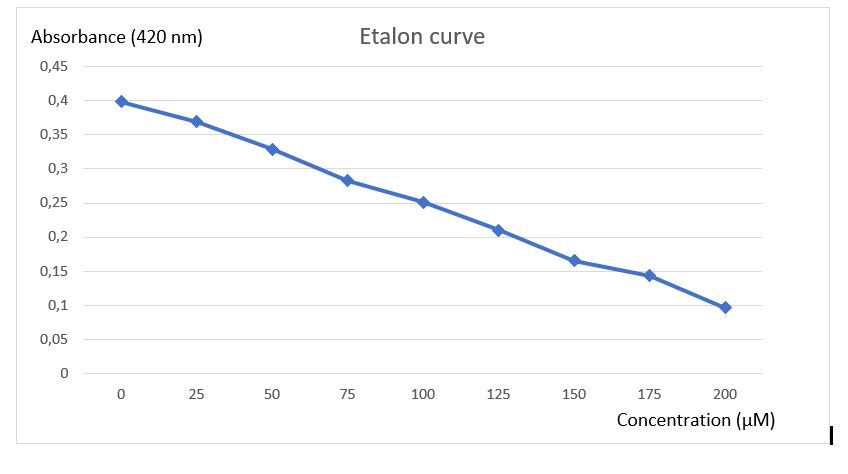
| − | To analyse activity test | + | To analyse activity test results, an etalon curve have been done using the final product of chitinase reaction (N-acetyl-G-glucosamine), to know in which concentration of final product must be obtained after reaction to be detected by the method of Schales. A final curve has been obtain showing that |
[[File:T--Aix-Marseille--ChitinaseResults3.jpg|600px|center|]] | [[File:T--Aix-Marseille--ChitinaseResults3.jpg|600px|center|]] | ||
Figure 3: Etalon curve of N-acetyl-G-glucosamine after Schales's activity test. | Figure 3: Etalon curve of N-acetyl-G-glucosamine after Schales's activity test. | ||
Revision as of 12:57, 14 October 2018
{{{title}}}
Results
Here you can describe the results of your project and your future plans.
What should this page contain?
- Clearly and objectively describe the results of your work.
- Future plans for the project.
- Considerations for replicating the experiments.
Describe what your results mean
- Interpretation of the results obtained during your project. Don't just show a plot/figure/graph/other, tell us what you think the data means. This is an important part of your project that the judges will look for.
- Show data, but remember all measurement and characterization data must be on part pages in the Registry.
- Consider including an analysis summary section to discuss what your results mean. Judges like to read what you think your data means, beyond all the data you have acquired during your project.
Project Achievements
You can also include a list of bullet points (and links) of the successes and failures you have had over your summer. It is a quick reference page for the judges to see what you achieved during your summer.
- A list of linked bullet points of the successful results during your project
- A list of linked bullet points of the unsuccessful results during your project. This is about being scientifically honest. If you worked on an area for a long time with no success, tell us so we know where you put your effort.
Inspiration
See how other teams presented their results.
Contents
Results
Chitinase production:
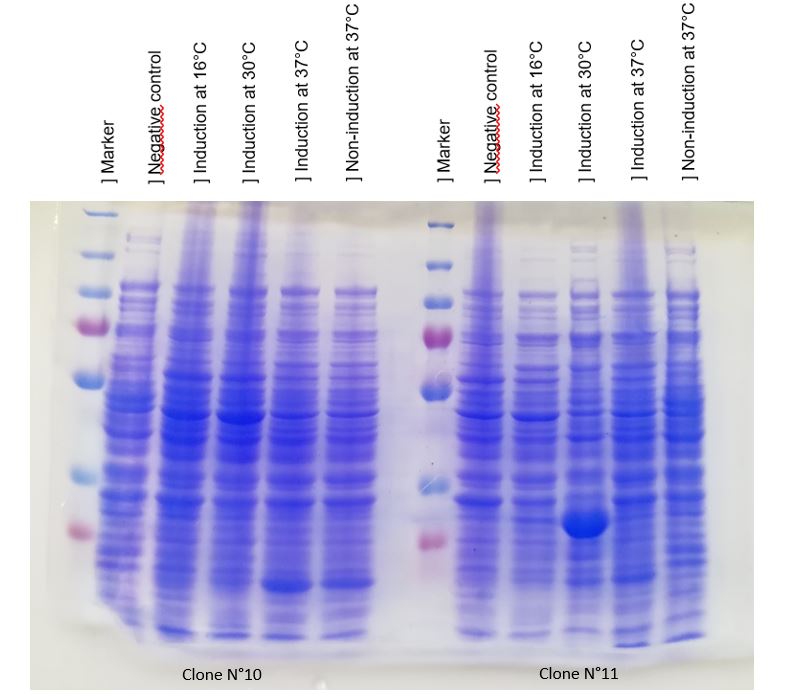
We achieve to produce chitinase thanks to our construction. An inducible overproduction by pLac promoter was used to study chitinase production, induction or none-induction experiments by IPTG can show the presence of the protein. We choose to produce chitinase by E. coli K-12 DH5-alpha strain and by BL21 strain. For this two strains two differents recombinated plasmids with chit1 were tested, plasmid N°10 and N°11.
Figure 1: Figure 1: SDS-PAGE of chitinase produced by E. coli K-12 DH5-alpha.
As seen in Figure 1, a protein at the expected lenght (30 kDa) was overproduced only at 30°C after IPTG induction in DH5alpha. The non-induction by IPTG show an low band of the protein overproduced. This overproduction should be the chitinase, but it isn't normal that clone N°11 wasn't able to produced at least a significant chitinase quantity at 16°C and 37°C. We clarified that thanks to a western blot, to be sure of chitinase expression by clone N°11.
Chitinase output are better after IPTG induction at 30°C. This condition of culture will be used to produce in large quantity chitinase for purification and activity tests.
Chitinase purification:
Figure 2: SDS-PAGE of polyhistidine-tagged chitinase purification produced by E. coli K-12 DH5-alpha, using a nickel-nitrilotriacetic acid matrix.
Showed in figure 2, a protein at 30 kDa corresponding at the chitinase is obtain on bacteria lysate, on the non-purified fraction and on fraction N°6 to fraction N°10. This fractions can be pooled and used for activity tests.
Numerous controls has been done,chitinase was produced without its peptide signal of secretion, so it will be contained in the cytoplasm, the absence of the band at 30 kDa in the pellet verify that chitinase wasn't contained in the membrane.
Bacteria lysate confirmed the presence of chitinase at 30kDa; non-purified migration show a low quantity of chitinase with all proteins contaminants; break-though sample didn't contain the protein target demonstrating that all chitinase was fixed on nickel-nitrilotriacetic acid matrix.
The results of chitinase purification prove that chitinase can be purified thanks to its polyhistidine-tag. But purification wasn't optimal and can be ameliorated because a lot of contaminants are isolated with chitinase. The nickel-nitrilotriacetic acid matrix column used was well-worn, that can reduced its efficiency. For an optimal separation of chitinase, we should pool eluate fractions containing chitinase and purify until reduce significantly protein contaminants. But without time we continued with this purification to do activity tests.
Chitinase activity test:
Schales' procedure was used to test the chitinase activity. Schales' procedure is a colorimetric method commoly used for measuring the reducing sugars. Chitin is composed of sugar units of either N-acetyl-G-glucosamine. Chitinase degrade chitin producing N-acetyl-G-glucosamine. To monitor chitinase activity, the reducing sugars released after chitin hydrolyse are detected by a color diminution of the yellow Shales' reagent.
To analyse activity test results, an etalon curve have been done using the final product of chitinase reaction (N-acetyl-G-glucosamine), to know in which concentration of final product must be obtained after reaction to be detected by the method of Schales. A final curve has been obtain showing that
Figure 3: Etalon curve of N-acetyl-G-glucosamine after Schales's activity test.


