Team:Edinburgh UG/Collaborations
Collaborations
Let's do something together!
Collaboration in science is one of the most important steps to succeed. You are very good at your field but struggling in the other? It is not a problem at all when you are open and you are not afraid to ask for help or you can help someone. Meeting other people while doing a science project is also essential. Other people with their fresh mind might easily notice why something may go wrong, suggest new ideas or just share their opinion. So, let's collaborate!
Meetups
As one of the most important collaborations we attendend two meetups and hosted one as well.
iGEM UK Meetup
As our first meetup we attended iGEM meetup UK which was organised by SynBioUK and hosted by University of Oxford iGEM team agt 12th-13th July 2018. It was an amazing experience to talk with other people from the same field about our project getting very valuable feedback. Moreover, it was one of the first experience to present our project as well. Useful workshops made us to stop for a bit and rethink some of the aspects about or project. We are still excited about it.


Results
Calibration
OD600 Reference Point
Absorbance of 0.051 of LUDOX CL-X was obtained with standard deviation of 0.005 while double distilled water had all four replicates at the same value of 0.034, implying that both measurements were done precisely.
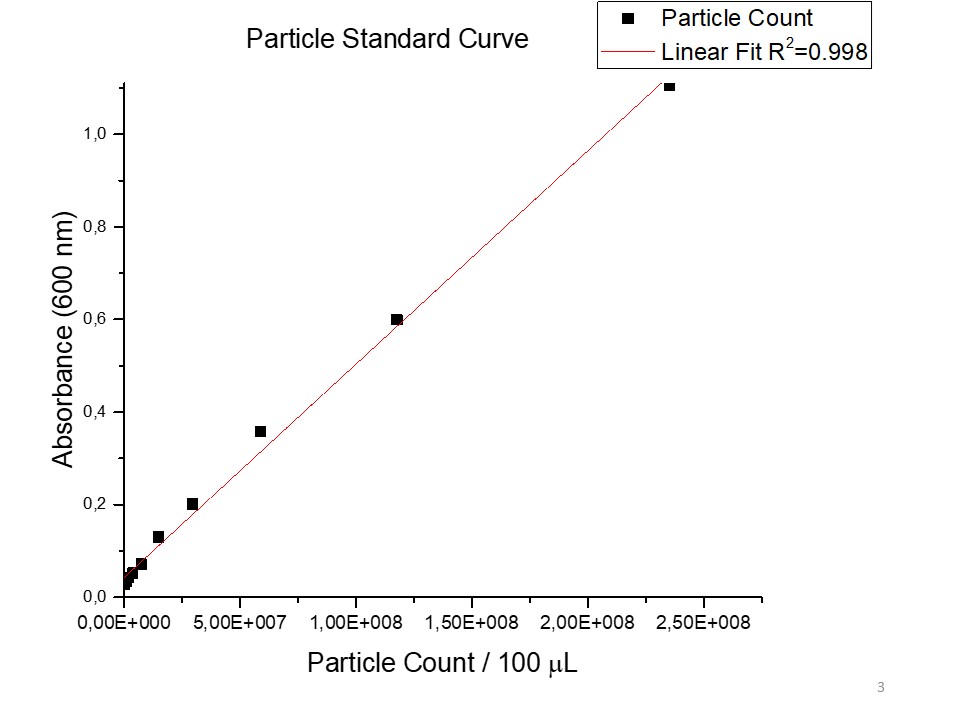
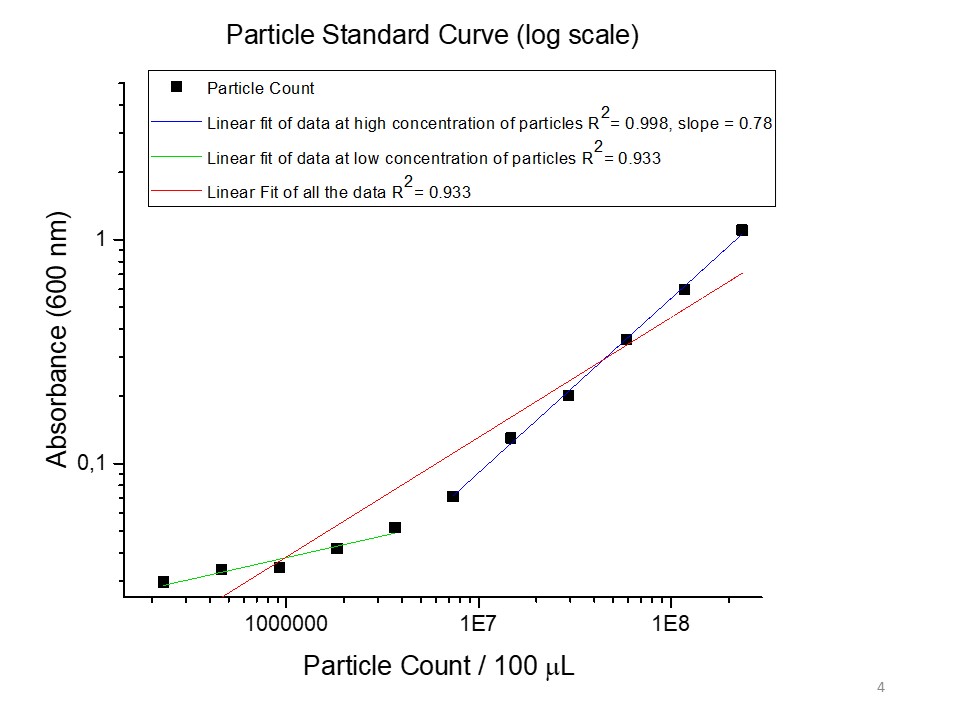
Particle Standard Curve
Particle standard curve was obtained with R2 value of 0.998 (Figure 1). However, logarithmic scale graph (Figure 2) represented less accurate measurement than linear curve (R2=0.993, red line), as linear graph was obtained only in high concentration of particles. Not very high precision may be due to the low absorbance values that is not in a plate reader range or when the absorbance is less than 0.1. Analysing the calibration curve in higher concentrations only, linear fit represented high accuracy in logarithmic scale with R2=0.998.
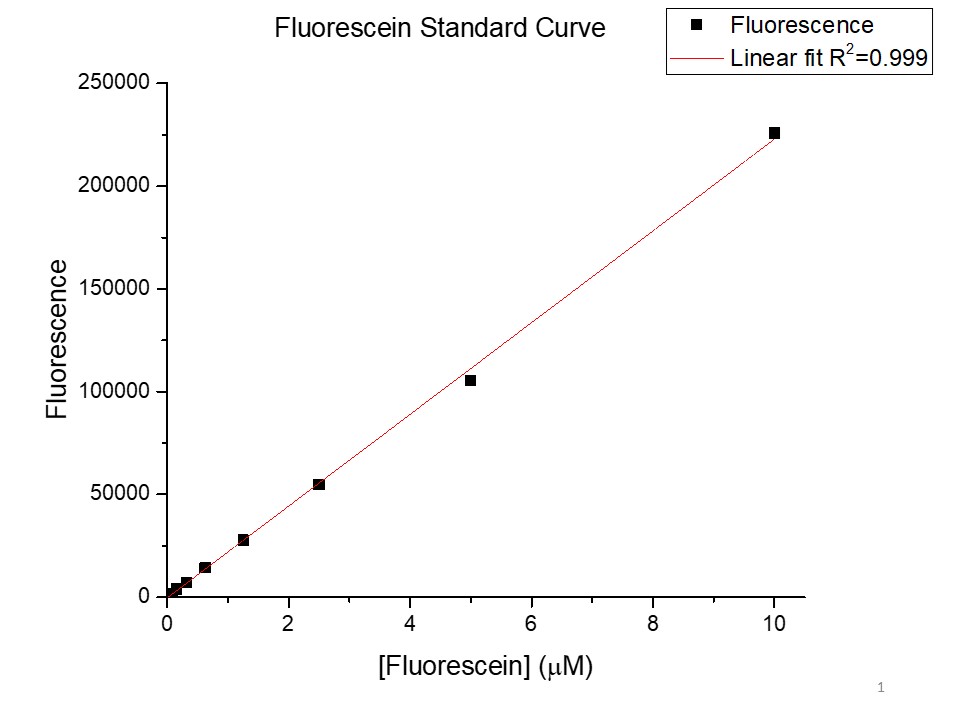
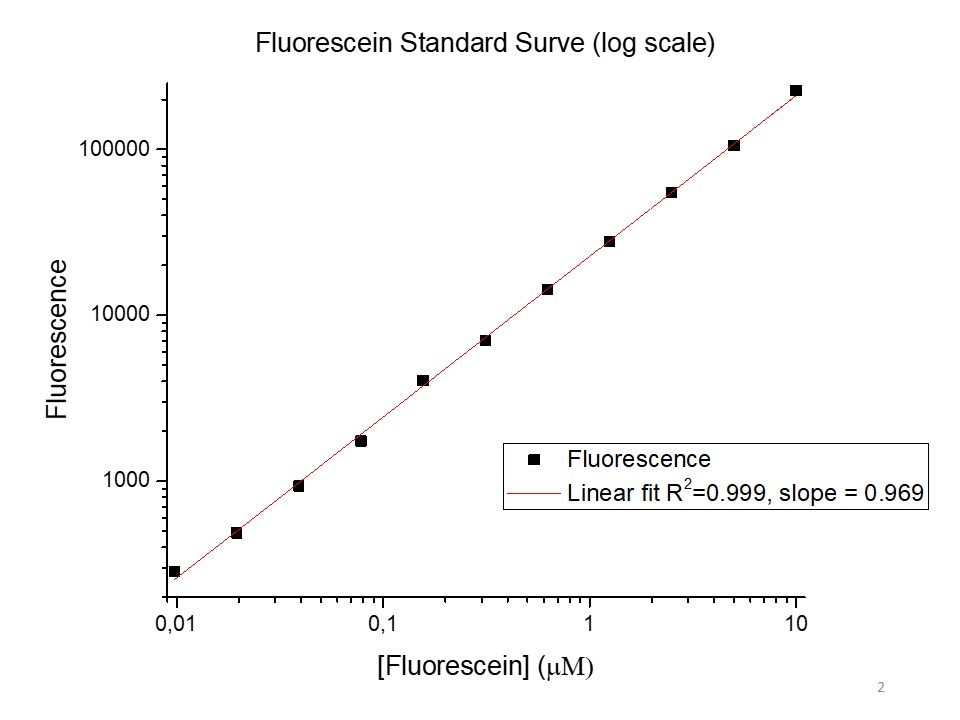
Fluoresence Standard Curve
Fluoresence measurement may be considered as accurate as the data in both graphs (Figure 3 and Figure 4 for logarithmic scale) fit to a line with a value of R2 very close to 1. The slope on logarithmic scale is very close to 1 as well (slope = 0.969, Figure 4) which suggest that the data is considerably good.
Cell Measurement
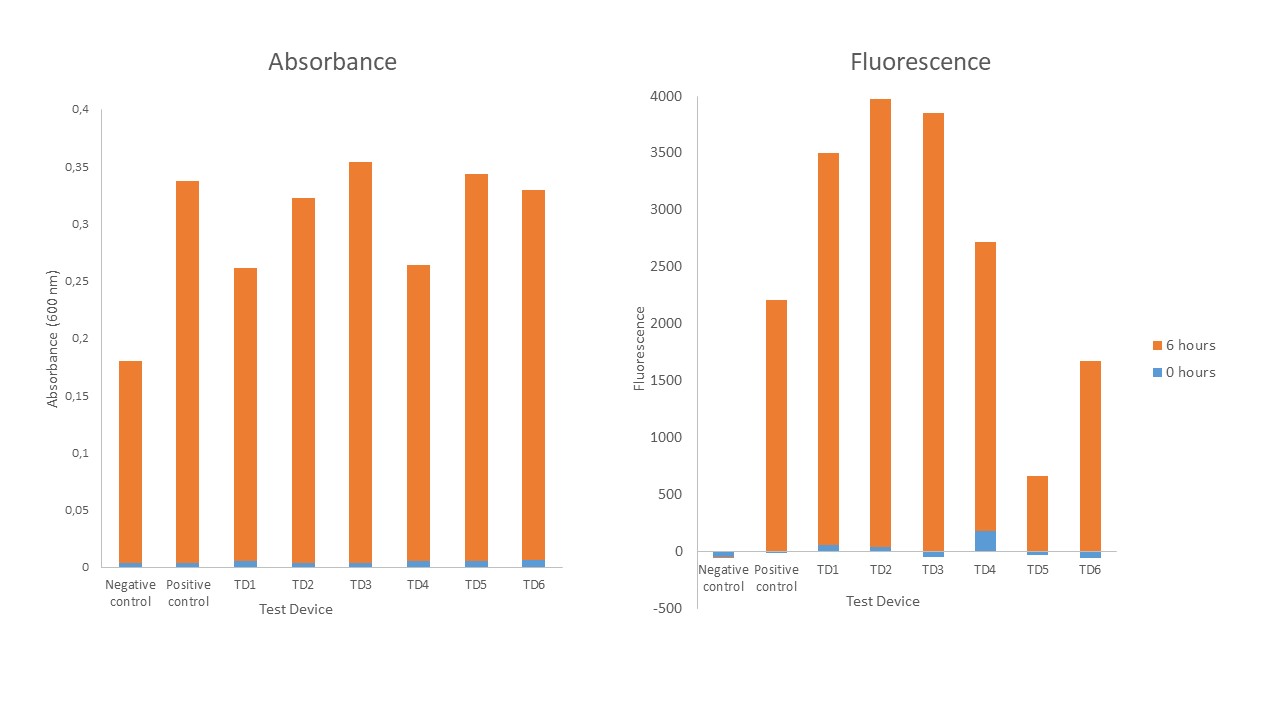
Absorbance and fluorescence measurement using a plate reader
As the absorbance increased in time in all devices and both (positive and negative) controls (Figure 5), it suggests that cells grew in all devices during 6 hours time period, indicating that negative control grew slowest, then TD1 and TD4 grew slightly faster, while all the other devices were similar in the speed of growth. There is no significant relation between cells growth and fluorescence as an order of increasing absorbance or fluorescence varies among different test devices. As expected, negative control has no significant fluorescence. Least measurement of fluorescence was obtained in Test Device 4 and highest was obtained in Test Device 2.
Colony forming units
No correlation was observed among colony forming units (CFU) and absorption as only in the highest dilution factor (8 *108) concentration of the overnight cultures was countable (less than 300 colonies formed).
Contact EdiGEM18
Feel free to leave us a comment on social media!