Experiments
Experiments
Describe the research, experiments, and protocols you used in your iGEM project. These should be detailed enough for another team to repeat your experiments.
What should this page contain?
- Protocols
- Experiments
- Documentation of the development of your project
Contents
Beauveria bassiana
We did some research on Beavearia bassiana fungus because it's an entomopathogenic fungus used during years in agriculture, especially in Canada. [1]
So, we wanted to use this fungus to fight bed bugs which invade our homes. We selected and bought a Beauveria sample.
Growing Beauveria bassiana
First of all, we grew Beauveria bassiana fungus on three different kind of culture medium :
- LB with an antibiotic Cm50
- Sabouraud with Cm 50
- Sabouraud with collagen and Cm 50 [https://2018.igem.org/Team:Aix-Marseille/Protocols]
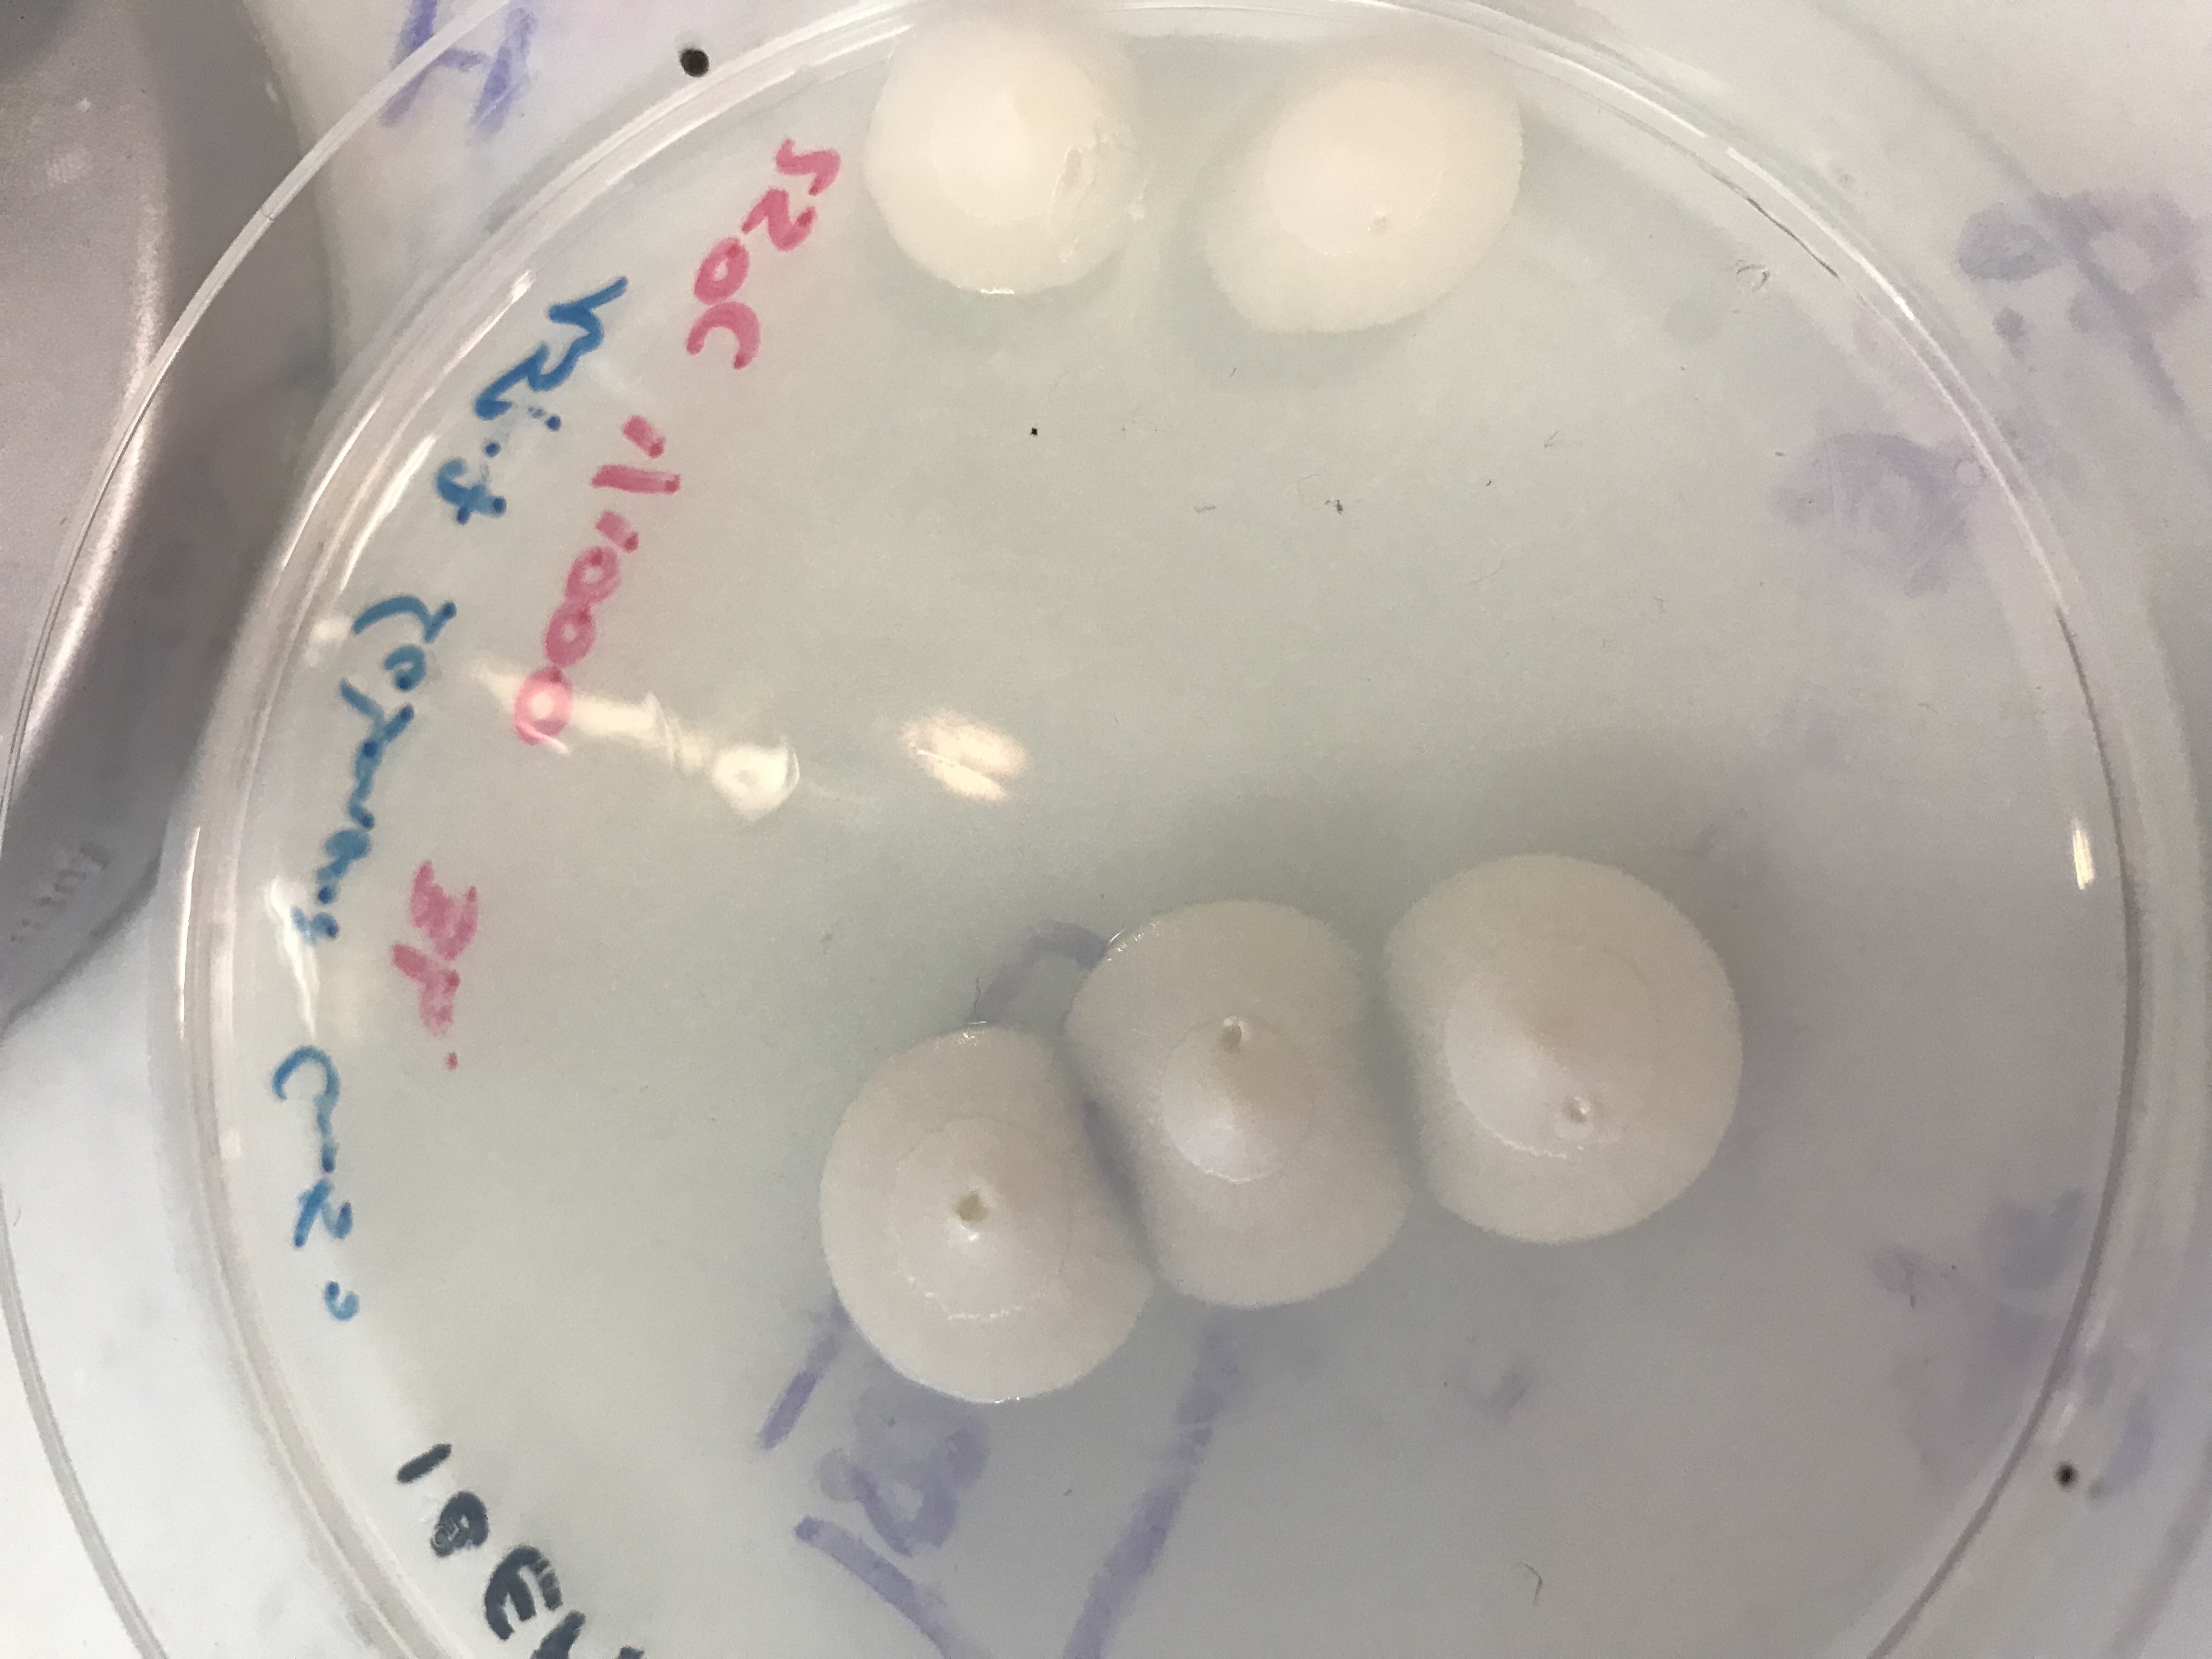
We made a serial dilution and let the fungus grow at three températures : 25°C, 30°C and 37°C. We obtained a lot of results but the culture medium and the most suitable temperature are the Sabouraud culture medium and 25°C. [2]
Killing insects with Beauveria bassiana
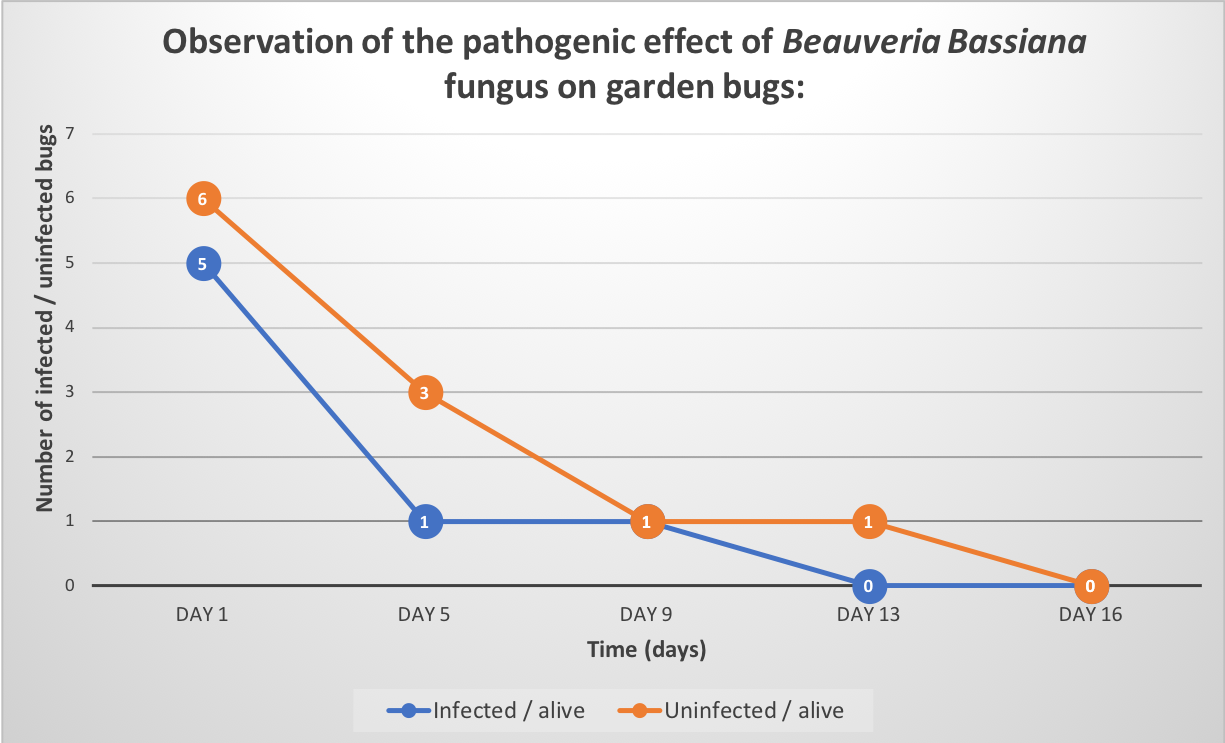
Secondly, we have tested Beauveria Sample on garden bugs with 4g of fungus sample diluted in 40ml of Tween 0,05% to confirmed that it was indeed Beauveria bassiana. We infected them by soaking and observed them for 2 weeks. Unfortunately, results obtained were inconclusive because we had problems keeping our control insect population alive.
However, we did observe mortality, and the infected bugs sprouted fungus a few days after the death of the insects. So, we decided to test our Beauveria Bassiana’s sample on bed bugs in real conditions.
Methionine gamma lyase
Methionine gamma lyase production
Methionine gamma lyase purification
Methionine gamma lyase activity
Mandelate synthase
Mandelate synthase production
Mandelate synthase activity
Chitinase
Chitinase production
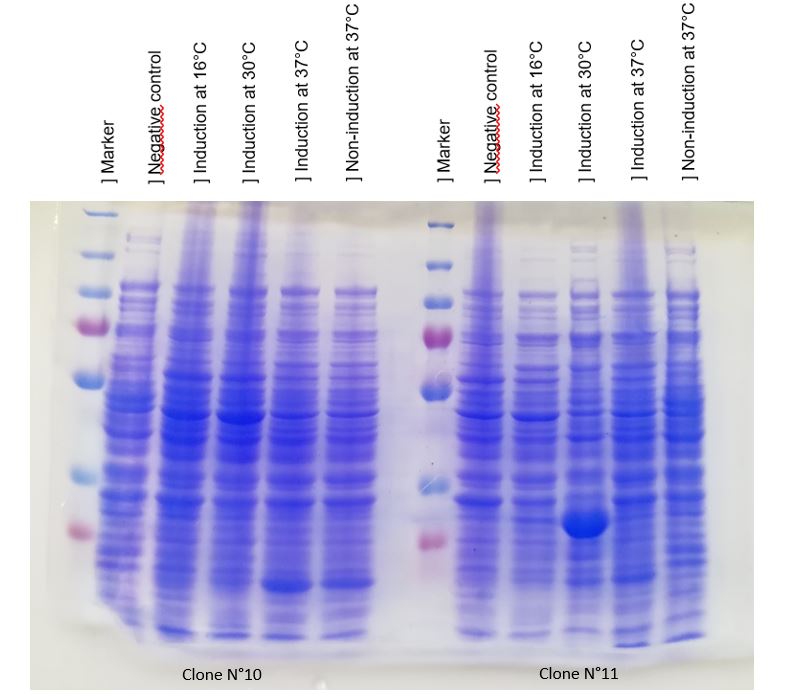
To produce chitinase we used our construction BBa_K2718022. An inducible overproduction driven by the pLac promoter, induction experiments using IPTG can show the presence of the protein. We choose to produce chitinase in the E. coli K-12 strain DH5-alpha For this two different clones with chit1 were tested, clone N°10 and N°11.
Figure 1: Figure 1: SDS-PAGE of chitinase produced by E. coli K-12 DH5-alpha.
(put markers lenghts on the image!!!! and indicate chitinase band ) induction conditions etc
As seen in Figure 1, a protein at the expected size (30 kDa) was overproduced in large quantities at 30°C after IPTG induction. The sample not induction with IPTG show only a weak band in the gel at this position. This overproduction is expected to be the chitinase, strangely that clone N°11 did not produce as much chitinase quantity at 16°C and 37°C. We verified that the protein was chitinase using a western blot and an antibody against the C-terminal His-tag we had designed into the protein.
(put image of western and blue of BL21 or not?)
Chitinase production was best after IPTG induction at 30°C. These induction conditions were used to produce a larger quantity of the chitinase for purification and activity tests.
Chitinase purification
The Chitinase designed in biobricks BBa_K2718021 and BBa_K2718022 has a C-terminal polyhistidine-tag which allows it to be easily purified. We purified the Chit1 protein using a His-trap column and an Akta Pure automated chromatography system. This allows a quick and easy purification, the nickel-nitrilotriacetic acid column specifically binds the histidines residues in the tag to the metal ions in the column, and the protein can then be eluted with imidazole.
Figure 2: SDS-PAGE of polyhistidine-tagged chitinase purification produced by E. coli K-12 DH5-alpha, using a HisTrap column.
(put markers lenghts on the image!!!! and indicate chitinase band )
Showed in figure 2, a protein at 30 kDa corresponding at the chitinase is obtained on bacteria lysate, on the non-purified fraction and in the fractions N°6 to N°10. These fractions were pooled and used for activity tests. This result shows that the His tag added to the protein can be used for purification as well as identification using a western blot.
Numerous controls were been done. The chitinase was produced without its peptide signal of secretion, so it will be contained in the cytoplasm, the absence of the band at 30 kDa in the pellet verify that chitinase wasn't contained in the membrane. Bacteria lysate confirmed the presence of chitinase at 30kDa; non-purified migration shows a low quantity of chitinase with all proteins contaminants; the flow through sample didn't contain the protein target demonstrating that all chitinase was fixed on nickel-nitrilotriacetic acid matrix.
The results of chitinase purification prove that chitinase can be purified thanks to its polyhistidine-tag. But purification wasn't optimal and can be improved because a lot of contaminants were isolated with the chitinase. The nickel-nitrilotriacetic acid matrix column used was a bit old, that may have reduced its efficiency. For an optimal separation of chitinase, we should pool eluate fractions containing chitinase and purify until reduce significantly protein contaminants. But due to lack of time, we continued with the 'purified' samples to do the activity tests.
Chitinase activity test
Schales' procedure was used to test the chitinase activity. Schales' procedure is a colorimetric method commoly used for measuring the reducing sugars. Chitin is composed of sugar units of either N-acetyl-G-glucosamine. Chitinase degrade chitin producing N-acetyl-G-glucosamine. To monitor chitinase activity, the reducing sugars released after chitin hydrolyse are detected by a color diminution of the yellow Shales' reagent. This color diminution is translated by a absorbance diminution.
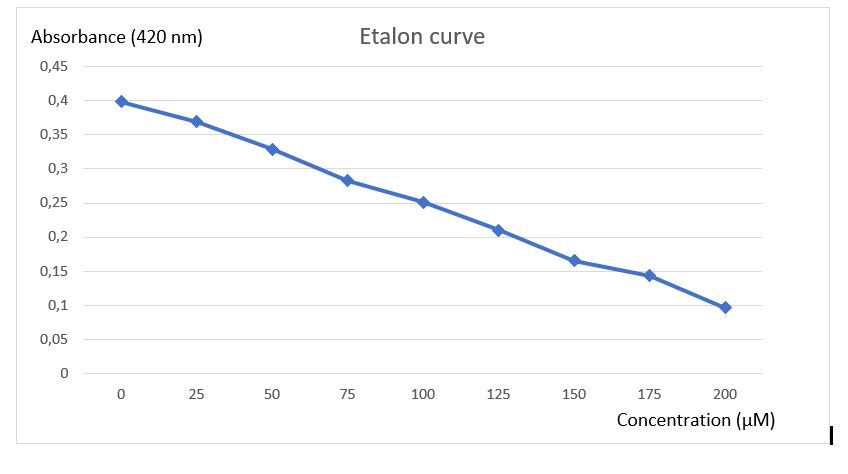
To analyse activity test results, an etalon curve have been done using the final product of chitinase reaction (N-acetyl-G-glucosamine), to know in which concentration of final product must be obtained after reaction to be detected by the method of Schales.
Figure 3: Etalon curve of N-acetyl-G-glucosamine after Schales's activity test.
A final curve has been obtain showing a absorbance diminution in function of increasing N-acetyl-G-glucosamine concentration. With this etalon curve, concentration of final product obtain after chitinase reaction can be determined. This results revealed the efficiency of Schales'procedure to detected N-acetyl-G-glucosamine to 0 at 200 uM.
Figure 4: Table of absorbance measurements of chitinase activity test
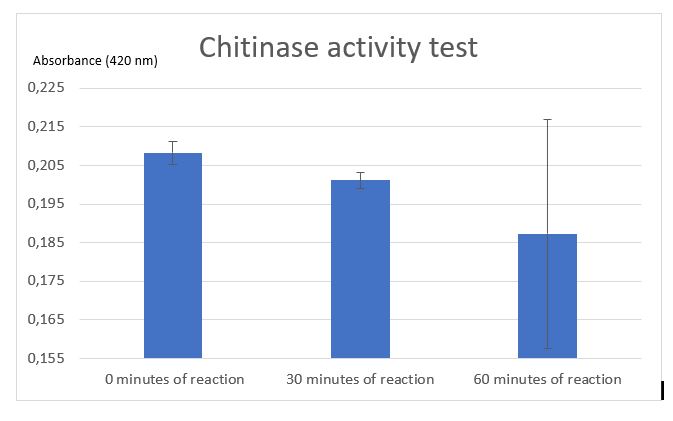
Figure 5: Chitinase activity test by Schales' procedure
According to figure 4, after 30 minutes of reaction a significant activity was mesured. But after 1 hour of reaction the standart deviation put in doubt the significant result at 30 minutes. One of the difficulties encountered was the chitin sample. Chitin sample wasn't completely dissolved in water, it was precipited and a lot of big fragments af shells of shrimps was contained making difficult the pippetage and with difficulty reproducibility. That's why an centrifugation step was added to avoid precipitated chitin to asborbe and affects the results. After centrifugation chitin wasn't really pelleted, it was easily removed. Chitin pellet should be removed in the duplicated sample of 1 hour after reaction, that can be the cause of the high standart deviation in the results. Due to limited time, we weren't able to do another activity test to improve the results and be the most careful at removing and may be we should centrigutated a longer time (not 1 minute but 5 minutes maybe).
Thanks to etalon curve if we consider only the significant results at 30 minutes, we can conclude that after 30 minutes of enzymatic reaction, our chitinase can released 125 uM of N-acetyl-G-glucosamine.
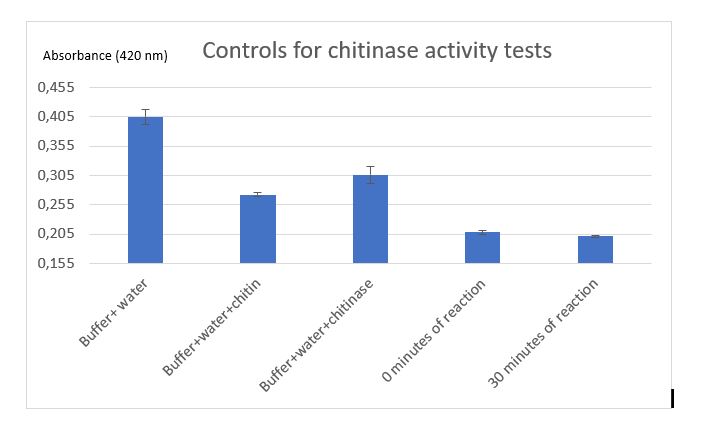
Figure 6: Table of measurements of controls for chitinase activity test
Figure 7: Controls for chitinase activity test
( comment the results of table and the graph!!!!!)
Trap prototype tests
(put the protocol of trap tests!!!)


