Team:HK HCY LFC/InterLab
Interlab Study
The Fifth International InterLab Measurement Study aims to identify and correct the sources of systematic variability in synthetic biology measurements, so that eventually, measurements that are taken in different labs will be less variable than measurements taken within the same lab. The Lab-to-lab variability in fluorescence measurements can be reduced by normalizing to absolute cell count or colony-forming units (CFUs) instead of OD. In this interlab study, GFP is used as the measurement marker for this study since it is one of the most used markers in synthetic biology. Optical density (OD) of a sample is usually used as an approximation of the number of cells for calculating the fluorescence data from plate reader, but it has a relatively low reliability and often leads to a high variability between labs. As a result, a more direct and trustworthy method is adopted to determine the cell count in the sample, reducing the variations in measurement.
The interlab study is divided into two parts: calibration protocol and cell measurement protocol.
A plate reader is used to measure the fluorescence and absorbance and three calibrations are completed before doing the cell measurement.
As plate reader measurements of absorbance are volume dependent, LUDOX CL-X is used as a single point reference to obtain a conversion factor, transforming absorbance (Abs600) data from plate reader into a comparable OD600 measurement, which is obtained in a spectrophotometer. Corrected Abs600 and reference OD600 are calculated and measured.
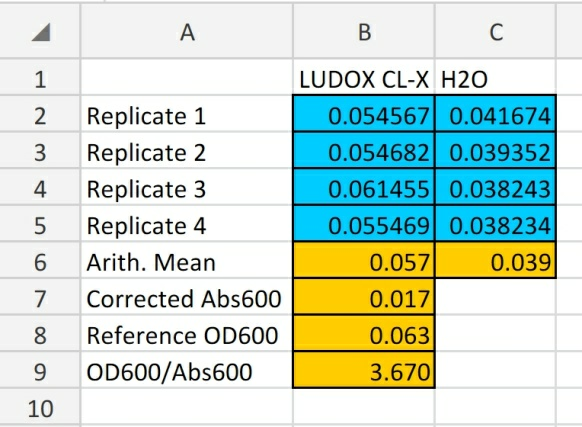
Figure 1: This result shows that all cell density readings using our instrument with the same settings and volume can be converted to OD600 by multiplying by 3.670.
A dilution series of monodisperse silica microspheres is prepared and then the Abs600 in our plate reader is measured. Through this measurement, a standard curve of particle concentration can be constructed, which can be used to convert Abs600 measurements to an estimated number of cells.
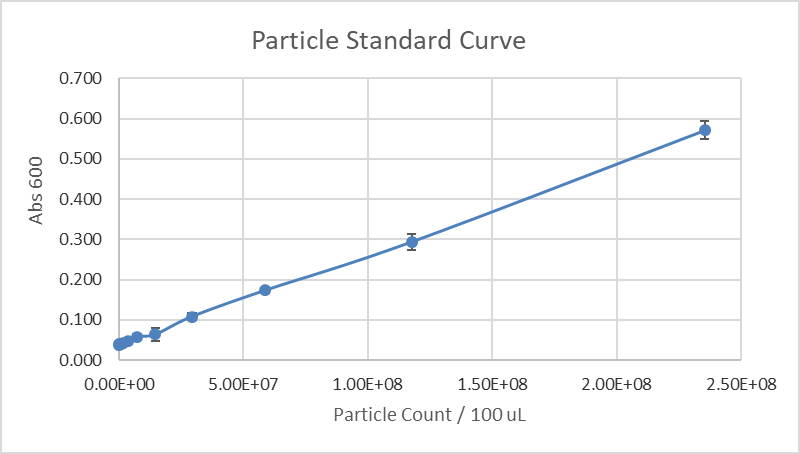
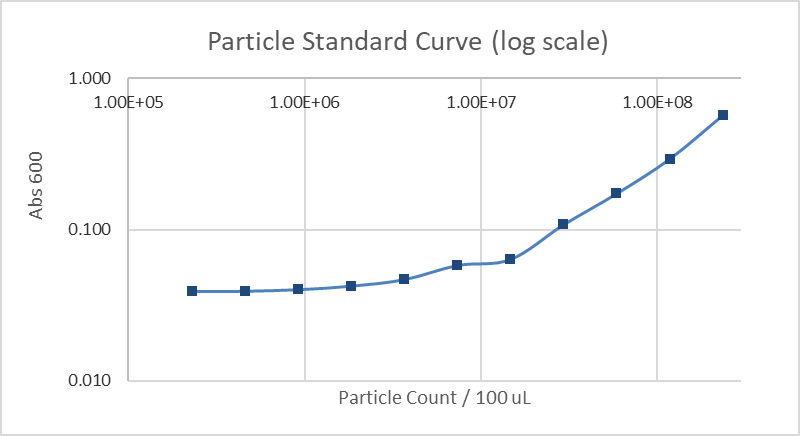
Figure 2&3: Particle standard curve and particle standard curve with log scale
A dilution series of fluorescein in four replicates is prepared and then the fluorescence in a 96 well plate in our plate reader is measured. A standard curve of fluorescence for fluorescein concentration is then generated, being able to be used to convert our cell based readings to an equivalent fluorescein concentration.
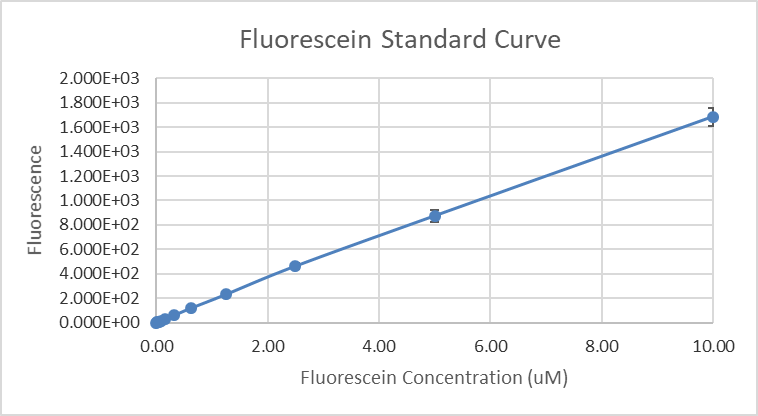
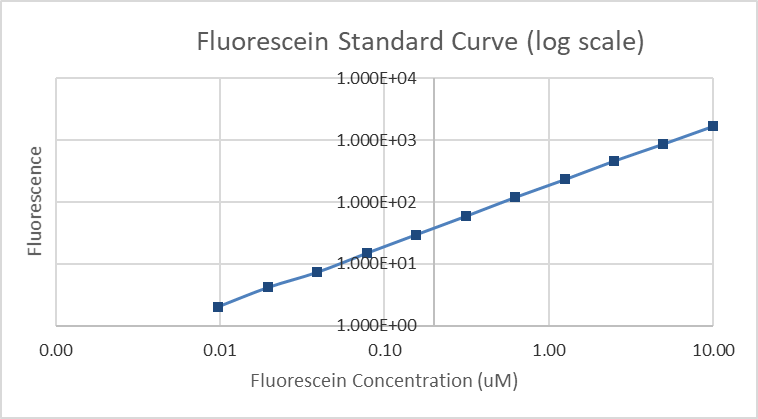
Figure 4&5: Fluorescein standard curve and fluorescein standard curve with log scale


© IGEM HCYxLFC 2018 - All Rights Reserved.