Team:Tokyo Tech/Model
<!DOCTYPE html>
Modeling
Establishment of dengue virus serotype prediction system
Abstract
In the past iGEM, the measurement theory model of artificial gene circuits has been centrally treated. We tried to apply a new model to predict the fluctuation in the number of dengue-infected people.
We used the data of yearly occurrence of dengue serotypes by primary or secondary dengue infection in children along with climate data in Bangkok, Thailand from 1973 to 1999 to create a model to predict change in the number and ratio of patients in each serotype.
This model can predict an epidemic of each serotype of dengue fever, thus can be used by health care institutions to prepare vaccine distribution and production, furthermore allowing them to take special care of secondary dengue infection patients.
From the data we found that some region had distinct epidemic cycle of each serotype while some region had more chaotic pattern, therefore we decided to use simplex projection method for our prediction model, which is suitable for distinguishing chaotic time series from random noise.
If the dengue fever inspection method we developed in the wet experiment spreads and the data about patients infected with dengue virus is fulfilled, it is possible to estimate the number of infected people more precisely. This can be expected to be useful for measures against abandoned tropical infections.
Introduction
Dengue is a mosquito-borne viral disease that has rapidly spread in all regions of World Health Organization in recent years. Dengue is widespread throughout the tropics, with local variations in risk influenced by rainfall, temperature and unplanned rapid urbanization.
There are 4 distinct, but closely related, serotypes of the virus that cause dengue (DEN-1, DEN-2, DEN-3 and DEN-4). Recovery from infection by one provides lifelong immunity against that particular serotype. However, cross-immunity to the other serotypes after recovery is only partial and temporary. Subsequent infections by other serotypes increase the risk of developing severe dengue. Severe dengue is a leading cause of serious illness and death among children in some Asian and Latin American countries.
Reference: http://www.who.int/en/news-room/fact-sheets/detail/dengue-and-severe-dengue
Overview of the model
We predicted how the number of people infected with dengue virus and the proportion of each serotype changes by using a mathematical method, Simplex Projection to the data about the yearly occurrence of dengue serotypes by primary or secondary dengue infection in children and climate data in Bangkok, Thailand from 1973 to 1999. We constructed a model that automatically predicts the number of infected individuals and the variation of each serotype from dengue fever dengue-infected subjects data and climate data.
Simplex projection
Simplex projection, originally proposed by George Sugihara and Bob May in 1990 is a powerful tool for detecting patterns (chaos) in what otherwise appears to be randomness. Moreover, it will also tell you how complicated this pattern is, and then predict the future, often with far greater accuracy than any other technique.
Ignoring ties in distances, minimal distances, minimal weights and other potential hazards, the following algorithm performs Simplex projection to predict Tp time-steps ahead.
Notation
| Description | |
|---|---|
| E | E denotes the embedding dimension. |
| K | k denotes the number of nearest neighbors we use. For the simplex method, the default is k = E + 1 but for the S-map method it can be much larger. |
| Tp | Tp denotes how many time-steps into the future we are trying to predict. |
| X | X ∈ R denotes a (potentially long) time series. |
| y | y ∈ R is a vector of lagged observations for which we want to make a prediction — in the simplest case where all components of the vector are single time step lags, y1 represents the current value, y2 is the value one time step prior and yE is the value E − 1 time steps prior. |
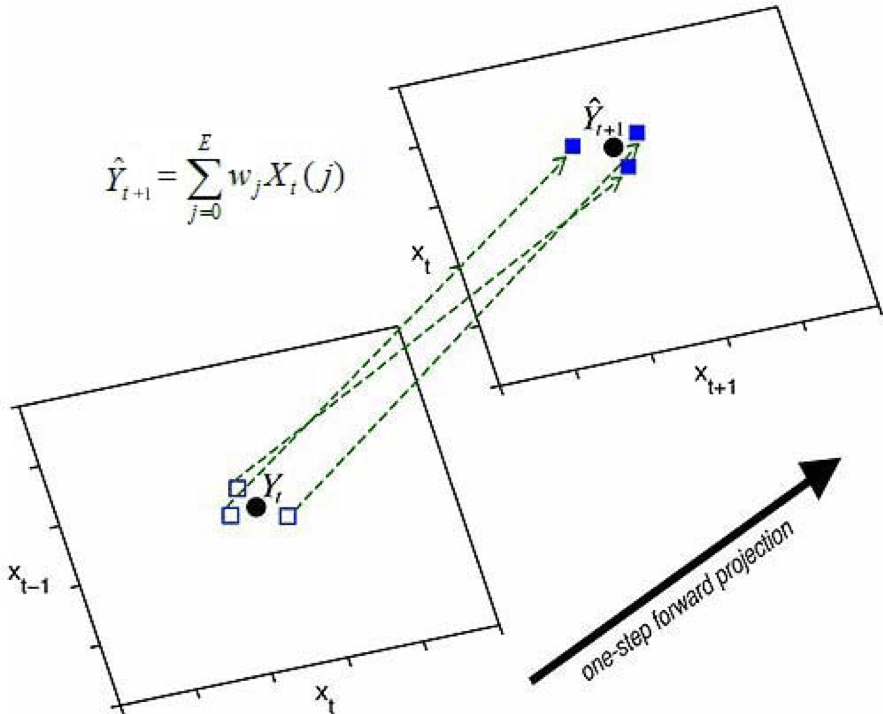
Figure1 Algorithm of Simplex projection
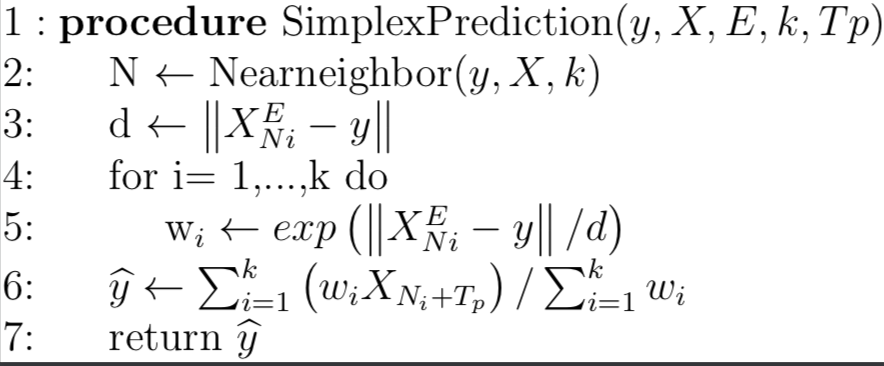
Figure2 Simple illustration of algorithm of Simplex projection
Estimation of distribution of dengue serotypes
We predicted how the number of people infected with dengue virus and the proportion of each serotype changes by using a mathematical method, simplex projection to the data about the yearly occurrence of dengue serotypes by primary or secondary dengue infection in children in Bangkok, Thailand from 1973 to 1999 and climate data in Bangkok, Thailand from 1973 to 1999.
In this analysis, we evaluate the prediction accuracy by rho (Pearson’s correlation coefficient between predictions and observations) values. The following formula is the definition of rho. It can take a range of values from +1 to -1. A value of 0 indicates that there is no association between the two variables. A value greater than 0 indicates a positive association; that is, as the value of one variable increases, so does the value of the other variable. A value less than 0 indicates a negative association; that is, as the value of one variable increases, the value of the other variable decreases.
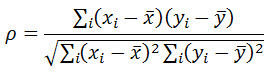
Figure3 Definition of rho
The values of rho in each prediction are shown in the table below.
| Prediction type | Pearson’s correlation coefficient between predictions and observations |
|---|---|
| Change in scaled subjects of DENV1 | 0.691924 |
| Change in scaled subjects of DENV2 | 0.4864992 |
| Change in scaled subjects of DENV3 | 0.3443239 |
| Change in scaled subjects of DENV4 | 0.4620425 |
| Change in existence rate of DENV1 | 0.6788994 |
| Change in existence rate of DENV2 | 0.7765715 |
| Change in existence rate of DENV3 | 0.6569529 |
| Change in existence rate of DENV4 | 0.8263565 |
Prediction using data on the number of infected people was low in accuracy. Since we treated the data over 25 years, there was a possibility that correct data of the number of infected people could not be obtained in the past when technology was not advanced. There is a high possibility that the number of mothers that can be recognized as the number of dengue fever infected people has changed.
However, prediction using proportion data of infected persons occupying each serum was relatively accurate. Using ratio data of infected persons occupying each serotype, it is considered that the accuracy has increased because the difference in maternal fluctuation can be suppressed to some extent.
If the data are increased more, there is no doubt that the accuracy of the prediction model will improve.
The results of the predictions are shown in the following figures.

Figure4 Prediction of scaled subjects number infected with each dengue virus in Bangkok, Thailand from 1973 to 2000
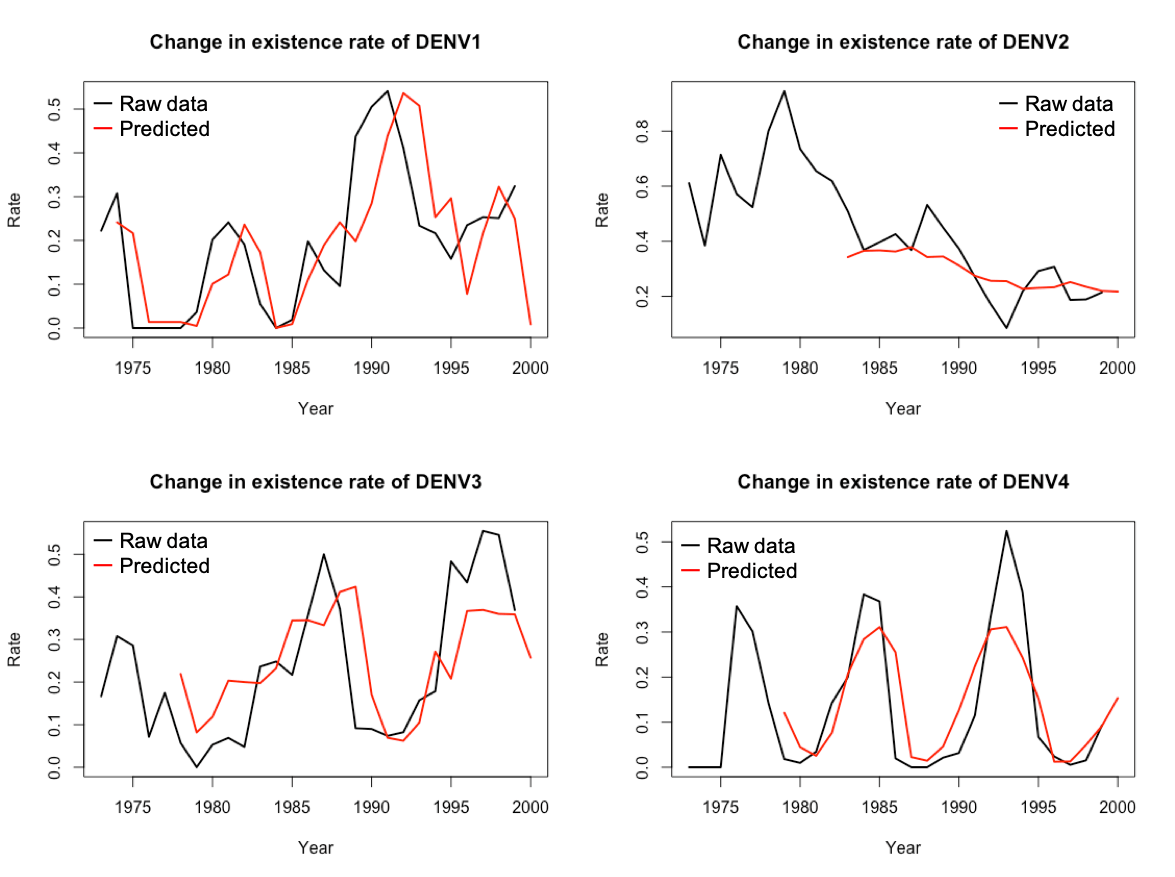
Figure5 Prediction of rate of each dengue virus in Bangkok, Thailand from 1973 to 2000
Co-prediction
The goal of co-prediction is to quantify dynamic similarity between two time series. Given two time series, x and y, we assume that the dynamics can be represented as:


Then co-prediction is a way to quantify how closely F and G resemble each other.
We thought that there might be something related to the temperature affecting the dengue-mediated mosquito activity and the total number of patients in each serotype of dengue.
In order to identify the relationship, co-prediction was performed using the total number of patients in each serotype and the annual average temperature data from 1973 to 1993 in Bangkok, Thailand.
The time series x is total value of infected individuals of each serotype and the time series y is the annual average temperature value.
The figure below shows how much accuracy of prediction was improved by co-prediction.

Figure6 Co-prediction by data of total infected individuals of each serotype (x) and annual average temperature data (y)
Here, we see that the predictions of total infected individuals of each serotype (x) are better when we try to use the inferred dynamics from annual average temperature data (y) to make forecasts. Likewise, the predictions of annual average temperature data (y) have better forecast skill by using the inferred dynamics from total infected individuals of each serotype (x).
Since the time series come from a model simulation where x and y have coefficients, we can infer their dynamical maps are actually related.
Predicton model
In the above fluctuation prediction, prediction accuracy could be improved by using climate data for fluctuation prediction in addition to dengue virus infected patients’ data. It is expected that the prediction of the number of people infected with dengue virus of each serotype will be carried out accurately when the data of infected people with dengue fever increase. Here we constructed a prediction model for the fluctuation in the number of dengue infected people in the coming year from dengue fever infected person data and climate data. With this model we can see which serotype dengue virus will become popular next year from past data.

Figure7 Conceptual diagram of the prediction model
The GitHub repository about this prediction model is here.

Discussion
1) When using Simplex projection, it is said that time series data of at least 35 to 40 points is required. Despite very few data on dengue fever infected people, we were able to make predictions with some degree of accuracy. climate data to infected data, it is possible to improve prediction accuracy.If we can gather data on dengue-infected individuals of each serotype from Wet's dengue infection detection created in this project, we can improve the accuracy of prevention and further help prevent infection with dengue.
2) The differential equation consisting of the number of dengue fever infections and the dengue carriage number of mosquitoes is a simple dynamics of the type converging to one solution, unless there is an influence of environmental factors. Therefore, it is considered that factors in the periodic fluctuation as seen in Thai data are in the environment.
Reference
http://www.who.int/en/news-room/fact-sheets/detail/dengue-and-severe-dengue
http://deepeco.ucsd.edu/simplex/
https://cran.r-project.org/web/packages/rEDM/vignettes/rEDM-tutorial.html
https://cran.r-project.org/web/packages/rEDM/vignettes/rEDM-coprediction.html
https://cran.r-project.org/web/packages/rEDM/vignettes/rEDM-algorithms.pdf
https://statistics.laerd.com/statistical-guides/pearson-correlation-coefficient-statistical-guide.php
http://www.ajtmh.org/content/journals/10.4269/ajtmh.2003.68.191?ijkey=a7c6f78b661b24d3734e97302ea1bc8e754b0b01&keytype2=tf_ipsecsha#dataandmedia
