Team:Vilnius-Lithuania-OG/InterLab
The fifth InterLab study has launched and it further attempts to develop a standard procedure for green fluorescent protein (GFP) measurements to reduce variability across laboratories in the world. This year the attempt is to normalize fluorescence measurements to colony forming units (CFU) instead of optical density of the culture since it is a great source of variability among labs. Two approaches were used to compute the cell number in the samples:
Converting absorbance of cells to absorbance of known concentration beads;
Counting CFU in the samples.
At firstly, we measured absorbance (Abs600) of weakly scattering LUDOX CL-X to obtain a multiplication factor of Abs600 to transform absorbance values to the comparable OD600 units.
Following that, we prepared serial dilutions of monodisperse silica microspheres and obtained standard particle curve (Fig. 1) which allows to convert Abs600 measurements to an estimated number of cells.


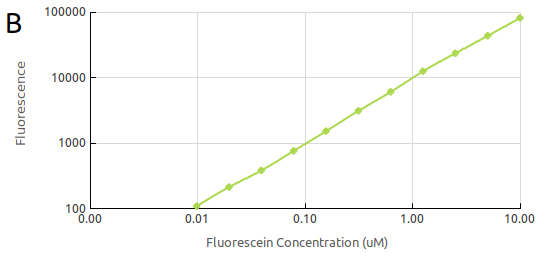
The final calibration was that of fluorescein concentration. We generated a standard curve of fluorescence for fluorescein concentration by, again, making serial dilutions of fluorescein (Fig. 2). This way we could convert our cell based readings of fluorescence to an equivalent fluorescein concentration. The measurements were taken with the same setting as those which would be used measuring cell fluorescence.

We were provided with six different devices (Test device 1 - BBa_J364000, Test device 2 - BBa_J364001, Test device 3 - BBa_J364002, Test device 4 - BBa_J364007, Test device 5 - BBa_J364008, Test device 6 - BBa_J364009) along with negative (BBa_R0040) and positive (BBa_I20270) controls which then we transformed into E. coli DH5α strain. Devices express GFP under Anderson promoters of different strength and are in the pSB1C3 backbone which carries resistance to chloramphenicol.
We made overnight cultures of two colonies of each transformation plate. The next day, the cultures were diluted to OD600=0.02 and grown for 6 hours. The absorbance (600 nm) (Fig. 3A) and fluorescence (485/520, gain = 50) (Fig. 3B) of cultures were measured at 0 and 6 hours.


The negative control demonstrates the highest absorbance which could be the result of the lowest metabolic load of all the devices, since it has no GFP expressed. On the other hand, devices 1, 4 and 5 show much slower bacteria growth even though the fluorescence of these devices is not the highest. Furthermore, device 1 demonstrates a really moderate absorbance and fluorescence increase after 6 hours suggesting that environmental factors could have impeded sample growth.
Next, the previous data (absorbance and fluorescence) was normalized to the comparable OD units (Fig. 4A) and then to particles (Fig. 4B) so that we could determine the mean expression level of GFP per cell.


After 6 hours all the devices (except the negative control) demonstrates a relatively decreased level of fluorescence. That could be explained by cells reaching a certain level of GFP expression after which the fluorescence stops increasing whereas absorption steadily goes up.
The second approach is to calibrate OD600 to CFU which reflects the cell count in the sample. For this approach only negative and positive controls were used.
The overnight cultures of two colonies per control were diluted to OD600=0.1 (three replications) and serial dilutions were made which then were spreaded on agar plates. The next morning the colonies were counted to find out the number of cells in the samples.
NC 1.1 and PC 1.2 samples has shown relatively high and low values respectively comparing to other samples which could indicate a systematic error in a serial dilution step.
In this study cell fluorescence depends on the strength of the promotor under which GFP was expressed. However, all the cells with different devices demonstrated a reduced fluorescence per cell after 6 hours indicating a slowed down GFP production.