Team:SCU-China/modeling/prediction
CRISPR-Cas9 is a versatile genome-editing technology that is widely used for studying the functionality of genetic elements, creating genetically modified organisms as well as doing preclinical research of genetic disorders. Native CRISPR system confers resistance to viruses by incorporating short repeats of the viral DNA into the bacterial genomes. When a bacterial colony is infected the second time, transcripts of these repeats direct a nuclease to the complementary DNA from the invading virus and thus destroy the viral DNA. However, the high frequency of off-target activity (≥50%) is a major concern. Here in our model, the effects of the following factors are considered on the off-target mutation.
- The position of base mismatch: studies show that the closer the mismatch is to the PAM site, the easier it is to cause off-target effect;
- The number of base mismatch;
- The continuous base mismatches;
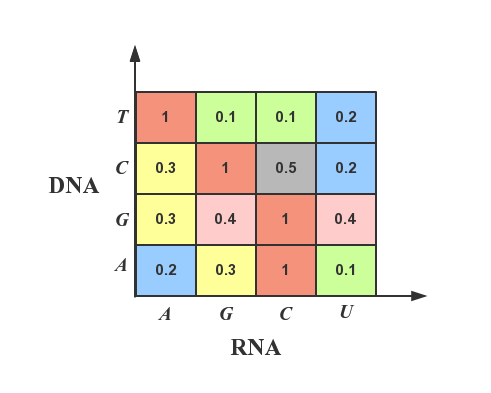
- Thermodynamics structure relationship of mismatches: different base mismatches often require different energies. For example, stability enhancement for rG : dT mismatch is the highest of all mismatches;
With the help of the experimental data published by Evan, we encode all the base sequences according to the mismatch type and the energy intensity between the mismatched bases, on the basis of which the depth neural network with multi-layer perceptron is established and trained, and the prediction accuracy is 95.3% on the test data set. The final role of the model is to simulate the sgRNA in genome, which ensures the safety and accuracy of Crisper.
Based on high-throughput biochemical profiling, the experimental procedure of Evan et al provides over 50,000 data samples for us. In the experiment, a fluorescent DNA oligo hybridized to the dCas9 sgRNA was loaded into the apo-dCas9. In parallel, an Illumina sequencing-compatible DNA construct was both labeled and made double-stranded by extending a second fluorescent oligo. dCas9 was flowed into the chamber, allowing association with double-stranded DNA. A dissociation experiment was then performed by quantifying the decrease in dCas9 signal upon dilution or chase. The experimental result of Evan et al divides all data into test set and train set on a 2:8 ration. In their data results, the one which has an increasing fluorescence intensity over time means on-target and its sgRNA combines with target DNA stably. By contrast, the one which has minimal change rate of fluorescence intensity over time (lower than 0.0001) means “uncombined”. We code these two results in 1 and 0 as shown in Table 1.
| Change Rate of Fluorescence Intensity | Lower than 0.001 | Higher than 0.001 |
|---|---|---|
| Coding | 0 | 1 |
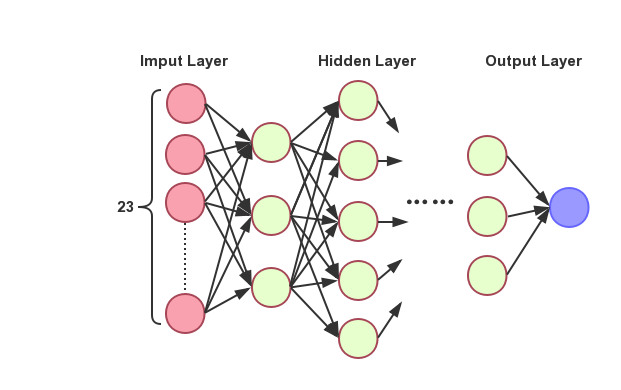
The completely connected neural network that is adjusted by parameters at last, in which the encoded sgRNA vectors are directly used as the network’s input, includes three hidden-layers, one input-layer and one output-layer as shown in Figure 2. Moreover, the three hidden-layers include 46, 64 and 24 neurons respectively. In order to avoid over fitting and improve the robustness of network learning, we add the mechanism of drop-out, using tanh as the activation function in each layer and utilize softmax to process in output-layer.
$$x=(x_1, x_2, \dots, x_{23})$$ $$h_{w,b}(x)=f(\sum_{i=1}^{23}w_i x_i + b)$$ $$f(z)=tanh(z)=\frac{e^z-e^{-z}}{e^z+e^{-z}}$$ The output which is processed by softmax can be regarded as probability distribution approximatively during training, so we can use the cross entropy in information theory to measurer the differences between the real distribution and the output, which means to decline the cross entropy is to promote the accuracy. The discrete form of the cross entropy is as following: $$H(p,q)=-\sum_x p(x)\log{q(x)}$$ The output ranges are only 0 and 1 in the current binary classification problem, means: $$y_i \in \{0,1\}$$ Thereby, $$ \ P(y_i=1|x_i)=1,P(y_i=0|x_i)=0 y_i=1 \ P(y_i=0|x_i)=1,P(y_i=1|x_i)=0 x_i=0 $$ The estimated probability is: $$P(y_i=1|x_i)=\hat{y_i},P(y_i=0|x_i)=1-\hat{y_i}$$ The cross entropy is: $$H(p,q)=\frac{1}{N} \sum_{i=0}{N}(-y_i log(\hat{y_i}) - (1-y_i)log(1-\hat{y_i}))$$ Where \(y_i\) is the sample value, and \(\hat{y_i} = h_{w,b}(x)\) The loss function is as follows: $$J_{(w,b)} = \frac{1}{N} \sum_{i=1}^N (-y_i log h_{w,b}(x) - (1-y_i)log(1-h_{w,b}(x)))$$ Optimized by gradient descent algorithm at last: $$\frac{\partial J}{\partial w_j} = \frac{1}{N} \sum_x x_j(h_{w,b}(x)-y_i)$$ $$\frac{\partial J}{\partial b} = \frac{1}{N} \sum_x(h_{w,b}(x)-y_i)$$ Repeat till convergence: $$\hat{w_J} = \hat{w_J} - \partial \frac{1}{N} \sum_x x_j (h_{w,b}(x) - y_i)$$ $$\hat{b} = \hat{b} - \partial \frac{1}{N} \sum_x (h_{w,b}(x) - y_i)$$
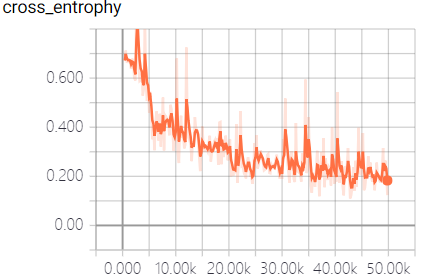
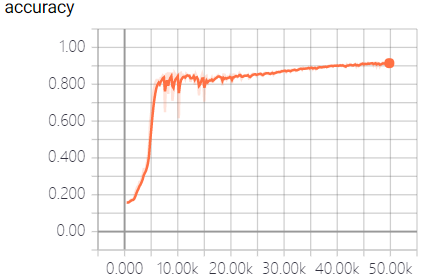
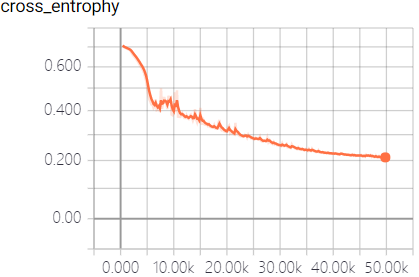
The real-time measurement of accuracy rate and cross entropy in the process of model training is shown in Figure 3:
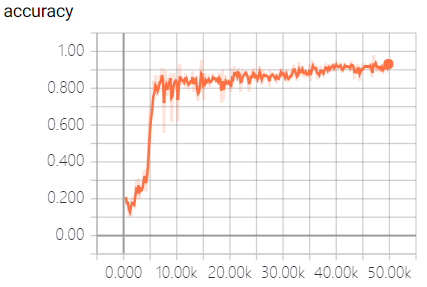
This model fully utilizes the powerful function fitting ability of neural network to predict the off-target sequences of sgRNA. We trained the model and predict the sequences by a large number of data samples. When the model converges, an excellent result with the accuracy of 95.3% in the test dataset was obtained, which surpass the empirical prediction of off-target sequences that only based on the number of mismatched bases, and is beneficial to the design and the structure of sgRNA.
Based on the accuracy we’ve get, we set different mutants to our sgRNA and use our model to predict its binding property to focus on the effect caused by mismatches in positional and quantitative degree. (Suppose the binding process is completely saturated, which means if the sgRNA won’t be off-target predicted by the model ,and it will hit the target gene. And vice versa.) The result is following:
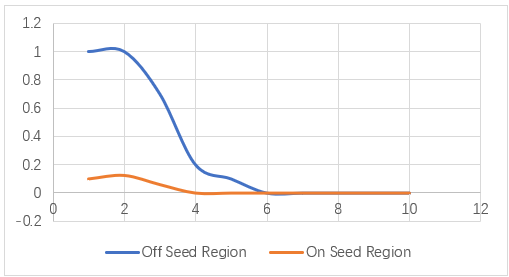
Figure 4. The abscissa axis represents the amounts of mutants we gave to the sgRNA, and the vertical shows the binding probability. When the mutations happened on seed region, the off-target sgRNA is very high. And if the mutations happened on off-seed region, once the amounts of mismatches reached 3,the on-target rate dropped sharply.
[1] Misha Klein, Behrouz Eslami-Mossallam, Dylan Gonzalez Arroyo, Martin Depken. (2018). Hybridization Kinetics Explains CRISPR-Cas Off-Targeting Rules. Cell Reports 22, 1413-1423.
[2] Iman Farasat, Howard M. Salis. (2016). A Biophysical Model of CRISPR Cas9 Activity for Rational Design of Genome Editing and Gene Regulation. PLOS Computational Biology 12(1), e1004724. DOI: 10.1371/journal.pcbi.1004724.
[3] Evan A. Boyle, Johan O.L. Andreasson, Lauren M. Chircus, et al. (2017). High-throughput biochemical profiling reveals sequence determinants of dCas9 off-target binding and unbinding. PNAS, DOI: 10.1073/pnas.1700557114.
[4] Bikard, D., Jiang, W., Samai, P., Hochschild, A., Zhang, F., & Marraffini, L. A. (2013). Programmable repression and activation of bacterial gene expression using an engineered crispr-cas system. Nucleic Acids Research, 41(15), 7429-7437.