
Met Differ
Data format
We design a data format, .met format, to simply describe a metabolic network. .met format is easy to read and write.
If a line starts with ‘##’, this line indicates a new subgraph. Follows the ‘##’ is the name of the subgraph. And the next lines are this subgraph.
If a line starts with ‘#’, this line is a metabolite. In this line, there should be metabolite ID, name and other information like SMILES.
If a line starts without any symbol, it indicates a reaction. Reaction ID, reactors and products should be included. And if exists, enzyme information should be included as well.

Algorithm
In this part, we use merge-and-mine method. First, we merge the pathway graph and the network graph into one graph called align graph, according to the similarity coefficient of nodes. Then the nodes in the align graph are lined according to topology structure. Finally, we search for maximal connected subgraph as the alignment result.
Similarity coefficient
When we align the pathway to the network, similarity should be qualified. We use similarity coefficient to value the similarity between the pathway and the network. Here we consider the similarity from two aspects, node and topology structure.

NodeThere are two kinds of nodes in the metabolic network, metabolites and reactions. We consider them separately.
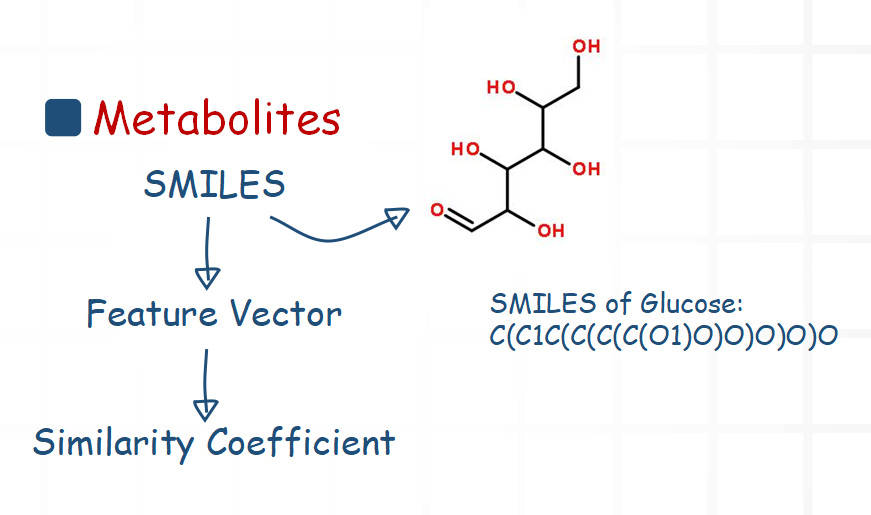
For metabolites, we mainly compare their structure information. Chemical structural formula can be described with SMILES. So we use a software package to extract a feature vector from the SMILES. Then we calculate the similarity coefficient of two feature vectors.

For reactions, we mainly consider the enzyme information. For each enzyme has an EC number, we can simply regularize the EC number to be the enzyme’s feature vector. For those reactions without an EC number, we use their reactors’ and products’ information to be the reaction’s information.
Topology structureAfter merging the pathway and the network into an align graph, we add edges to the align graph according to topology structure. We define the pathway as graph X, the network as graph Y, the align graph as Z. And x1, x2 are two nodes from X; y1, y2 are nodes from Y. x1, y1 are similar enough to be merged into a node z1 in Z, and x2, y2 are similar enough to be merged into a node z2. If node pairs (x1,x2) and (y1,y2) are both connected, and the edges have the same direction, we give the edge (z1,z2) a high weight; if the edge (x1,x2) is opposite to (y1,y2), we give the edge (z1,z2) a lower weight; if there is no edge (x1,x2) or (y1,y2), we give the edge (z1,z2) the lowest weight.

Now the weight is not accurate enough to evaluate the edges, so we calculate ELI(extended local interactome) between each pair of nodes. ELI is a coefficient to evaluate the connection between two nodes and the surrounding nodes. The calculation of ELI is as follows:
1. Calculate Ek(x): The set of paths connecting node x and its neighbors at distance k.
2. Calculate Sk(x,y):

3. Calculate ELI(x,y):

Now we can use ELI to replace the rough weight we gave to each edge. Since the align graph is a dense graph, we can prune it with ELI: for a node zi, the edges from zi are (z1,zi), (z2,zi), ... ,and suppose the edge with the highest ELI is (zj,zi).Then we prune the edges with ELI < k*ELI(zj,zi), and k < 1. In this way, we delete some edges with low ELI, making the align graph not so dense and easy to de the maximal connected subgraph search.
SBML Drawer & Differ
With the development of synthetic biology, more and more computational methods were applied to reduce the researchers’ workload. The Systems Biology Markup Language (SBML), which is a free and open interchange format for computer models, is widely used. The abilities to compare different SBML models of different situations and different versions of the same model are both important. Many other engineering disciplines rely a great extent on version control to track designs that are produced at each stage of the iterative design cycle. This is often accompanied by using the File Differences tool to compare different versions directly and determine the changes. However, it is not satisfactory when comparing two models of the SBML format as text directly. Because it is difficult to find the significant features in its output. What’s more, many textual changes are not significant (e.g., changes in whitespace or the ordering of elements), and if the ID of a species is changed, this change will occur in many places and has a large impact.
We propose model-diff, a tool that can read two or more metabolic network models in SBML format and generate images to show the differences. The default view depicts the metabolites as an ellipse and the reaction as a rectangle. By default, elements in both models will be treated as the same entity if they have the same id attribute. Shading is used to indicate whether each node and edge are shared by two models (gray), a single model rather than two models (red or blue). The dotted node edge indicates that the component is shared between models but its properties are different: a rectangle with a dashed border indicates that not all models have the same kinetic law response; an ellipse with a dashed double border indicates that not all models have the same is boundary property.

Models-diff reads the metabolic models in SBML format and produces the output in DOT format, which can be converted to an image using GraphViz or other compatible software. It can be used as a python package, as a standalone command line tool, or through a form on our website.
SMILES Drawer
SMILES (Simplified molecular input line entry specification) is a specification that explicitly describes the molecular structure in ASCII strings. Smiles-differ provides two functions of smiles alignment and visualization. Users need to provide two molecules of SMILES to be compared. The software classifies the similarity of two molecules based on molecular structure. In theory, the lowest score is 0 and the highest score is 1 point. At the same time, the user can enter SMILE to preview the molecules to be compared.
DNA Editor
SDNA Editor is an everyday lab tool for handling sequences, it has many functions that can be used by researchers very conveniently. The basic function is that it can do basic DNA/RNA operations, such as reverse-Complement DNA, remove non-IUPAC letters and change upper/lower case. Also, it can show the basic information of the sequence. Restriction sites module has a function to find restriction sites, select them and highlight the selected in sequence so that users can find out the locations of restriction sites. Digest module can draws graphic maps. Draw restriction maps with or without features for linear circular sequences. Besides, it can visualize a digest as gel picture. Simulate band intensity or draw all bands black. Translate module can translates DNA sequences in one, three or six frames and show out the peptide sequence features module can handles GenBank features. Use features to annotate regions in the DNA. DNA Editor gives you full control. All calculation happens on your machine. You can load and save sequences in FASTA or GenBank format. Pictures can be saved as html or SVG format.