Team:TAS Taipei/Model
MODELING
MODELING
The two main objectives of our mathematical model are to:
- Predict how much ALDH2 to consume in order to reduce acetaldehyde to match wild type ALDH2 levels.
- Inform manufacturers how much ALDH2 needs to be put into the candies.
To answer both of these questions, we started by modeling the kinetics of alcohol metabolism in the mouth.
.
OVERVIEW OF MODEL PARAMETERS
Our model treats the alcohol metabolism process as a series of steps mediated by two enzymes, alcohol dehydrogenase (ADH) and aldehyde dehydrogenase 2 (ALDH2). ADH converts ethanol to acetaldehyde (a toxic intermediate), and ALDH2 converts acetaldehyde to acetate (Figure 4-1).

Figure 4-1: Alcohol Metabolism. Normally, ethanol is first converted to acetaldehyde (a toxic intermediate) by the enzyme alcohol dehydrogenase (ADH). Then, acetaldehyde is converted to acetate, which can be safely metabolized in the body, by the enzyme aldehyde dehydrogenase 2 (ALDH2). ALDH2*1 refers to wild type ALDH2. (Figure: Caroline C)
Since salivary acetaldehyde is the toxic intermediate we want to eliminate, we needed to first understand how fast acetaldehyde is made and metabolized in the mouth. In the ethanol metabolism pathway (Figure 4-1), four factors affect the acetaldehyde levels in the mouth after alcohol consumption.
- Concentration of ethanol in the mouth
- How fast ADH converts ethanol into acetaldehyde
- Concentration of acetaldehyde in the mouth
- How fast ALDH2*1 converts acetaldehyde into acetate
We obtained literature values for factors 1-3, and used our own experimental data to determine factor 4.
FACTORS 1 & 3:
Determining Ethanol & Acetaldehyde Concentrations
in the Mouth
Table 4-2. Salivary acetaldehyde levels after consuming one mouthful of different alcoholic beverages. Ethanol concentrations after 0.5 minutes were calculated as proportional to the reduction in acetaldehyde concentration after 0.5 minutes. (Lachenmeier et al., 2011)

We researched the ethanol and acetaldehyde concentrations found in different alcoholic beverages. In Lachenmeier (2011), acetaldehyde concentrations were measured in the alcoholic beverage, as well as in the mouth 30 seconds after consumption. Immediately after consumption, we assume that most of the alcohol is swallowed. Hence, we set the salivary ethanol and acetaldehyde levels 30 seconds after consumption (what remains in the mouth) as the initial concentrations for our model.
.
FACTORS 2 & 4:
Determining Enzyme Activities of ADH and ALDH2
We modeled both the ADH and ALDH2 reaction rates using Michaelis-Menten kinetics.
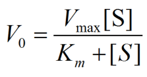
Equation 1. The Michaelis-Menten Equation above models the rate of substrate elimination (or rate of product formation) of a certain concentration of enzymes at varying concentrations of substrates. V0 is the enzymatic activity for a given substrate concentration. S is the substrate (either ethanol or acetaldehyde, depending on the enzyme); Vmax represents the maximum reaction rate (dP/dt); Km is the Michaelis-Menten constant and represents the substrate concentration at which the reaction rate is half of Vmax.
FACTOR 2:
Determining Enzyme Activity of Alcohol
Dehydrogenase (ADH1B*2)
There are two main forms of alcohol dehydrogenase (ADH) involved in ethanol metabolism: ADH1B*1 (slower form) and ADH1B*2 (faster form). ALDH2 deficiency is an issue that mainly exists among East Asians, and we found that over 90% of East Asians have at least one ADH1B*2 allele (Eng et al., 2007). In our model, we made an assumption that all patients are heterozygous for ADH1B (*1/*2). From literature, we obtained the Km value for ADH1B*2 (which we assume to be the same for a slower form), and an effective rate of ethanol metabolism by ADH1B*1/*2 (0.82 uM/sec; unit conversion calculations are shown below; rate adapted from Yokoyama et al., 2016).

We then created a Michaelis-Menten curve modeling the enzymes kinetics of the heterozygous ADH1B*1/*2 genotype.
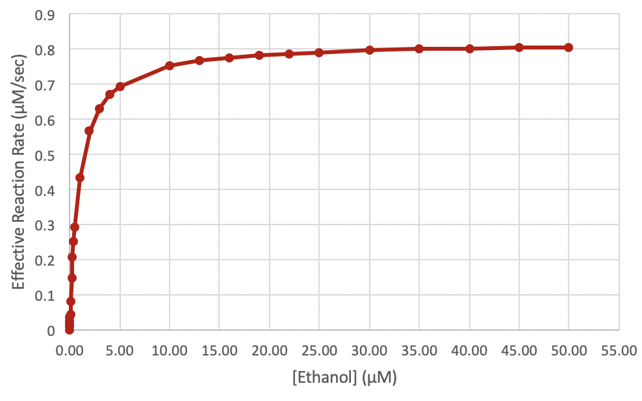
Figure 4-3. Michaelis-Menten curve modeling the enzymes kinetics of the heterozygous ADH1B*1/*2 genotype. This curve reflects the effective reaction rate of ADH1B*1/*2 at various concentrations of ethanol. (Figure: Justin L)
FACTOR 4:
Determining Enzyme Activity of Aldehyde
Dehydrogenase (ALDH2*1)
Purified ALDH2*1 Activity at 37°C
In Prototype, we tested the enzymatic activity of purified ALDH2*1 at 37°C (Figure 3-2). In these experiments, we measured changes in NADH absorbance at 340 nm. To convert NADH absorbance into changes in concentration of NADH, we used the Beer-Lambert Law.
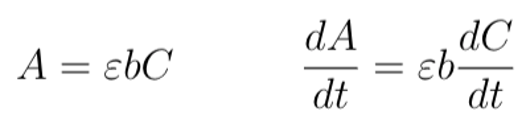
Equation 2. Conversion of absorbance values to changes in NADH concentration. (Left) The variable A denotes NADH absorbance at 340 nm; the variable ε is a constant that denotes the NADH molar extinction factor at the same wavelength of light; the variable b is a constant that denotes the pathlength of the light; and C denotes the NADH concentration. (Right) The Beer-Lambert Law in the form of a differential equation, with changes in A relating to changes in C over time. We used this equation to determine the corresponding change in NADH concentration using a change in ∆ANADH from our functional test. (Figure: Justin L)
From the graph in Figure 3-2, we calculated the change in OD340 of NADH over a time period of 40 minutes. We first corrected the absorbance by subtracting the elution buffer control from the purified enzyme at t = 40 min. We then used the difference in absorbance from t = 0 min to t = 40 min to calculate dANADH/dt. By dividing dA/dt with the extinction coefficient εNADH(6220/M-1Cm-1, as indicated on the Megazyme kit manual) and the pathlength b (1 cm, which is the length of the cuvette), we calculated the rate of change in [NADH] over time (Figure 4-4). Because acetaldehyde, acetate, and NADH all react in a one-to-one ratio in the oxidation of acetaldehyde (Figure 4-1), a change in NADH concentration is equivalent to changes in acetaldehyde and acetate concentrations.
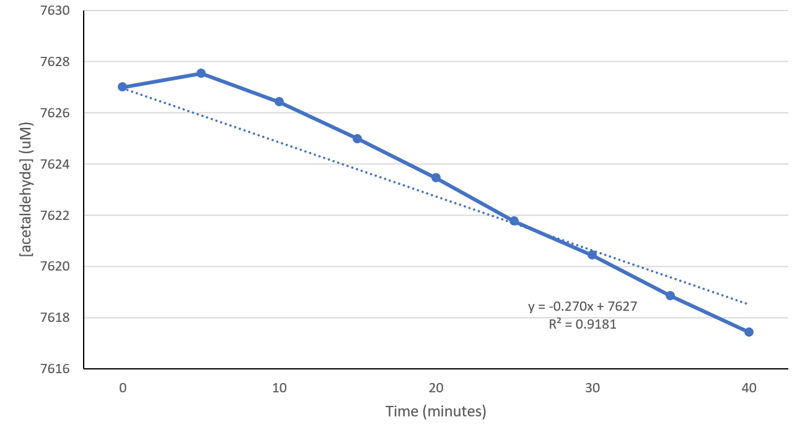
Figure 4-4. Decrease in acetaldehyde concentration as a result of purified ALDH2*1 in artificial saliva at 37°C. The acetaldehyde concentrations were calculated from the raw absorbance values and the Beer-Lambert Law. The calculated acetaldehyde metabolism rate is 0.270 uM/min or 4.50 nM/sec. (Figure: Justin W)
0.222 nM of purified ALDH2*1 was used in this experiment, where we determined the dANADH/dt at 37°C to be 0.067/40 min. We then used the Beer-Lambert Law to determine that at 37°C, 0.222 nM of purified ALDH2*1 enzymes converts acetaldehyde at a rate of 4.50 nM/sec (Figure 4-4).
Using a nanodrop spectrophotometer, the experimental concentration of purified ALDH2*1 was measured to be 0.222 nM. To determine if there was any enzyme degradation during the reaction, we used a rate equation based on the Michaelis-Menten model. The constant kcat represents the conversion rate of the ALDH2*1-acetaldehyde complex to acetate (1180/min; from Rashkovetsky et al., 1994). We used 4.50 nM/sec from the experiment above as the Vmax for ALDH2*1. We solved for [E0], the concentration of reacted ALDH2 enzymes, which turned out to be 0.229 nM. Because the measured and reacted ALDH2*1 concentrations have a 3% standard error, we concluded that enzyme degradation is negligible.
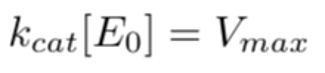
Equation 3. Rate equation derived from the Michaelis-Menten model. The maximum enzymatic activity, Vmax, is equal to the product of the constant kcat and the initial concentration of ALDH2*1, the enzymes. Kcat has a unit of min-1. This model shows that enzymatic degradation is negligible throughout the course of the reaction.
ALDH2*1-EcN Activity at 37°C
We next determined the rate of ALDH2*1-EcN activity at 37°C.
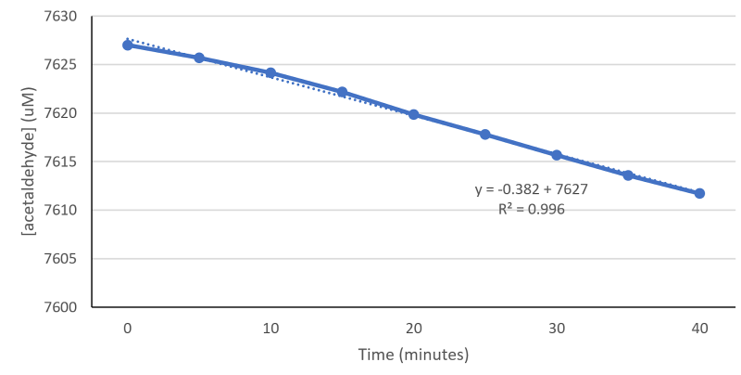
Figure 4-5. Decrease in acetaldehyde concentration as a result of ALDH2*1 in 4.79*108 cells EcN at 37°C. Using experimental data from Figure 3-8 (see Prototype for details), absorbance values from ALDH2*2 in EcN were subtracted from ALDH2*1 in EcN. Following our assumption that bacteria cells contain other enzymes that may also convert NAD+ to NADH, this subtraction takes away the effects of other enzymes, and represents only the NADH converted by ALDH2*1. Absorbance values were then converted to acetaldehyde concentration, so we could determine the rate of acetaldehyde metabolism of the ALDH2*1 in our EcN probiotic. (Experiment & Figure: Justin W)
In our Prototype section, we documented functional tests for ALDH2*1-carrying EcN in artificial saliva at 37°C. Using experimental data from Figure 3-8 (in the Prototype section), absorbance values from ALDH2*2 in EcN were subtracted from ALDH2*1 in EcN. Because bacteria cells contain other enzymes that may also convert NAD+ to NADH, this subtraction allows us to determine the effects of other enzymes, and represents only the NADH converted by ALDH2*1. This correction was performed under the assumption that the enzymatic activity of ALDH2*2 was negligible. We then converted absorbance values to acetaldehyde concentration to determine the rate of acetaldehyde metabolism of the ALDH2*1 in our EcN bacteria. Here, we determined that our ALDH2*1-EcN bacteria converts acetaldehyde at a rate of 6.37 nM/sec at 37°C in artificial saliva.
Knowing the enzyme activity of purified ALDH2*1 at 37°C (0.222 nM of purified ALDH2*1 converts 4.50 nM acetaldehyde/sec), and the rate of conversion in our ALDH2*1-EcN (6.37 nM acetaldehyde/sec), we set up a ratio to obtain the concentration of ALDH2*1, X, present in the EcN from our experiment (Figure 4-5).
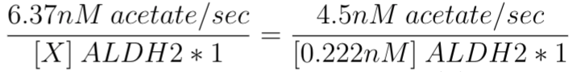
Through this ratio, we calculated X to be 0.314 nM of ALDH2*1 (carried in the EcN from our functional tests), which converted 6.37 nM acetaldehyde/sec.
HOW MUCH ACETALDEHYDE SHOULD BE
ELIMINATED?
After understanding the variables involved in acetaldehyde regulation, we can now model how fast acetaldehyde is being made and metabolized in the mouth after alcohol consumption.
Modeling Sequential Enzymatic Reactions

Figure 4-6. A schematic diagram of a two-step sequential enzymatic reaction. In the metabolic pathway of ethanol to acetate, Substrate 1 represents ethanol; Enzyme 1 represents ADH1B*2; Substrate 2 represents acetaldehyde; Enzyme 2 represents ALDH2; Product represents acetate.
We constructed a system of two differential equations to model the change in concentrations of ethanol and acetaldehyde in a human’s mouth over time based on the pathway illustrated in Figure 4-6.
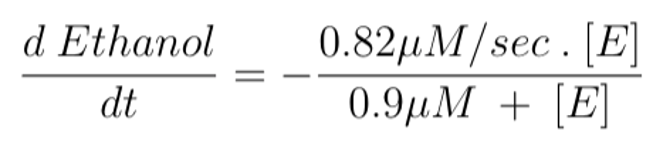
Equation 4 models the change in ethanol concentration over time. We set it as equal to the enzymatic activity of ADH1B*2 enzymes (Figure 4-3). The symbol [E] represents ethanol concentration. This differential equation corresponds to the conversion rate of substrate 1 to substrate 2 in Figure 4-6.
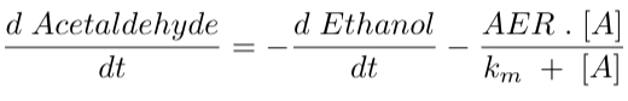
Equation 5 models the change in acetaldehyde concentration over time. We set it as equal to the conversion rate of ethanol to acetaldehyde (d Ethanol/dt) minus the enzymatic activity of ALDH2 enzymes. The acetaldehyde elimination rate (AER) and km are constant values that vary for different ALDH2 genotypes. For example, a person who is homozygous wild type (ALDH2*1/*1) has an AER of 2.1 µM/sec and a Km of 0.2 µM (Rashkovetsky et al., 1994). The symbol [A] represents acetaldehyde concentration. This differential equation corresponds to the conversion rate of Substrate 2 to the Product in Figure 4-6.
.
Software
We then created a Python program (see source code on our Software page!) to numerically solve our two-step sequential enzymatic reaction with the LSODA method. This program can actually be used to help researchers easily model reaction rates involving any two-step sequential enzymatic reactions, where a different enzyme catalyzes each step. Researchers only have to input initial enzyme and substrate concentrations and the enzymatic activity in order to create an easy-to-visualize plot of substrate concentrations vs. time. Researchers can follow the documented directions on our wiki to change or add variables specific to their enzymatic reactions, in order to get the graphs of substrate concentrations over time they wish to model. We licensed our program with the Open Source MIT License.
.
Calculating Required ALDH2 Levels
Through the program, we graphed acetaldehyde concentrations in the mouth over time after consuming different alcoholic beverages. There are three different ALDH2 genotypes (homozygous wild type ALDH2*1/*1; heterozygous ALDH2*1/*2; homozygous mutant ALDH2*2/*2), which process acetaldehyde at different rates (different Vmax values). Based on literature, we know that the heterozygous functions at 20-40% efficiency compared to homozygous wild type, while the homozygous mutant functions at 1-4% efficiency. The graphs below reflect the different efficiencies (20% and 1% were used to assume the worst case scenarios for the two mutant genotypes) (Gross et al., 2014; Chen et al., 2014).
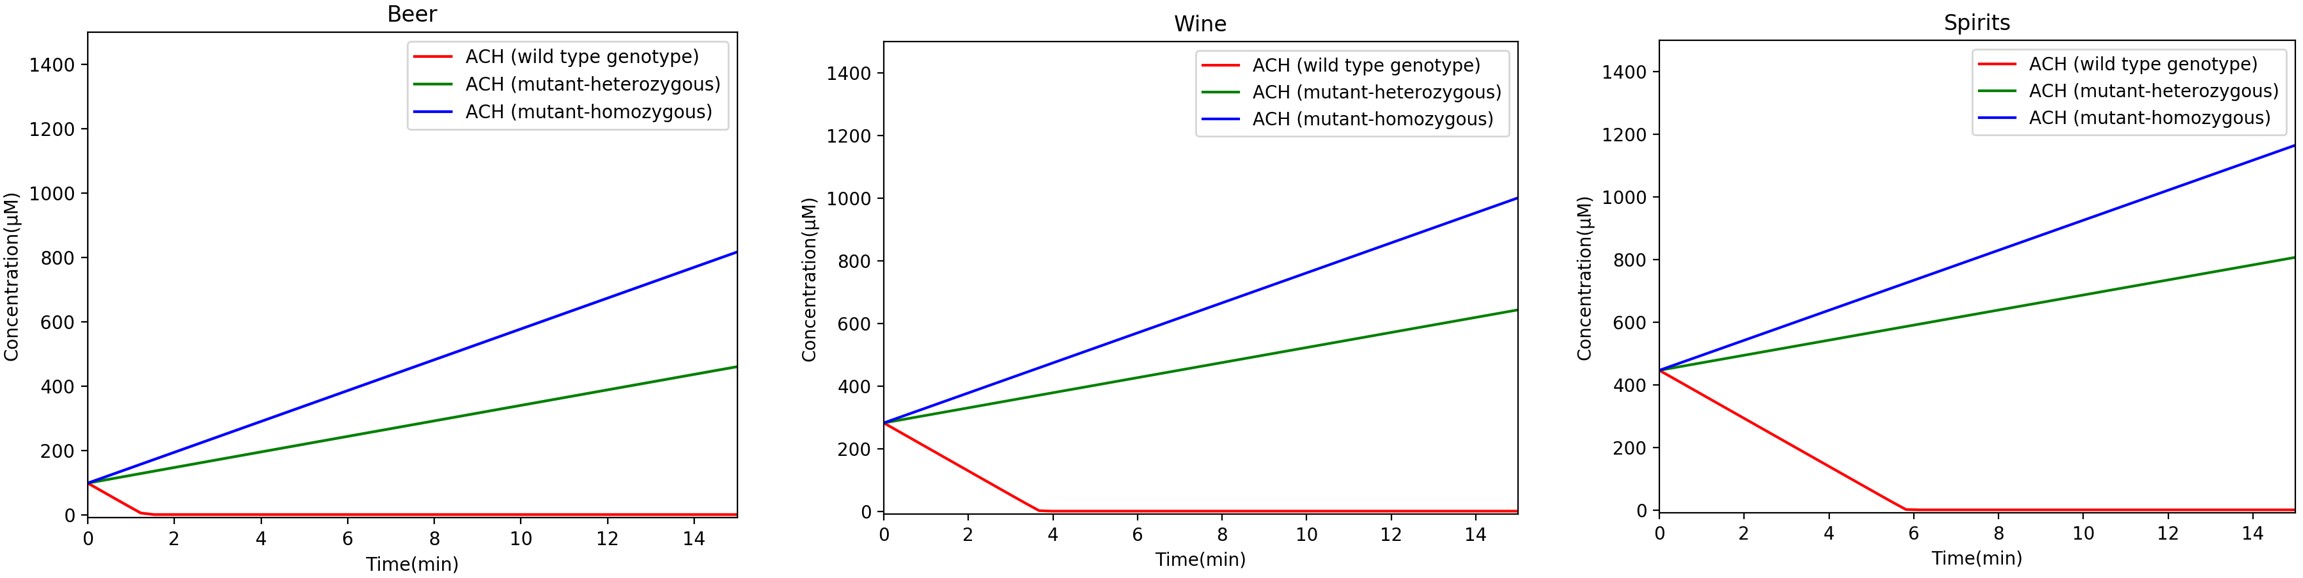
Figure 4-7. Acetaldehyde concentration over time for three different types of alcohol (beer, wine, or spirits). The three curves in each graph represent acetaldehyde concentration over time for the different ALDH2 genotypes. Labels for each curve are provided in the legend.
As seen in Figure 4-7, homozygous wild-type ALDH2*1/*1 metabolizes acetaldehyde the fastest, while the homozygous mutant ALDH2*2/*2 metabolizes acetaldehyde the slowest. Our goal is to help homozygous mutant individuals metabolize acetaldehyde at the same rate as wild type individuals. We included the enzymatic activity for our purified ALDH2*1, which, when subtracted from Equation 5, should return acetaldehyde concentrations to wild type levels. This enzymatic activity can be adjusted by changing the enzyme concentration so that the acetaldehyde concentration matches levels found in wild type individuals.
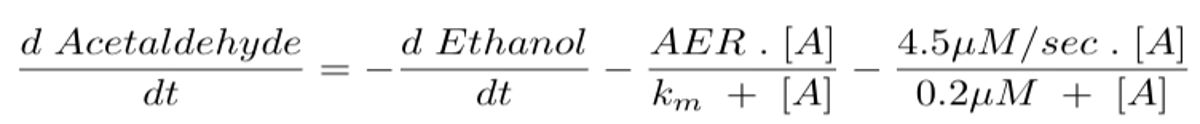
Equation 6 models the rate of change in acetaldehyde concentration over time after additional ALDH2*1 enzymes are supplied to a homozygous mutant individual. The example enzymatic activity presented in the equation is the activity of 0.222 µM ALDH2*1 (from our purified enzyme functional test). The activity can be adjusted by adjusting the enzyme concentration.
Because ethanol concentration is in great excess during the first few hours after consumption, we can assume that the rate of change in ethanol concentration is essentially constant (Jones et al., 2011). Thus, we assume the rate of acetaldehyde production from the conversion of ethanol is constant for all three types of alcohol beverage (Figure 4-7). As a result, the rate of change in acetaldehyde concentration is also the same across the three types of alcohol beverage.
Then, we plotted graphs to investigate the impact of different concentrations of additional ALDH2*1 on acetaldehyde concentrations for different genotypes (Figure 4-8).
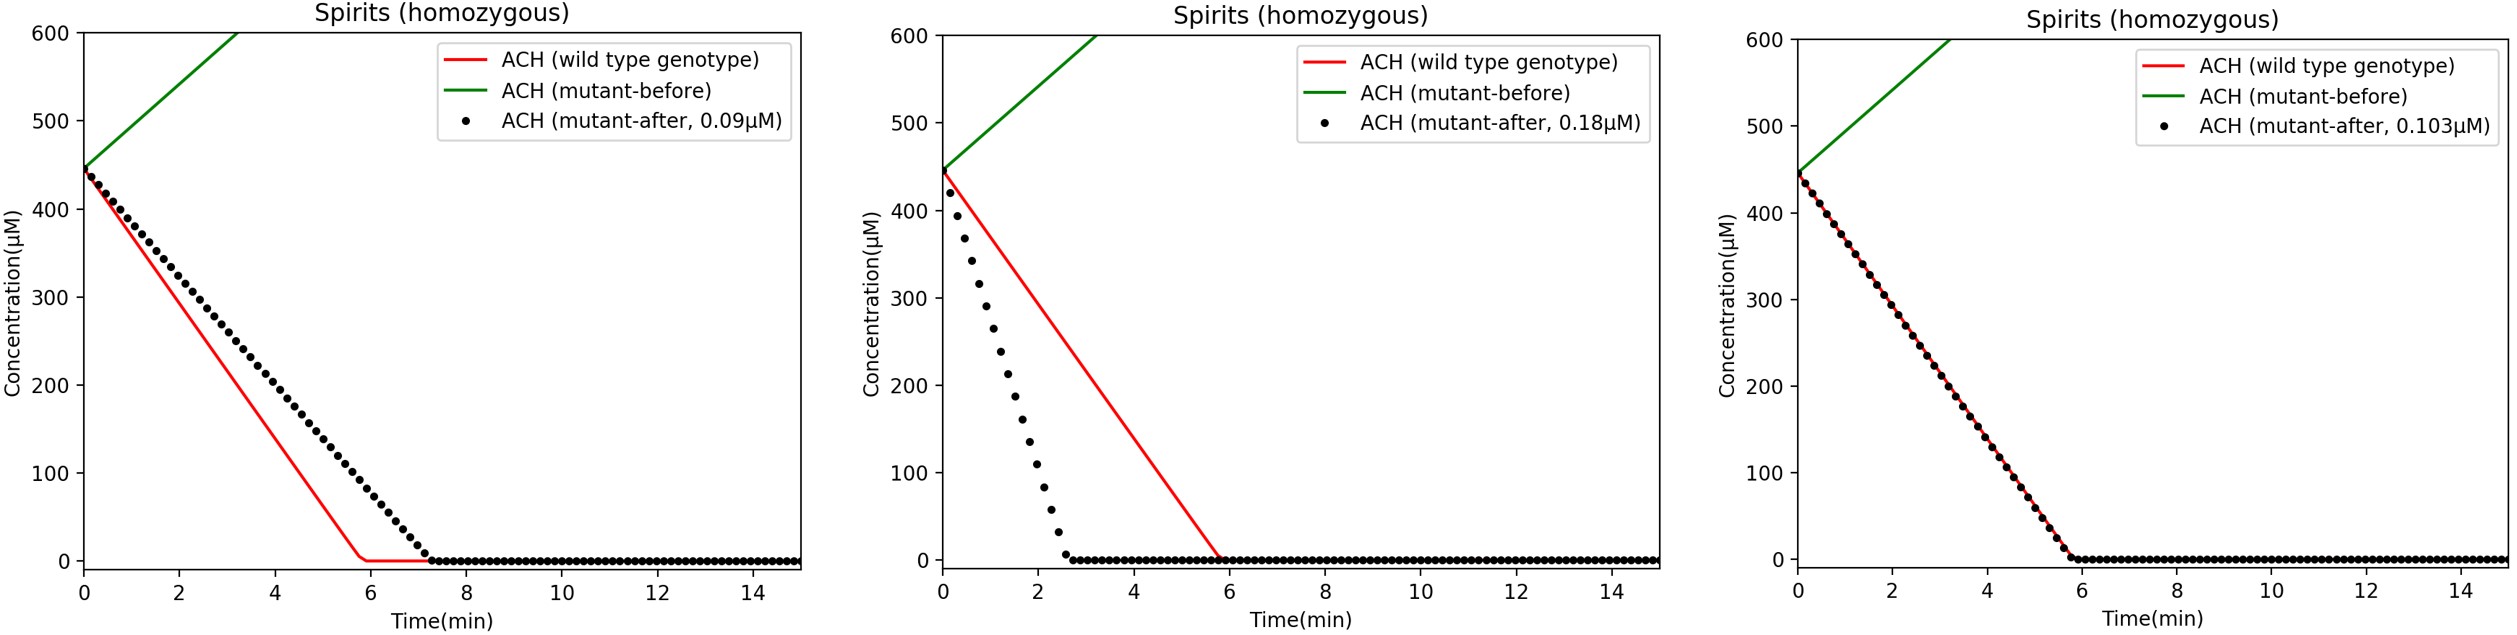
Figure 4-8. Acetaldehyde concentration over time after supplying various concentrations of ALDH2*1 enzymes. Here, concentrations are shown after consumption of spirits. Changing the concentration of additional ALDH2*1 changes the acetaldehyde levels in the mouth. An additional 0.103 µM ALDH2*1 reduces acetaldehyde levels in homozygous mutants to match wild type levels. For other types of alcohol (not shown here, but can be found in Modeling Lab Notebook), the same concentration of 0.103 µM ALDH2*1 also adjusts acetaldehyde levels in homozygous mutants to match those found in wild type people.
As seen in Figure 4-8, the concentration of ALDH2*1 (and therefore the enzymatic activity of ALDH2*1), can be adjusted so that the mutant genotype acetaldehyde levels can match wild type levels. For example, we discovered that 0.103 µM ALDH2*1 is the approximate concentration needed to cover the difference in reaction rates between people who are homozygous mutant and wild type every minute (Figure 4-8).
Determining the Number of ALDH2 Molecules and Bacterial Cells
Needed in the Candy
In order to provide a quantifiable amount of ALDH2*1 for manufacturers to produce, we converted the concentration of ALDH2*1 to the number of molecules needed for production. For example, using the hypothetical spirits example above, by multiplying 0.103 µM of ALDH2*1 enzyme with the average volume of saliva in a person’s mouth, which is 1.19 mL, we found that 1.226*10-10 mol ALDH2*1 are required.
We previously determined that one candy should completely dissolve in the mouth in about 15 minutes (“Product Testing” experiment in Prototype), so we multiplied the moles of ALDH2*1 needed in one minute by 15 to ensure that, on average, 1.226*10-10 mol of ALDH2*1 are released every minute that our candy is used. So, in this example, 1.839*10-9 mol (1.226*10-10 x 15 min) of purified ALDH2*1 enzymes would be packaged into one candy. Here, we made the assumption that one candy’s volume changes (dissolves) in a linear constant rate fashion.
Furthermore, to determine the number of EcN bacteria cells (probiotic) needed to produce the specified moles of ALDH2*1 above, we used values from the EcN bacteria functional test (0.314 nM of ALDH2*1 is produced by 4.79*108 cells in 16 hours) to calculate the moles of ALDH2*1 enzymes produced by each cell. We then calculated the number of bacteria cells needed to produce 1.839*10-9 moles of enzymes in 16 hours. The manufacturers would need 2.81*109 bacteria cells in one candy. From literature, we figured that one E. coli bacterium cell weighs about 0.95*10-12 g. Hence, one candy would contain about 2.67 mg of bacteria cells (Glazyrina et al., 2010).
Each candy allows an ALDH2 deficient patient to match normal wild type ALDH2 activity. For consumers, the safest way to prevent the increased cancer risks is to keep a piece of candy in the mouth when they are drinking. For those who are unwilling to eat the candy while drinking, they can still process acetaldehyde at wild type rates if they consume the candy after drinking; however, they would be exposed to the high acetaldehyde levels that were present before the candy was eaten. It is possible that the bacteria may also persist in the mouth after the candy has been consumed. This would provide a protective effect, allowing the candy to be used before drinking, but further experiments would need to be conducted to determine whether the probiotic can remain in the mouth.
.