Team:UAlberta/Results

Synbio Lab
Overview
Team UAlberta’s experimental efforts were divided between engineering an optimized biosynthetic pathway to produce protoporphyrin IX (PPIX) in E. coli (synbio lab) and in vivo experimentation in bees (beelab). The synbio lab’s main objective is to engineer an optimized biosynthetic pathway to produce PPIX in E. coli and to characterize this pathway.
PPIX MIC
As APIS involves engineering a modified heme biosynthesis pathway in E. coli to allow the overproduction of PPIX, it was important to first know the effects of elevated PPIX concentrations on our chassis. Previous investigations have shown that E. coli overproducing PPIX secreted the compound into its growth media, reaching concentrations as high as 80 μM [1].
The toxic effects of unnaturally large quantities of PPIX on E. coli are not documented so our team performed a standard broth dilution method [2] for determining the minimum inhibitory concentration (MIC) of PPIX to both of our E. coli strains, DH10B and BL21(DE3). MIC assays are techniques commonly used to determine the toxicity of a given compound to prokaryotic organisms. Our specific protocol can be found in the Experiments section. The table below shows the final concentration of PPIX present in each of the wells.

After overnight incubation, we found that PPIX had precipitated out of solution as small dark red granules at higher concentrations (Figure 1). Due to the PPIX precipitate, we could not accurately determine the absorbance of each well to quantify cellular density. However, the highest concentration of PPIX at 120 μM and all lower concentrations were visually more turbid following the incubation period. In addition, we did not observe turbidity in the sterility control, indicating a low possibility of contamination in the plate.
Despite the PPIX precipitates preventing our team from actually measuring the final cell counts of each sample, the qualitative change in turbidity indicates that the highest concentration of PPIX used did not inhibit the growth of our E. coli strains.

Testing plasmids from the Technical University of Denmark
Previous work by Kwon and colleagues demonstrated that without further optimization, enzymes encoded by HemA to HemF are sufficient to produce a substantial amount of protoporphyrin IX - approximately 28 μmol/L in Escherichia coli [3]. Building on this work, Nielsen and colleagues from the Technical University of Denmark (DTU) designed a molecular cloning pipeline to assemble and optimize a biosynthetic pathway to produce protoporphyrin IX in E. coli with yields up to approximately 80 μmol/L [1].
We were excited by the production levels achieved by Nielsen and colleagues, and wanted to use their engineered pathway as a standard to which we can compare our engineered pathway against. We received the plasmids pCDF-hemABCD-D2, pET-hemEF-C15, and pET-hemEF-C16 generously provided by Dr. Nielsen, and started attempting to sequence the plasmids as well as express the pathway in BL21(DE3). Unfortunately, we were unable to generate a working stock of the plasmids and sequence them. We designed several sequencing primers based on the original vectors the genes were inserted in, but none of them worked. We tried to reach out to Dr. Nielsen, but he was also unable to provide us with a sequence map to verify the constructs. Thus, we were forced to abandon our efforts to test the pathway engineered by Dr. Nielsen and his colleagues.
Assembling APIS and enzyme expression
As detailed in our Design, we designed our pathway, which we named APIS, to be assembled from four separate gBlocks. Our first objective was to clone each of our gBlocks into pBAD using our cloning workhorse strain, DH10B, to ensure an unlimited supply of the gBlocks. The plate shows the gBlock containing HemA and mScarlet; HemB and mNeonGreen; HemC, HemD and mScarlet; HemE and HemF in counterclockwise order (Figure 2). The mScarlet-containing gBlocks exhibited the expected red fluorescence in DH10B because the gBlocks were inserted in pBAD’s MCS, thus placing the entire gBlock under the control of pBAD’s arabinose-controlled promoter. However, because the HemB and mNeonGreen and the HemE and HemF operons are located on the opposite strand and DH10B does not express the T7 polymerase, we were unable to see the expected green fluorescence in Hem B-mNeonGreen. Constructs were end-sequenced to verify insertion into pBAD.
Our initial plan was to assemble the APIS pathway in a modified variant of pRSET. To enable cloning with both InFusion and restriction enzymes, we deleted the entire coding region of pRSET and appended the same pBAD overlap sequences as our gBlocks to the end of pRSET using PCR.
We immediately had problems with subcloning HemA-mScarlet into pRSET. As the design allowed nonlinear assembly of the pieces, we decided to build the remaining gBlocks in pBAD and subclone the partially assembled construct into pRSET containing HemA at the end. Therefore, while we troubleshoot HemA-mScarlet in pRSET, assembly with the other 3 gBlocks began in pBAD. Hem CD-mScarlet was inserted into HemB-pBAD vector by removing the mNeongreen coding region. An initial visual confirmation with red fluorescence was observed and subsequent diagnostic digest of the assembled BCD-mScarlet confirmed entry of the gBlock. Then, we inserted Hem EF into the BCD-mScarlet in pBAD to produce colourless colonies which also had insertion confirmed with a diagnostic digest.
Due to low efficiency of HemA-mScarlet subcloning in pRSET, we decided to insert the BCDEF construct into HemA in pBAD, and skip subcloning to pRSET in favour of directly cloning into pSB1C3. However, when we tried sequencing the full construct in pBAD, we found mutations in the coding region for both HemE and HemF. The same mutations were found in every stock of Hem EF we had available, suggesting that the mutations are in the stock gBlock supply, and therefore we reverted them with site directed mutagenesis. The full assembly in pBAD was then digested and ligated into pSB1C3. We ran sequencing on several clones the full construct to confirm the full construct, only to find different mutations in different stocks of the HemA operon, suggesting that, unlike with the HemEF gBlock, the mutations are not from the stock gBlock supply. Therefore, we re-cloned and re-sequenced the HemA gBlock in pBAD, and replaced the mutated HemA operon in pSB1C3 with a confirmed HemA operon using traditional cloning methods. However, due to time constraints, we were unable to verify the final sequence of the APIS construct.
While cloning and troubleshooting the full construct was underway, we also cloned in each individual gene (HemA to HemF) in pBAD using a combination of InFusion and traditional cloning methods (see our Improved Part page for a detailed explanation of the expressing construct). Each enzyme was then expressed and purified in either 500 mL of LB media or 250 mL of modified TB media, according to our team’s standard protocols. The results of our protein purification are shown in the table below.

Table 2: Concentrations of enzymes purified from individual gene expressions of Hem A-F in E. coli strain DH10B
Overexpression of HemA drives formation of PPIX
There was some concern that the high production of protoporphyrin IX in vivo might not be accessible due to the action of an endogenous downstream enzyme, ferrochelatase, converting PPIX into heme before PPIX could be secreted and/or extracted. Ferrochelatase, which is encoded by HemH, is responsible for the last step of heme synthesis by charging PPIX with Fe2+. Ferrochelatase is an endogenous enzyme in E. coli , leading to concern that any PPIX formed by our engineered pathway would merely get converted into heme. However, Kwon and colleagues demonstrated that the co-expression of HemH, along with HemA to HemF, does not lead to a significant increase in heme production [3]. When only the enzymes encoded for by HemA to HemF were overexpressed, they found that the quantity of PPIX was 30-fold greater than the quantity of heme produced, suggesting that ferrochelatase is not overexpressed. Similarly, Nielsen and colleagues engineered a biosynthetic pathway with just the enzymes encoded for by HemA to HemF for the purpose of PPIX overproduction, and reported no issue in production of contaminants or extraneous compounds relative to protoporphyrin IX yield [1]. We therefore anticipate that the compound produced by our strain is overwhelming the intended product, protoporphyrin IX.
Thus, building on previous work showing that excess porphyrins can be secreted into the media [3], we transformed a plasmid encoding for just 5-aminolevulinate synthase and cultured it in 250 mL of modified TB media supplemented with antibiotics and L-arabinose according to standard protocols. Using two slightly different protocols and solvent systems from previous work, we then collected the secreted porphyrins using DEAE-Sephadex A-25, an anion exchange resin. Elution of the adsorbed porphyrins from the resin allowed us to characterize the porphyrins via fluorescence and thin layer chromatography (TLC) and compare the results against that of a commercially available standard (referred to as “stock”).

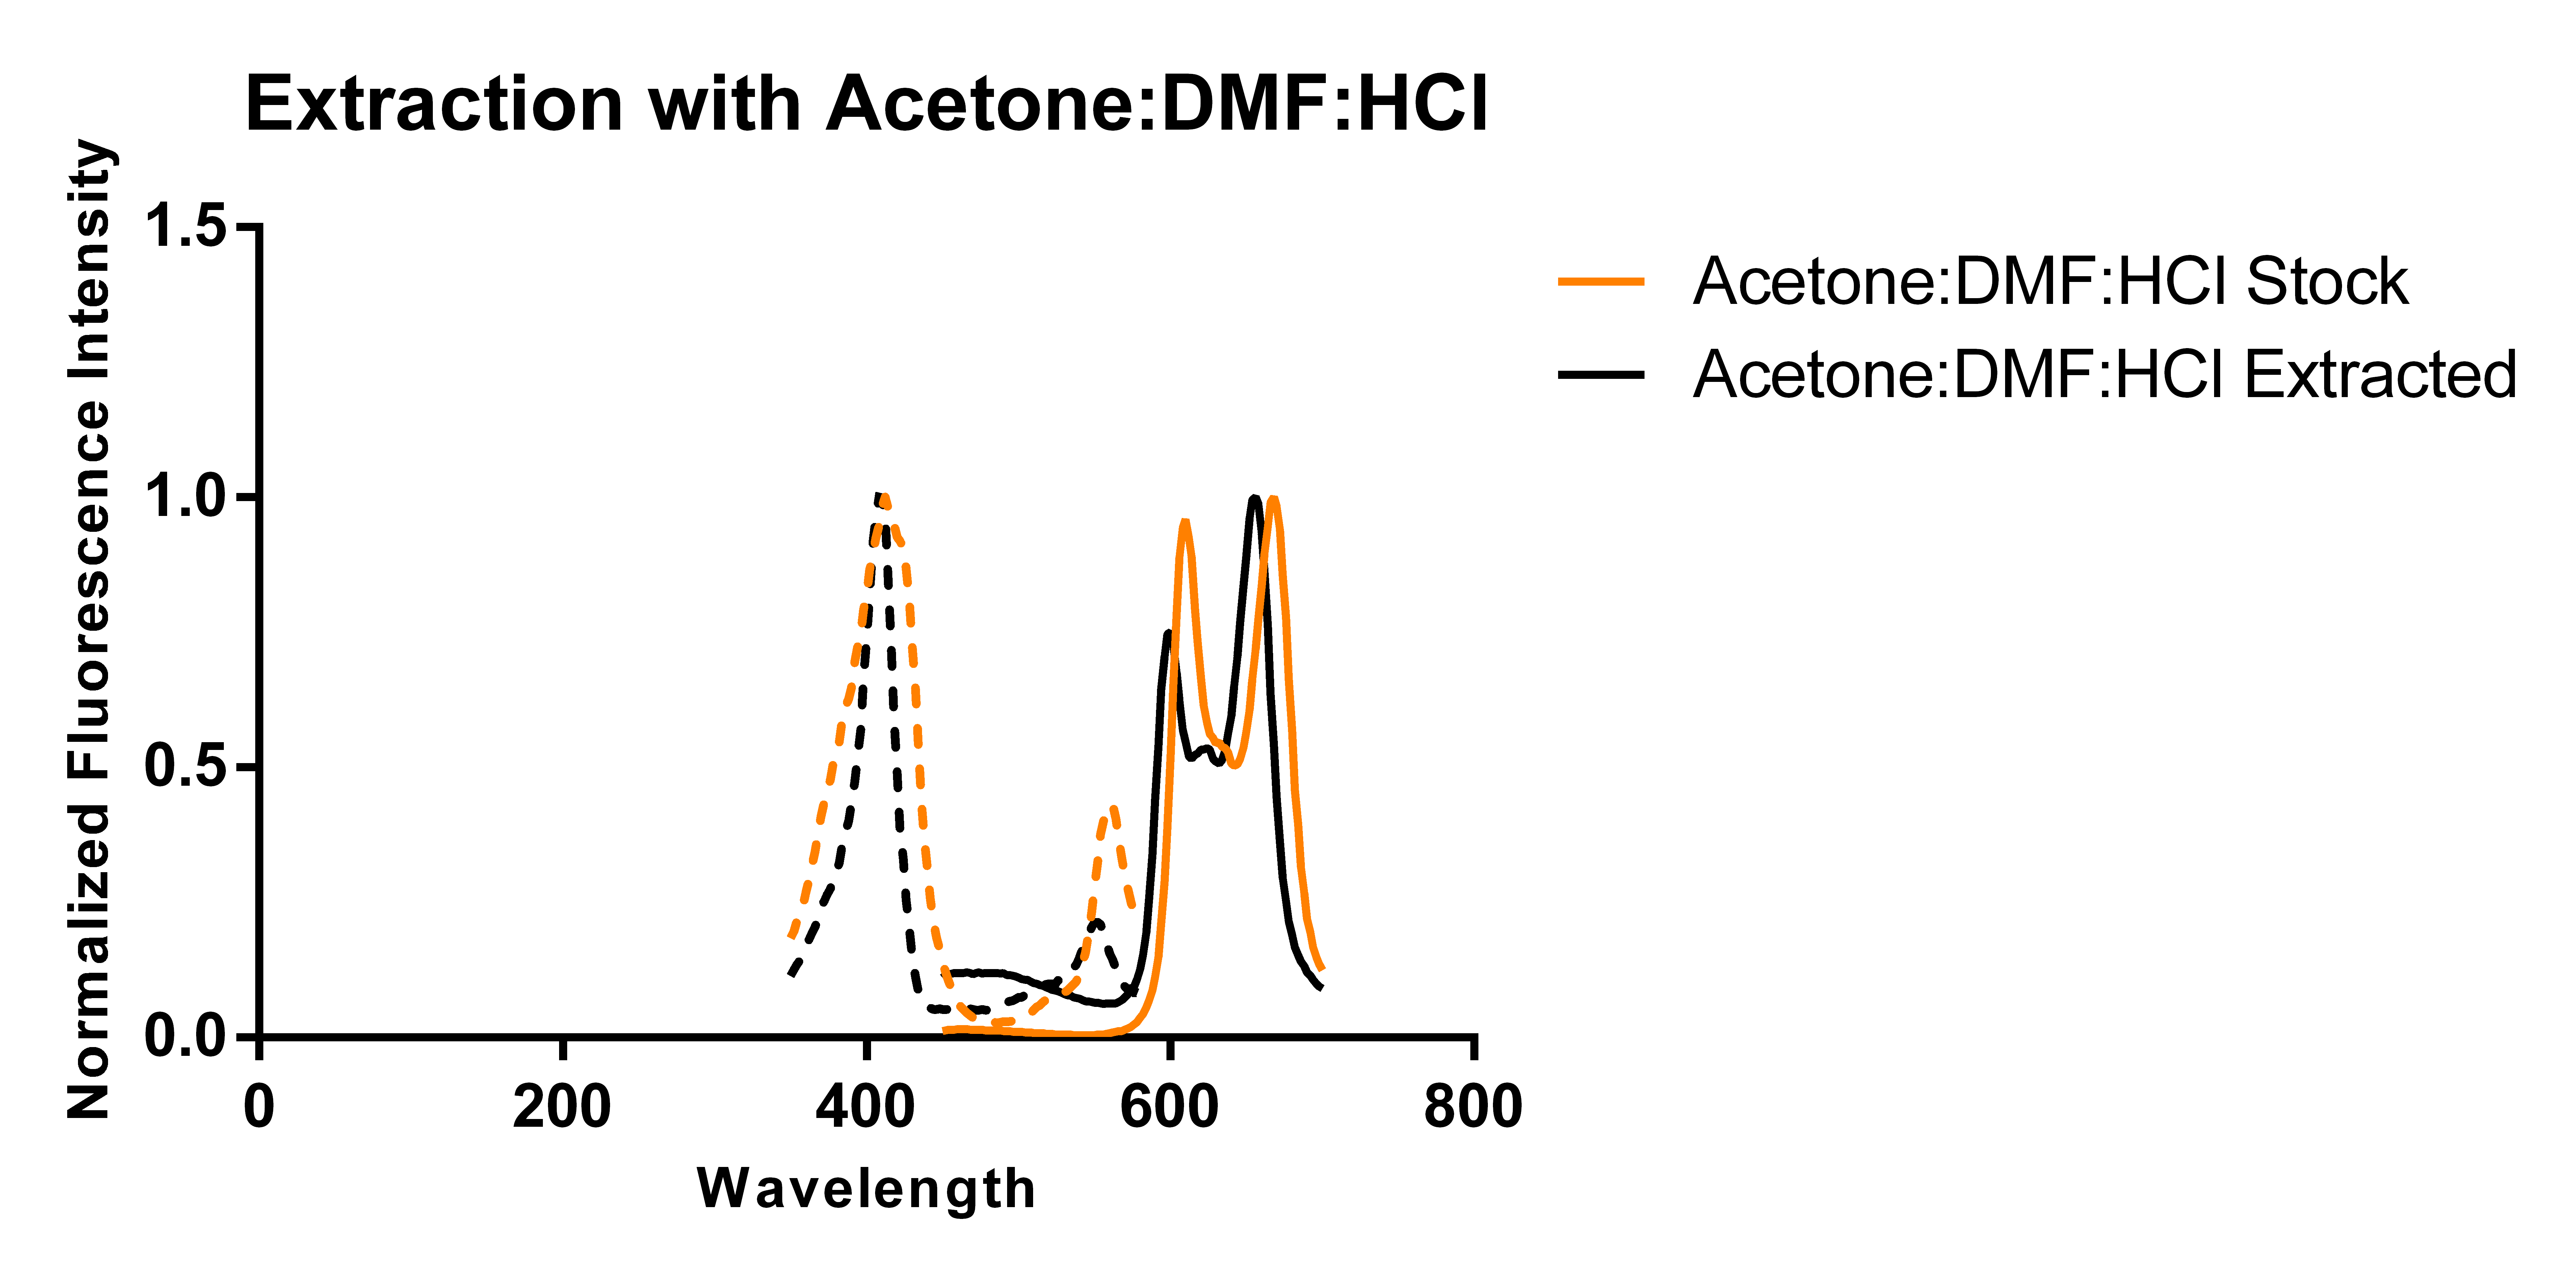
The above figures show the normalized excitation (dotted) and emission (solid) spectra of the extracted porphyrins and the stock PPIX for both extraction solvent systems. While the literature emission peak [4] for PPIX (635 nm) differs from our confirmed stock’s observed peaks (608 nm and 666 nm), we believe that this is due to significant differences in solvent polarity as values reported in literature appear to be measured in aqueous solvents, and we have been measuring ours in an organic solvent-based system. A comparison of the spectra from the two extraction protocols and solvent systems suggest that the differences in the two solvent systems used (which differ by the addition of DMF and ratios of components) does not appear to have a significant effect on the observed peaks of the spectra. As the spectra show, there is a ~12 nm difference between the emission peaks of the stock PPIX and extracted porphyrins regardless of the solvent system used. While this discrepancy may be due to the extraction of a porphyrin species that is not PPIX, it is also just as likely to be due to a slightly different chemical environment in the extracted sample resulting from incomplete removal of the aqueous-based media, and/or calibration errors. Another observation that suggests the formation of PPIX is the similar shape of the extracted porphyrins’ spectrum to that of the stock solution, with the slight distortions being most likely caused by the inner filter effect due to a high sample concentration.
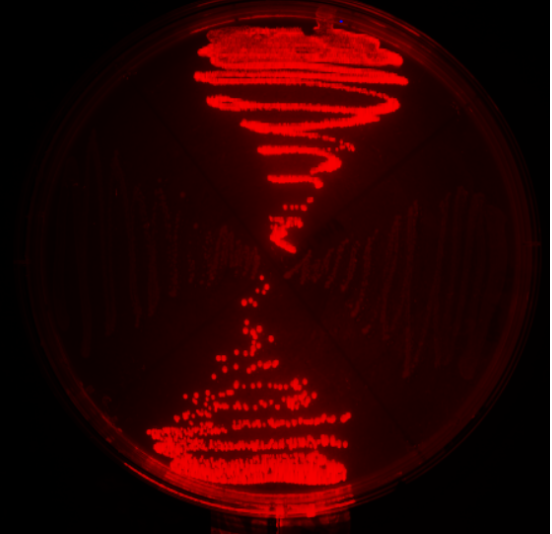
TLC is a chromatography technique that uses differences in compounds’ polarities to separate components in a mixture. Briefly, the mixture to be separated is placed on the stationary phase (silica, in this case) and the mobile phase (the solvent system) moves through the stationary phase and carries the mixture’s components in it. Each component’s polarity defines its precise interactions with the stationary and mobile phases, thus leading to varying degrees of separation (which is reported as that component’s Rf value). Our TLC protocols were adapted from a TLC solvent system defined by Kwon and coworkers [3]. As we did not have access to 1-chlorobutane, we omitted that component. The photo below show the TLC plates under UV light. We tested the stock PPIX dissolved in each extraction solvent system (lanes 1 and 3 from the left on both plates) against the porphyrins extracted using both extraction solvent system (lanes 2 and 4 from the left on both plates). A comparison of the Rf values reveals that there are two major species in each sample and in the case of the TLC, the extraction solvent affects the separation. while there are slight discrepancies in the distance travelled by the components (and consequently, Rf values) of the extracted porphyrins when compared to the stock, we do not believe these discrepancies to be significant. Both extractions were performed on aliquots of the same culture, which means that they should have the same components. Yet, these results show that in one extraction solvent system, the extracted porphyrin travels a slightly smaller distance than the stock, while in the other system, the extracted porphyrin travels slightly larger distance. Taking the results of both comparisons into consideration, we are reasonably confident that the TLC supports the formation of PPIX. Indeed, the results of the TLC minimizes the possibility of our extracted porphyrins being intermediates or derivatives of PPIX since these compounds would have drastically different polarities due to differences in functional groups and their number. It is unlikely that the isolated porphyrin is protoporphyrinogen IX, the closest compound in terms of polarity to PPIX, because the oxidation of protoporphyrinogen IX to PPIX can be catalyzed by coproporphyrinogen III oxidase in the presence of oxygen [3] and the culture was incubated in aerobic conditions. Lastly, each sample shows two major spots, indicating two major species present in each sample. Given that the second spot remains right at baseline, thus indicating very strong interactions with the polar silica, we believe that the two species in our sample are the protonated PPIX (compound that travelled up the plate) and the deprotonated PPIX.

| Lane | Rf |
|---|---|
| Stock in Acetone: DMF: HCl | 0.29 |
| Extracted in Acetone: DMF: HCl | 0.26 |
| Stock in Acetone: HCl | 0.54 |
| Extracted in Acetone: HCl | 0.54 |
Previous research suggested that the step catalyzed by 5-aminolevulinate synthase (the gene product of HemA) leads to increased PPIX production [5]. Our fluorescence measurements demonstrate that our extracted porphyrins have a similar spectrum to the spectrum collected from the stock sample, albeit with a slight shift in the emission spectrum. On the other hand, our TLC results are strongly suggestive of successful PPIX formation and extraction. Taken together, Team UAlberta believes that our results are highly suggestive of successful formation of PPIX as a result of overexpressing HemA in E. coli, in agreement with previous work.
Proteins encoded by genes HemA to HemF can drive the synthesis of PPIX from 5-Aminolevulinic Acid
Unlike the endogenous heme biosynthetic pathway, our construct does not include protoporphyrinogen oxidase, which catalyzes the conversion of protoporphyrinogen IX to PPIX. However, Kwon and colleagues found that the overexpression of coproporphyrinogen III oxidase, encoded by HemF, is sufficient for the conversion of protoporphyrinogen to PPIX in the presence of oxygen [3].
An in vitro experiment was conducted to determine whether our pathway would be sufficient to catalyze the formation of PPIX without the help of endogenous cell machinery. We used delta-aminolevulinic acid as the starting material as it is the most accessible intermediate in the pathway. From the purified proteins’ measured concentrations found in Table 2, we calculated the molarity of each enzyme solution. Then, each enzyme extraction was aliquoted and mixed in a 1:1:1:1:1:1 ratio along with 50mg of 5-aminolevulinic acid and incubated at 250 rpm at 37℃ overnight. The product was then extracted using the protocol with acidic acetone and characterized using fluorescence. As the figure below shows, the fluorescence spectrum of the extracted product is extremely similar to the spectrum of the stock PPIX. While the extracted porphyrins’ spectrum shows a third peak around 626 nm, this may be due to incomplete conversion of 5-ALA to the final PPIX. Thus, our in vitro experiment shows that while conversion appears to be incomplete, the enzymes in our engineered pathway is sufficient to catalyze the conversion of 5-ALA to PPIX.
References:
[1]M. Nielsen, K. Madsen, S. Seppälä, U. Christensen, L. Riisberg, S. Harrison, B. Møller and M. Nørholm, "Assembly of Highly Standardized Gene Fragments for High-Level Production of Porphyrins in E. coli", ACS Synthetic Biology, vol. 4, no. 3, pp. 274-282, 2014.
[2]I. Wiegand, K. Hilpert and R. Hancock, "Agar and broth dilution methods to determine the minimal inhibitory concentration (MIC) of antimicrobial substances", Nature Protocols, vol. 3, no. 2, pp. 163-175, 2008.
[3] S. J. Kwon, A. L. de Boer, R. Petri and C. Schmidt-Dannert, "High-Level Production of Porphyrins in Metabolically Engineered Escherichia coli: System Extension of a Pathway Assembled from Overexpressed Genes Involved in Heme Biosynthesis," Applied and Environmental Microbiology , vol. 69, no. 8, pp. 4875-4883, 2003.
[4] J. Hendrix, "Porphyrins and chlorophylls as probes for fluoroimmunoassays," Clinical chemistry, vol. 29, no. 5, pp. 1003-1003, 1983.
[5] E. Verderber, L. Lucast, J. Van Dehy, P. Cozart, J. Etter and E. Best, "Role of the hemA gene product and delta-aminolevulinic acid in regulation of Escherichia coli heme synthesis.", Journal of Bacteriology, vol. 179, no. 14, pp. 4583-4590, 1997.