Team:UESTC-China/Model h2


-
1. IntroductionIn order to find the best fermentation conditions of hydrogen, we designed the experiment and obtained the hydrogen production function by using the experimental data. The optimal fermentation conditions and maximum yield were obtained for the optimal solution of the function. Then we tried again under the best fermentation conditions. The result shows that the yield has obviously increased.Hydrogen is the richest and lightest element in the universe and has great potential for development. Hydrogenases catalyze one of the simplest chemical reactions, \({\rm{2}}{{\rm{H}}^{\rm{ + }}}{\rm{ + 2}}{{\rm{e}}^{\rm{ - }}} \leftrightarrow {{\rm{H}}_{\rm{2}}}\), but their structures are very complex. We try to establish the kinetic model of the hydrogen production process and verify that the modified Escherichia coli has high hydrogen production ability.
-
2. Optimization of hydrogen fermentation processSimilar to the process of butanol fermentation, hydrogen fermentation also has three factors: temperature, inoculation quantity, initial pH. The kinetic equation of hydrogen synthesis was established and the factors affecting hydrogen fermentation were analyzed to optimize the fermentation conditions of hydrogen synthesis in order to increase the production of hydrogen.
-
2.1 Experimental designThe range and standardized values of the temperature \({{\rm{x}}_{\rm{1}}}\), inoculation quantity \({{\rm{x}}_{\rm{2}}}\) and initial pH \({{\rm{x}}_{\rm{3}}}\) , are shown in the following table:Table 1 Levels of the variables of Box–Behnken design
Code Variable Low level(-1) Zero level(0) High level(+1) \[{{\rm{x}}_{\rm{1}}}\] Temperature(℃) 32 37 42 \[{{\rm{x}}_{\rm{2}}}\] Inoculation quantity(%) 0.6 1 1.4 \[{{\rm{x}}_{\rm{3}}}\] Initial pH 5 6 7 -
2.2 Model establishmentThe test points of the BBD test design and the corresponding experimental data are shown in the following table:Table 2 The Box–Behnken experimental design with three independent variables
Test number \[{z_1}\] \[{z_2}\] \[{z_3}\] \[y\](mL/36h) 1 0 0 0 1.587 2 0 0 0 1.588 3 0 0 0 1.587 4 0 1 1 1.12 5 0 1 -1 0.864 6 -1 0 1 2.139 7 1 -1 0 1.227 8 0 0 0 1.587 9 -1 -1 0 1.213 10 -1 1 0 1.857 11 1 0 -1 1.116 12 1 1 0 1.264 13 0 -1 1 1.489 14 0 -1 -1 1.242 15 -1 0 -1 1.355 16 0 0 0 1.588 17 1 0 1 1.102 Multivariate regression analysis of the experimental data was performed using Design-Expert11, and the following third-order polynomial equations were found to explain the generation of hydrogen:\[\begin{array}{c} {\rm{y}} = {\rm{1}}{\rm{.59 - 0}}{\rm{.3190}}{{\rm{z}}_{\rm{1}}}{\rm{ - 0}}{\rm{.1867}}{{\rm{z}}_{\rm{2}}}{\rm{ + 0}}{\rm{.1258}}{{\rm{z}}_{\rm{3}}}{\rm{ - 0}}{\rm{.1518}}{{\rm{z}}_{\rm{1}}}{{\rm{z}}_{\rm{2}}}{\rm{ - }}\\ {\rm{0}}{\rm{.1995}}{{\rm{z}}_{\rm{1}}}{{\rm{z}}_{\rm{3}}}{\rm{ + 0}}{\rm{.0023}}{{\rm{z}}_{\rm{2}}}{{\rm{z}}_{\rm{3}}}{\rm{ + 0}}{\rm{.0260}}{{\rm{z}}_{\rm{1}}}^{\rm{2}}{\rm{ - 0}}{\rm{.2232}}{{\rm{z}}_{\rm{2}}}^{\rm{2}}{\rm{ - }}\\ {\rm{0}}{\rm{.1854}}{{\rm{z}}_{\rm{3}}}^{\rm{2}}{\rm{ + 0}}{\rm{.3570}}{{\rm{z}}_{\rm{1}}}^{\rm{2}}{{\rm{z}}_{\rm{2}}}{\rm{ + 0}}{\rm{.0667}}{{\rm{z}}_{\rm{1}}}^{\rm{2}}{{\rm{z}}_{\rm{3}}}{\rm{ + 0}}{\rm{.1743}}{{\rm{z}}_{\rm{1}}}{{\rm{z}}_{\rm{2}}}^{\rm{2}} \end{array}\](1)The variance analysis of the regression analysis results is shown in the following table:Table 3 ANOVA of regression equation of hydrogen yieldSource Sum of Squares df Mean Square F-value P-value Model 0.0522 12 0.0043 7398.36 < 0.0001 \[{z_1}\] 0 1 0 107.2 < 0.0001 \[{z_2}\] 0.0012 1 0.0012 2454 < 0.0001 \[{z_3}\] 0.0188 1 0.0188 3753 < 0.0001 \[{z_1}{z_2}\] 0.0006 1 0.0006 1250 < 0.0001 \[{z_1}{z_3}\] 0 1 0 4.5 < 0.0001 \[{z_2}{z_3}\] 0.0004 1 0.0004 722 < 0.0001 \[{z_1}^2\] 0.0135 1 0.0135 27001.18 < 0.0001 \[{z_2}^2\] 0.0012 1 0.0012 2398.03 < 0.0001 \[{z_3}^2\] 0.0003 1 0.0003 590.66 < 0.0001 \[{z_1}{z_2}{z_3}\] 0.0038 1 0.0038 7569 < 0.0001 \[{z_1}^2{z_3}\] 0.0067 1 0.0067 13340.25 < 0.0001 \[{z_1}{z_2}^2\] 0.0005 1 0.0005 930.25 < 0.0001 Pure Error 0 4 0 Cor Total 1.58 16 Coefficient of determination \[{R^2} = 0.9997\] Adequate Precision=167.3256 The variance analysis of the regression analysis results is shown in the following table: the F value of the model is 7398.36, P<0.0001, indicating that the model fits well, and the model's goodness of fit \({R^2}\) is 0.9998, indicating that the regression model 99.98% explains the response. Only 0.02% of the model's changes cannot be explained by the model. Moreover, accuracy is used to describe the signal-to-noise ratio of the model. The signal-to-noise ratio is 167.3256. Usually, the ratio is greater than 4, and the model can be applied to guide the experimental design and also to indicate an accurate signal. From the significant coefficients of the regression model, it was found that each factor had a significant effect on the yield of hydrogen. -
2.3 Model optimizationThe optimization of the model makes the partial derivative of the equation, and the derivative is 0, which constitutes a ternary equation system. By solving the equations, the optimal fermentation conditions are obtained. The optimal results of the model: the temperature was 30.222 ° C, the initial substrate concentration was 1.128 %, the initial pH was 6.868, and the maximum yield of hydrogen was 2.162 mL / 36h.The kinetic response surface of hydrogen synthesis, the three-dimensional response surface and the corresponding two-dimensional contour map are shown in Fig. 1. The figure shows that three levels of each of the two independent factors explore their effect on hydrogen synthesis in an optimal range. It can be seen from the figure that each response surface has a distinct peak, indicating that the optimal fermentation conditions for hydrogen are within the selected experimental design range.Figure(a) and (b) show the effect of initial substrate and temperature on hydrogen fermentation. Hydrogen production increased first and then decreased with the increase of temperature. Similarly, hydrogen production increased first and then decreased with the increase of initial substrate. The amount of hydrogen biosynthesis is more affected by the initial substrate than the temperature. Figure(c) and (d) show the effect of initial pH and temperature on hydrogen fermentation. Hydrogen production increased with the increase of initial pH. The amount of hydrogen biosynthesis is more affected by the initial pH than the temperature. Figure(e) and (f) show the effect of initial substrate and initial pH on hydrogen fermentation. The amount of hydrogen biosynthesis is more affected by the initial substrate than initial pH.In summary, the three independent factors affect the size of butanol: initial substrate concentration > initial pH > temperature. Only when these three significant influence factors are in the optimal region, the amount of hydrogen synthesis can be maximized.
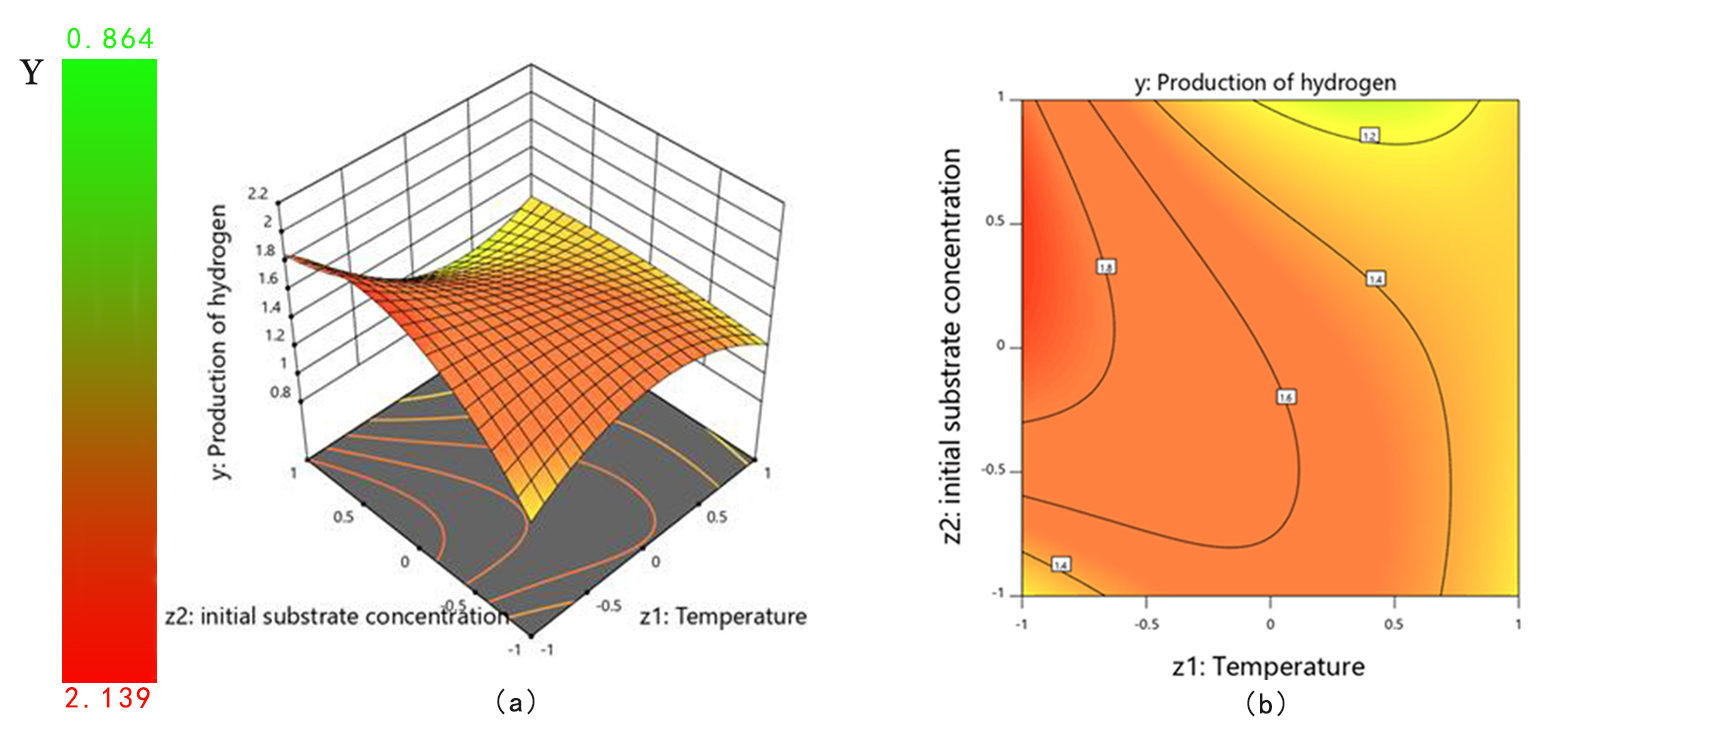
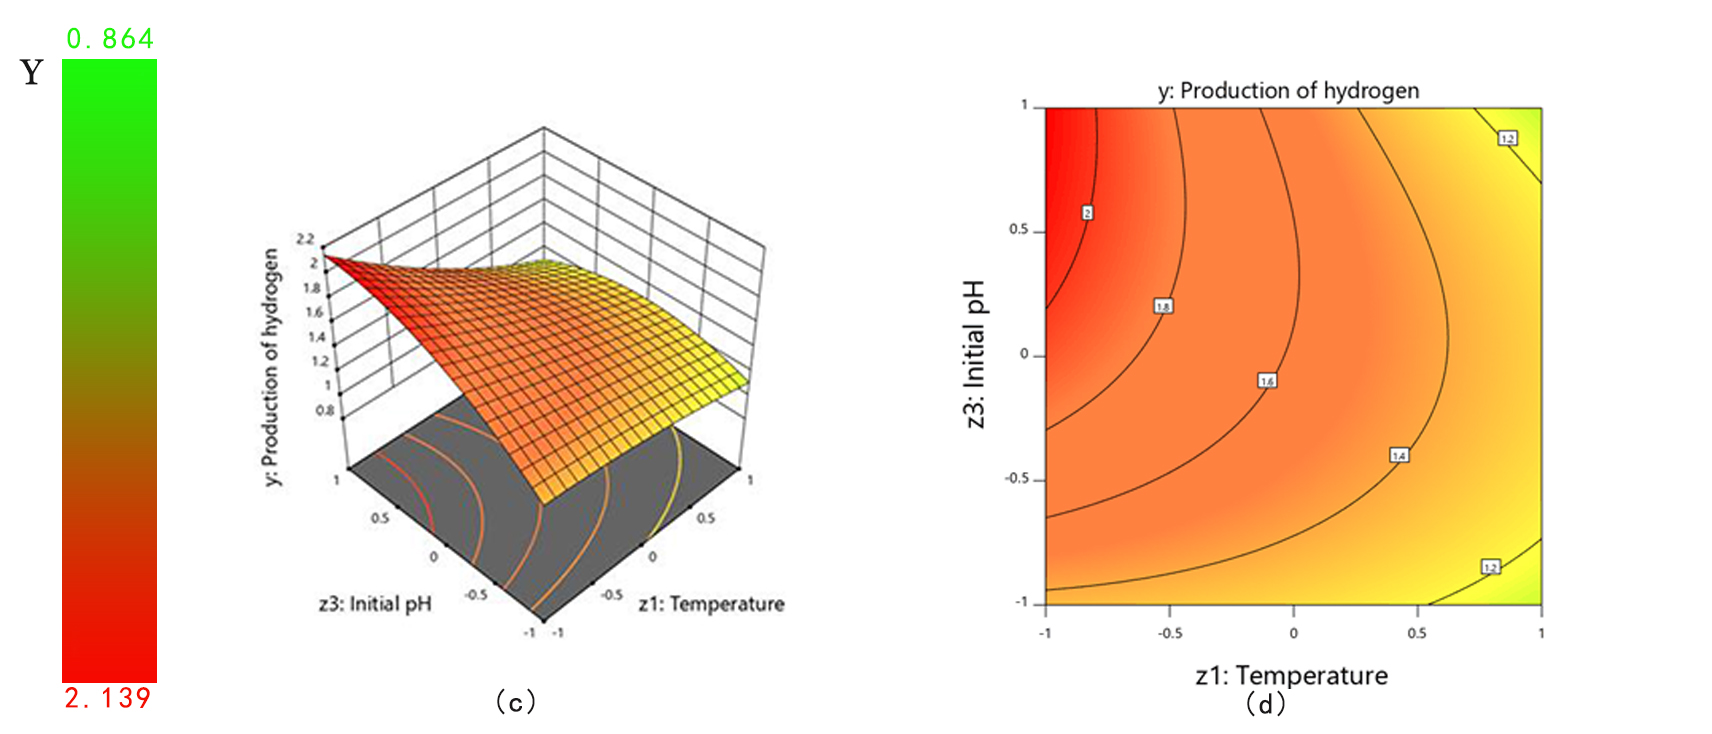
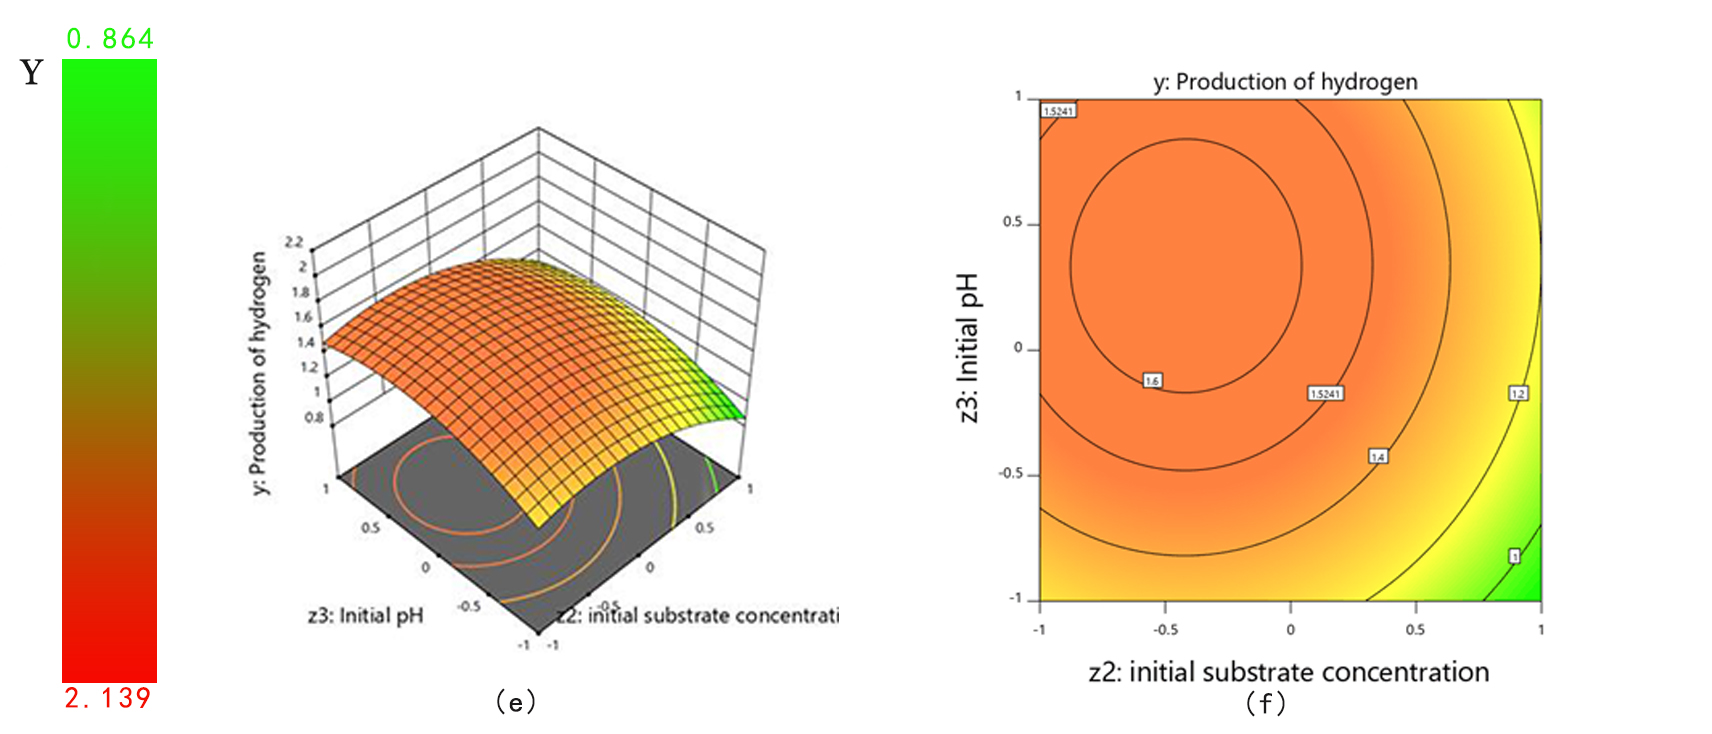 Fig. 1 Response surface and contour plots for hydrogen production
 -
2.4 Model verificationIn order to verify the effectiveness of the optimization results, we conduct experiments again under the optimal conditions. We use the optimal conditions in the literature as a comparison [1]. The verification results are shown in Fig. 2. Hydrogen production under optimal conditions reached a maximum of 1.648mL after 36h, which was 41.70% higher than the hydrogen production under conditions in the literature. This shows that our model is effective in improving the hydrogen fermentation system.
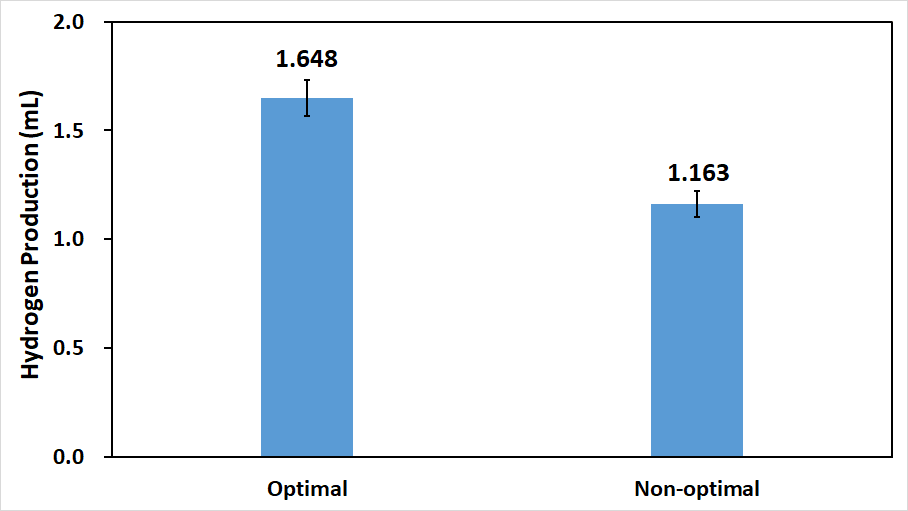 Fig. 2 Comparison of hydrogen production between the optimal conditions and the conditions in the literature.The hydrogen production contrast between optimal and non-optimal. The optimal fermentation conditions are as follows: temperature is 30 ℃, initial concentration is 1.13%, initial pH is 7. The non-optimal fermentation conditions are as follows: temperature is 37 ℃, initial concentration is 1%, initial pH is 6.
 -
3. Molecular dynamics modelHydrogenase catalyzes one of the simplest chemical reactions,\({\rm{2}}{{\rm{H}}^{\rm{ + }}}{\rm{ + 2}}{{\rm{e}}^{\rm{ - }}} \leftrightarrow {{\rm{H}}_{\rm{2}}}\), but their structure is very complex [2]. So we consider simplifying the model. A molecular dynamics model was established to simulate the hydrogen production process. By comparing the theoretical hydrogen production with that in other literatures, it is proved that the hydrogen production of our constructed Escherichia coli is relatively high.
-
3.1 Basic modelBecause the hydrogenase catalytic reaction is very complex, we simplify the reaction to the enzymatic redox reaction shown below.
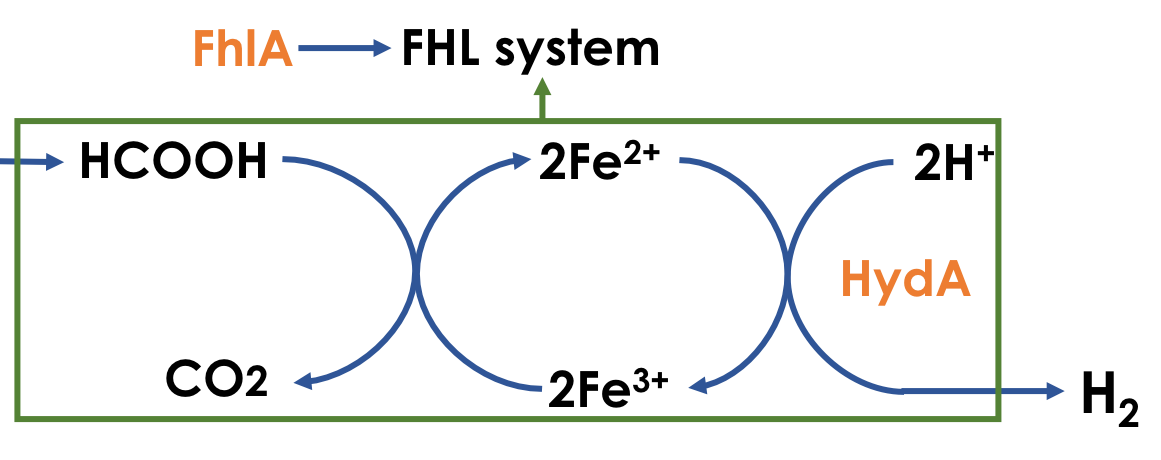 Fig. 3 Schematic diagram of hydrogenase catalytic reactionThis reaction can be written as follows:
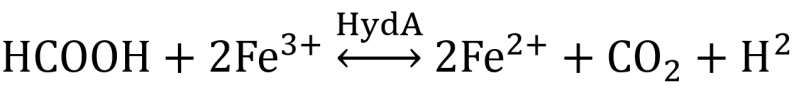 \[{v_{{{\rm{H}}_{\rm{2}}}}} = \frac{{d\left[ {{{\rm{H}}_{\rm{2}}}} \right]}}{{dt}} = \frac{{k_{cat}^{Hyda} \cdot \left[ {{\rm{HCOOH}}} \right] \cdot \left[ {Hyda} \right]}}{{k_{cat}^{Hyda} + \left[ {{\rm{HCOOH}}} \right] \cdot \left( {1 + \frac{{\left[ {{{\rm{H}}_{\rm{2}}}} \right]}}{{k_i^{{{\rm{H}}_{\rm{2}}}}}}} \right)}}\]
 -
3.2 Model solution and analysisUsing MATLAB 2014a to solve the above differential equations, the following parameters are used:Table 4 Parameters in biochemical reaction Model for hydrogen production
Parameter Variable Name Value Reference Michaelis Constant for HydA \[k_m^{Hyda}\] 800mM [3] Catalysed rate of reaction for HydA \[k_{cat}^{Hyda}\] 29000s^(-1) [3] Inhibition constant for \({{\rm{H}}_{\rm{2}}}\) \[k_i^{{{\rm{H}}_{\rm{2}}}}\] 16 mM [3] The result is shown in Fig. 4: the maximum hydrogen production is 1.63mmol/g(gulose),Hydrogen production rate per unit conversion is 1.8 \(\mu {\rm{mol}}\)(mg protein) \(^{{\rm{ - 1}}}{{\rm{h}}^{{\rm{ - 1}}}}\).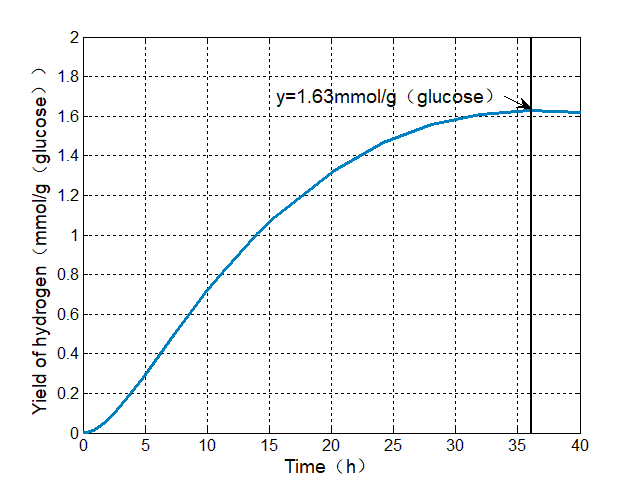 Fig. 4 Predicted hydrogen production curveBy comparing the results with the butanol production in other literatures, it is found that the hydrogen production of the constructed bacteria is in a high position.Table 5 Comparison of in vivo hydrogen production by heterologous recombinant Escherichia coli strains
System \({{\rm{H}}_{\rm{2}}}\) production rate (converted units) Reference Expression of the Ralstonia eutropha SH operon 0.3μmol\({{\rm{H}}_{\rm{2}}}\) (mg protein)\(^{ - 1}{{\rm{h}}^{{\rm{ - 1}}}}\) [4] Expression of [NiFe]-hydrogenase 2 from Citrobacter sp. SG 2.6μmol\({{\rm{H}}_{\rm{2}}}\) (mg protein)\(^{ - 1}{{\rm{h}}^{{\rm{ - 1}}}}\) [4] Expression of HxEFUYH hydrogenase and the maturation proteins HypABCDEF and HoxW from Synechocystissp. PCC 6803 0.004μmol\({{\rm{H}}_{\rm{2}}}\) (mg protein)\(^{ - 1}{{\rm{h}}^{{\rm{ - 1}}}}\) [4] -
4. References[1]Chittibabu G, Nath K & Das D. 2006. Feasibility studies on the fermentative hydrogen production by recombinant Escherichia coli BL-21. Process Biochemistry, 41: 682-688.[2]Vardar‐Schara G, Maeda T & Wood TK . 2008. Metabolically engineered bacteria for producing hydrogen via fermentation. Microbial Biotechnology, 1: 107–125.[3]Liebgott PP, Leroux F, Burlat B, Dementin S, Baffert C, Lautier T, Fourmond V, Ceccaldi P, Cavazza C, Meynial-Salles I, Soucaille P, Fontecilla-Camps JC, Guigliarelli B, Bertrand P, Rousset M & Léger C. 2009. Relating diffusion along the substrate tunnel and oxygen sensitivity in hydrogenase. Nature Chemical Biology, 6:63-70.[4]Maeda T, Tran KT, Yamasaki R & Wood TK . 2018. Current state and perspectives in hydrogen production by Escherichia coli: roles of hydrogenases in glucose or glycerol metabolism. Applied Microbiology and Biotechnology,102: 2041-2050.
Copyright © 2018 iGEM UESTC-China