Team:UESTC-Software/Model

Overview
We spend a lot of time and energy to construct our models, which played an important role in both parts of our project. For database integration, the first step of integration is to find the entry corresponding to the biobrick in the database to be integrated. For this we use the ncbi BLAST tool. However, the original BLAST matching results are not usable, since there are problems like redundancy and low similarity. In order to screen the BLAST results, we used JS divergence for feature extraction and innovatively employed logistic regression classifier with polynomial features to classify BLAST results, which performed pretty well. For promoter prediction, we used machine learning method to construct promoter classifier. Then, we constructed multiple classifier system to improve the performance. With large-scale search model, we can identify promoter in a large-scale sequence. With these, we constructed a promoter prediction model that can be used in both of prokaryote and eukaryote, which benefit biologists to find more promoters.
Get the power of BLAST
Introduction
NCBI BLAST is one of the most well-known tools in the field of nucleic acid and protein sequence alignment. In order to efficiently analyze a large number of sequence data, we chose the local version: BLAST+2.7.1 as our sequence alignment tool [1]. The raw BLAST results are not usable, since there are redundancy and not all of the matched items are in high similarity, so we developed this model to select the trustworthy matches, then treating these matching sequences as identical or homologous sequences, and then performing subsequent information docking extensions. Through our manual sampling test, the two sequences matched by the BLAST have a high degree of consistency in function, so the accuracy of data expansion can be guaranteed to some extent.
BLAST results
BLAST+ provides 18 output formats, in order to simplify the procession, we choosed the tabular format. Here is part of the BLAST results:
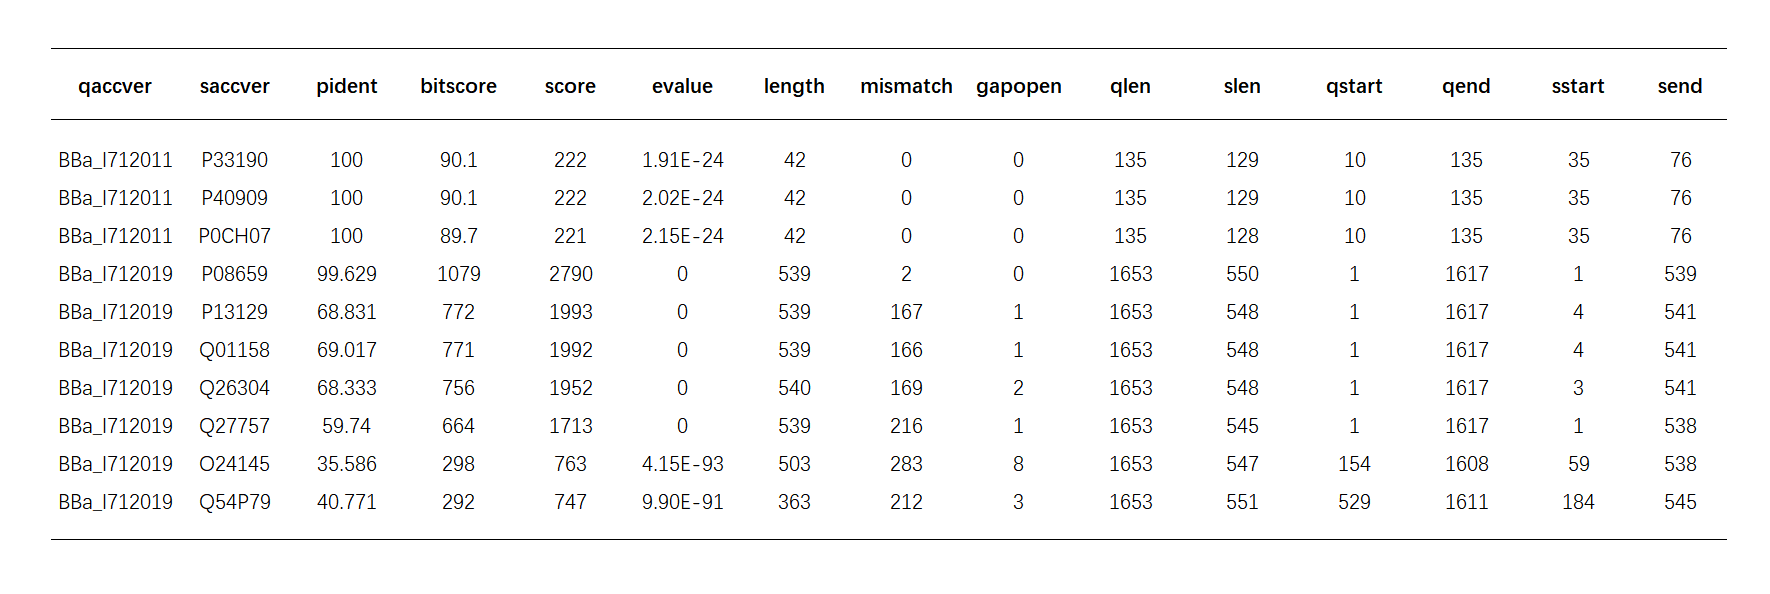
Table.1.BLAST results
Important values in BLAST
Score -- sum of the scores in the traceback process of alignment, it directly indicates the similarity of two sequences. Higher score corresponds to higher similarity.
Evalue -- the expected number of HSPs(high score pairs) with score at least S. It’s the main threshold that can be used to limit the BLAST output. The smaller the evalue, the less the number of HSPs, and correspondingly, the higher the similarity of the two sequences.
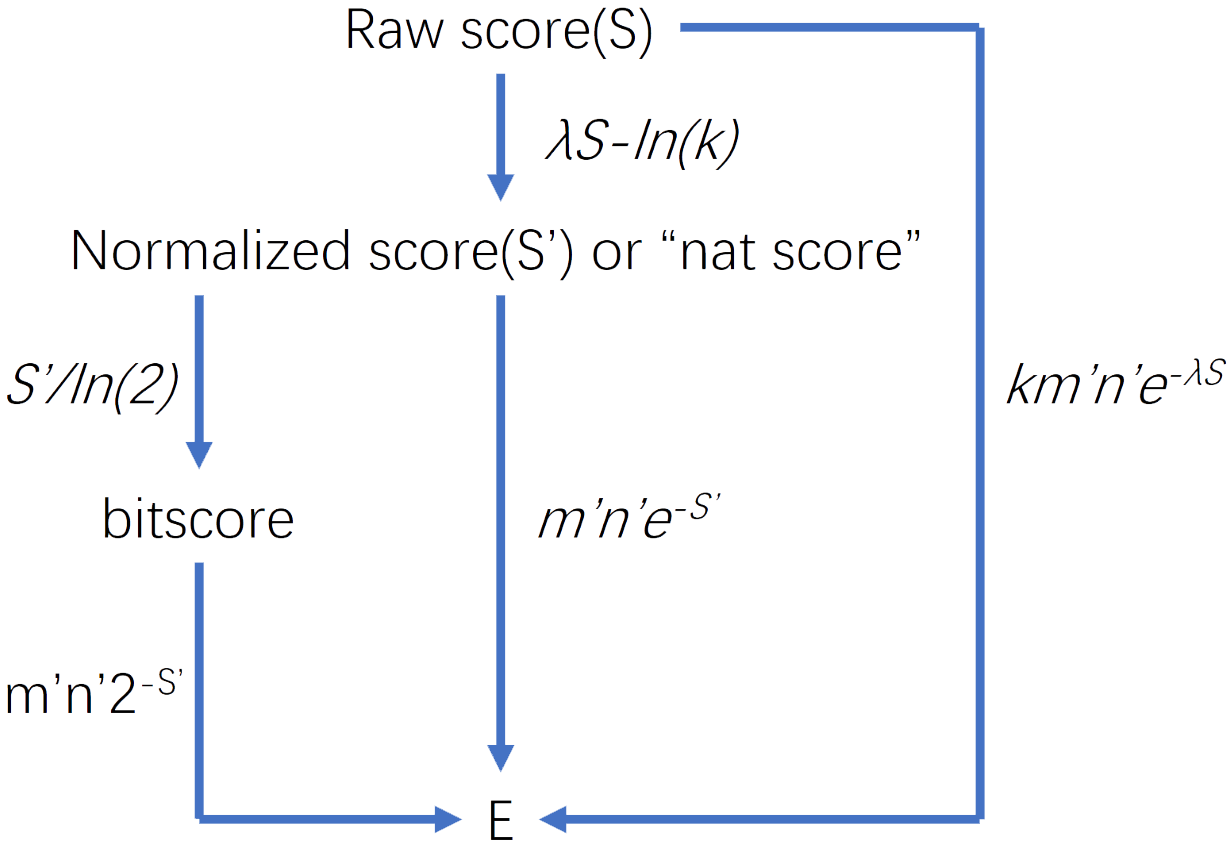
Fig.1.BLAST parameters
Calculating: \(E=Kmne^{-\lambda S}\)
Where: m and n are the lengths of the sequences aligned. K and lambda can be thought of simply as natural scales for the search space size and the scoring system respectively. [2]
pident -- Percentage of identical matches, besides which is the mismatch area and gaps in the alignment area
length-- Alignment length
qlen-- length of query sequence
Screening the BLAST results
Problems
Protein coding sequences is a big category in iGEM parts database, which contains 8454 parts(the total number of parts in the database is less than 30,000) and has longer sequence than other kind of parts on average. It’s both important and difficult for us to BLAST.
when doing BLAST between iGEM parts database and uniprot database to match the high similarity items, we’ve set the evalue to 1e-6. However, by artificial validation we’ve found that many of the matched pairs in the BLAST output is in low similarity in function or even have nothing to do with each other, which means the match is misleading.
Despite all of the matched pairs has evalue pretty low(most of them are far lower than 1e-6),but the ‘pident’ of them are varying from 19% to 100%, and the value of length/qlen is varying from a very low number to 100%--which badly needed filtrating.
There are several facts important for analyzing the BLAST results:
1. Homologous:
According to the theories of evolution, similarity of DNA sequence between different organisms is very common, and the level of similarity is related to the evolutionary distance; hence, the similar sequence identified by BLAST may be the homologous gene in two different species, most of which are similar in function.
2. Allele:
Even for one given gene in the same species, there may be several variant forms, which is called allele. Different alleles are highly similar in sequence, but they can result in different observable phenotypic traits, such as different pigmentation.
Characteristics of the coding sequences in the iGEM database:
1. Most of them are artificially modified or cut from existing proteins, in this case, the BLAST result is pretty nice.
2. Synthetic sequences: artificially constructed sequences, almost have no similar protein coding sequences.
3. Combined with several protein coding sequences’ fragments. In this case, one query sequence may hit several different nonhomologous proteins, but the similarity of every hit is not high.
4. Redundant and mistakes in the biobricks’ sequences: As is mentioned by many papers, redundant and even mistakes are possibly appearing in the biobricks’ sequences, which is a big trouble for us to recognize the right sequence when integrating other databases with the iGEM database.
Solution
Preliminary screening
As the BLAST results are given in descending order of the similarity, we choose the first hit of every specific fragment in a gene as the probable match and abandon the others.
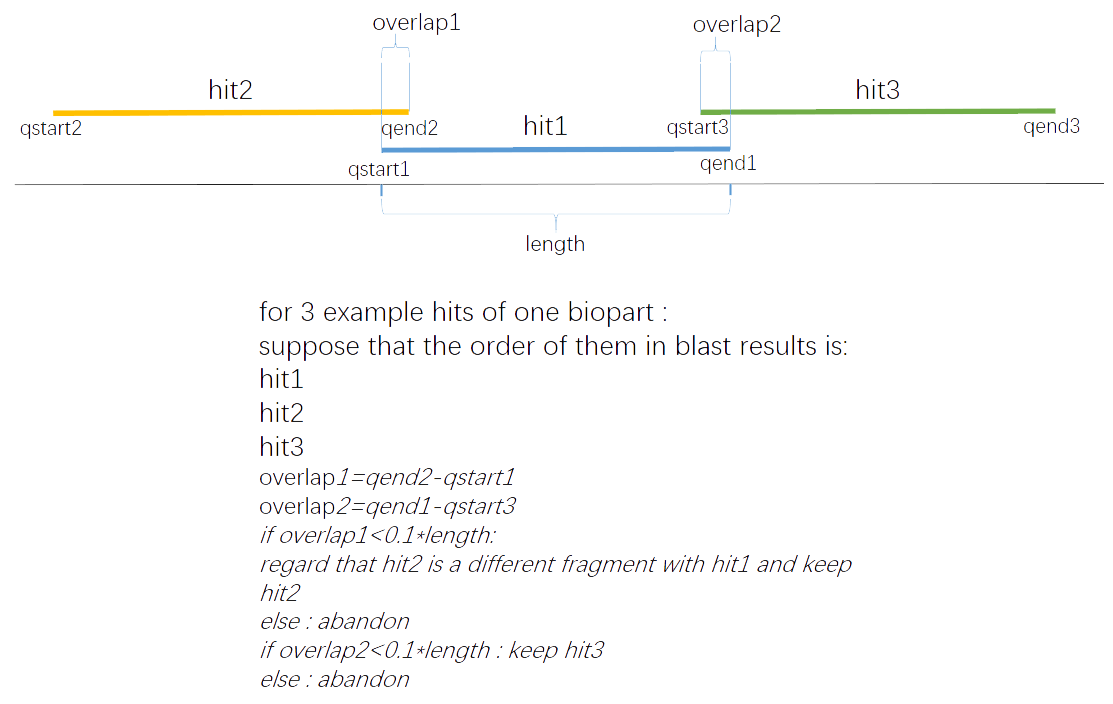
Fig.2.Preliminary screening
By doing this, the amount of the results has been reduced to 8000+ while the origin amount is 61000+
Logistic regression classifying
Linear regression is a basic regression algorithm. For a regression problem:
\(Y=X\cdot W+\varepsilon\)(1)
Where:
$$X=[x_1,\ x_2,\ x_3,\ ...,\ x_n]^T$$\(W=[w_1,\ w_2,\ w_3,\ ...,\ w_n]^T\)(2)
$$\varepsilon=[\varepsilon_1,\ \varepsilon_2,\ \varepsilon_3,\ ...,\ \varepsilon_n]^T$$The aim is to search for the best W that minimize the mean of e.
With the help of logistic function: \(Logistic(z)=\frac{1}{1+\mathbf{e}^{-z}}\),logistic regression is created to solve classification problem.
probability to be ‘1’:
\(\hat p=\sigma(\theta^T \cdot x_b)=\frac{1}{1+\mathbf{e}^{-{\theta^{T \cdot x_b}}}}\)(3)
Where:
$$\theta^T=[\theta_1,\ \theta_2,\ \theta_3,\ ...,\ \theta_m]$$\(x_b=[x_1,\ x_2,\ x_3,\ ...,\ x_m]\)(4)
label:
\(\hat y=\begin{cases} 1,\ \hat p>0.5\\ 0,\ \hat p<0.5\\ \end{cases} \)(5)
cost function:
\(J(\theta)=-\frac{1}{m}\displaystyle\sum_{i=1}^m y^{(i)}\log(\hat p^{(i)})+(1-y^{(i)})\log(1-\hat p^{(i)})\\ =-\frac{1}{m}\displaystyle\sum_{i=1}^m y^{(i)}\log(\sigma(-X_b^{(i)}\theta))+(1-y^{(i)})\log(1-\sigma(-X_b^{(i)}\theta))\\ \)(6)
Regularization:
Overfitting is a disturbing problem in machine learning, using penalty can help reduce it significantly.
Cost with L1 penalty: \(cost=C \cdot J(\theta)+||\theta^T||\)
Cost with L2 penalty: \(cost=C \cdot J(\theta)+0.5\min{||\theta^T||}^2\)
(C is a coefficient used to regulate the degree of regularization)
Coordinate descent:
The core task of this classifier is to minimize the cost function, coordinate descent is one of the methods. After trying several methods we've found that coordinate descent algorithm is the most appropriate one for our issue.
Given a differentiable convex function \(f:\mathbb{R}^n \to \mathbb{R}\) , this method assumes that if there’s a value x0 that minimize the f(x) on each coordinate, then f(x0) is the minimum value of this function.
Coordinate descent starts with initial variable values: \(x=(x_1^0,\ x_2^0,\ x_3^0,\ ...,\ x_n^0)\), then loop k times for every coordinate respectively to find the minimum value.
\(x_1^{(k)}\in \displaystyle{\arg\min}_{x_1}{f(x_1,\ x_2^{(k-1)},\ x_3^{(k-1)},\ ...,\ x_n^{(k-1)})}\\ x_2^{(k)}\in \displaystyle{\arg\min}_{x_2}{f(x_1^{(k)},\ x_2,\ x_3^{(k-1)},\ ...,\ x_n^{(k-1)})}\\ x_3^{(k)}\in \displaystyle{\arg\min}_{x_3}{f(x_1^{(k)},\ x_2^{(k)},\ x_3,\ ...,\ x_n^{(k-1)})}\\ ......\\ x_n^{(k)}\in \displaystyle{\arg\min}_{x_n}{f(x_1^{(k)},\ x_2^{(k)},\ x_3^{(k)},\ ...,\ x_n)}\\ \)(7)
Polynomial features
original logistic regression is limited to linear situation, however, our problem is a nonlinear one. Polynomial features can help to make the decision boundary more complex that can fit the training sample better.
(1)Feature extraction
BLAST output provides more than 10 parameters, but not all of them are important for similarity screening, such as sites and sequence length. At the same time, some of the parameters are closely related to each other, so the features used for training don’t need to contain all of them.
To select features with high information content, we used JS divergence(Jensen-Shannon divergence). JS divergence is a method to measure the similarity of two probability distributions.
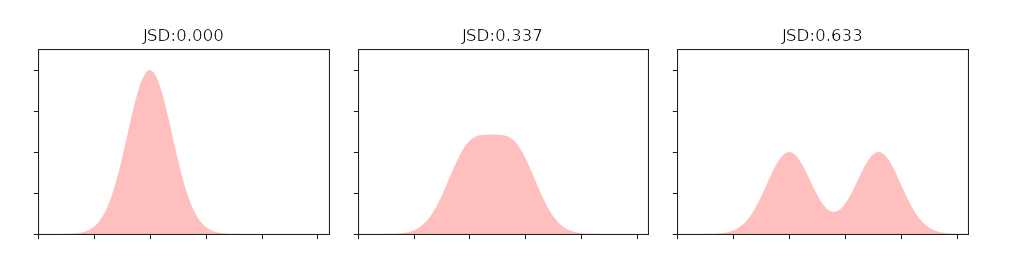
Fig.3.Relationship between JS divergence and similarity
We divided the continuous numerical features into discrete segments, and the frequencies in which the different segments appear in the positive and negative samples were taken as the corresponding probabilities, and calculated the JS divergence. The greater the JS divergence of the feature, the greater the impact on the classification result, in other words, the more important the feature is. We arranged all features in descending order of JS divergence values. The result is as follow:

Table.2.JS divergence of BLAST parameters
Finally, according to the JS divergence order, the correlation between features and the specific requirements of screening, the following three parameters are selected:
1.int_evalue=-\(\log_{10}\)(evalue)
Evalue is the main threshold parameter, unfortunately the value, which varying from 1e-6 to 0,is too small for SVM to do classification. To solve this, we use the int_evalue to replace it.
2.pident
int_evalue limits the similarity of the hits by control the probability of the hits’ appearance in the whole searching space, for every specific hit, we use pident.
3.pqlen=length/qlen
To filtrate the short fragments, we bring in the ratio parameter pqlen.
High similarity requires high value of all three parameters
(2) Constructing training set
We‘ve randomly chose 1/10 items from BLAST result and identified them by manually comparing the consistency of the two sequences in the databases they belong to, with labeling the idented items with 1 and unidented with 0.
(3) Training
Sklearn is a well-known machine learning package for python, which is powerful and convenient to use, we use it to do our classification. [3][4]
gridsearch
We use gridsearch strategy to search for the optimal parameters, for coding sequence, the result is: degree=3,C=0.44,penalty=l1, which make the accuracy of 3-fold cross validation reach up to 0.985.
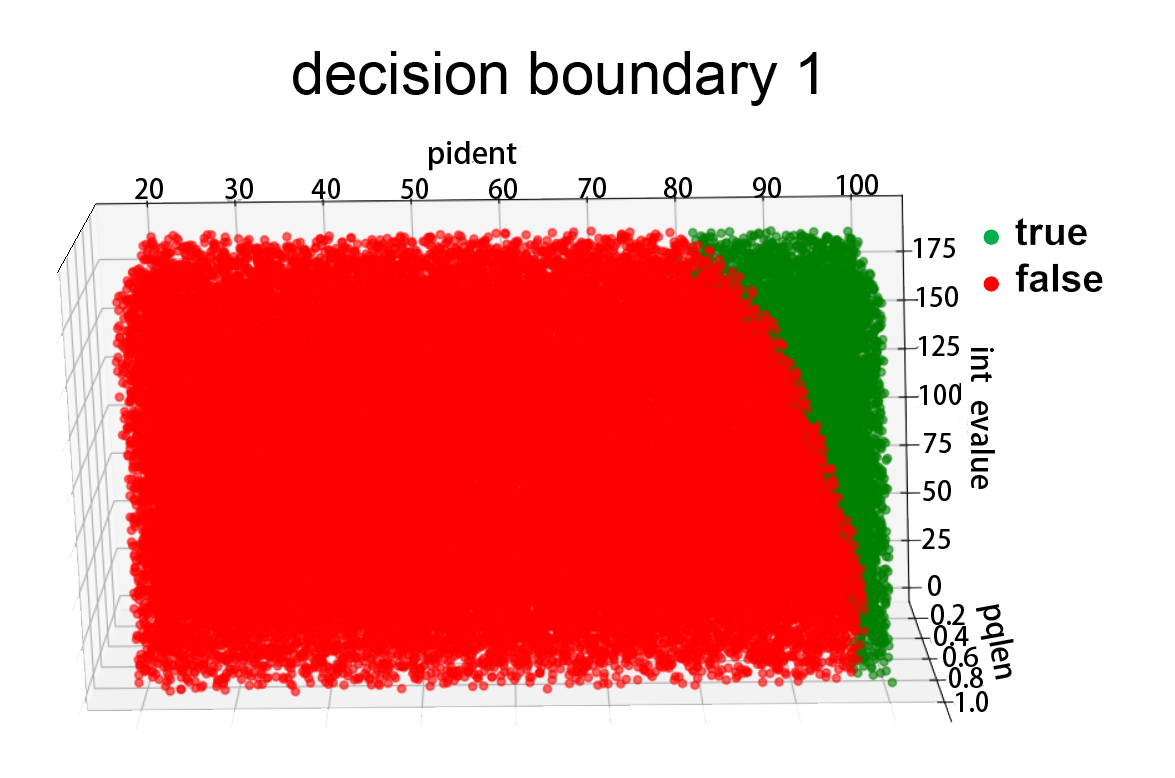
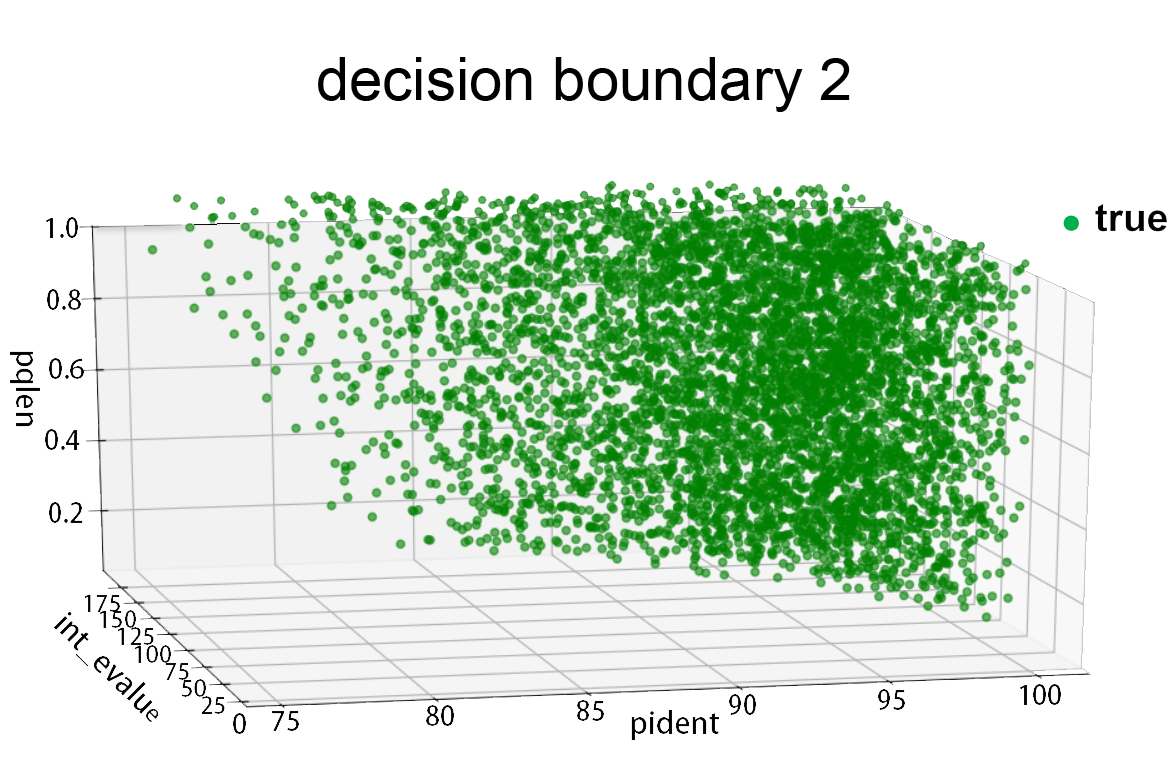
Fig.4.Decision boundary
Result
The result of 3 fold cross-validation shows the accuracy of this model reaches up to 0.985. For coding sequence, we labeled the 8590 items after the preliminary screening with this model and get the result as follows: True:6404 False:2186
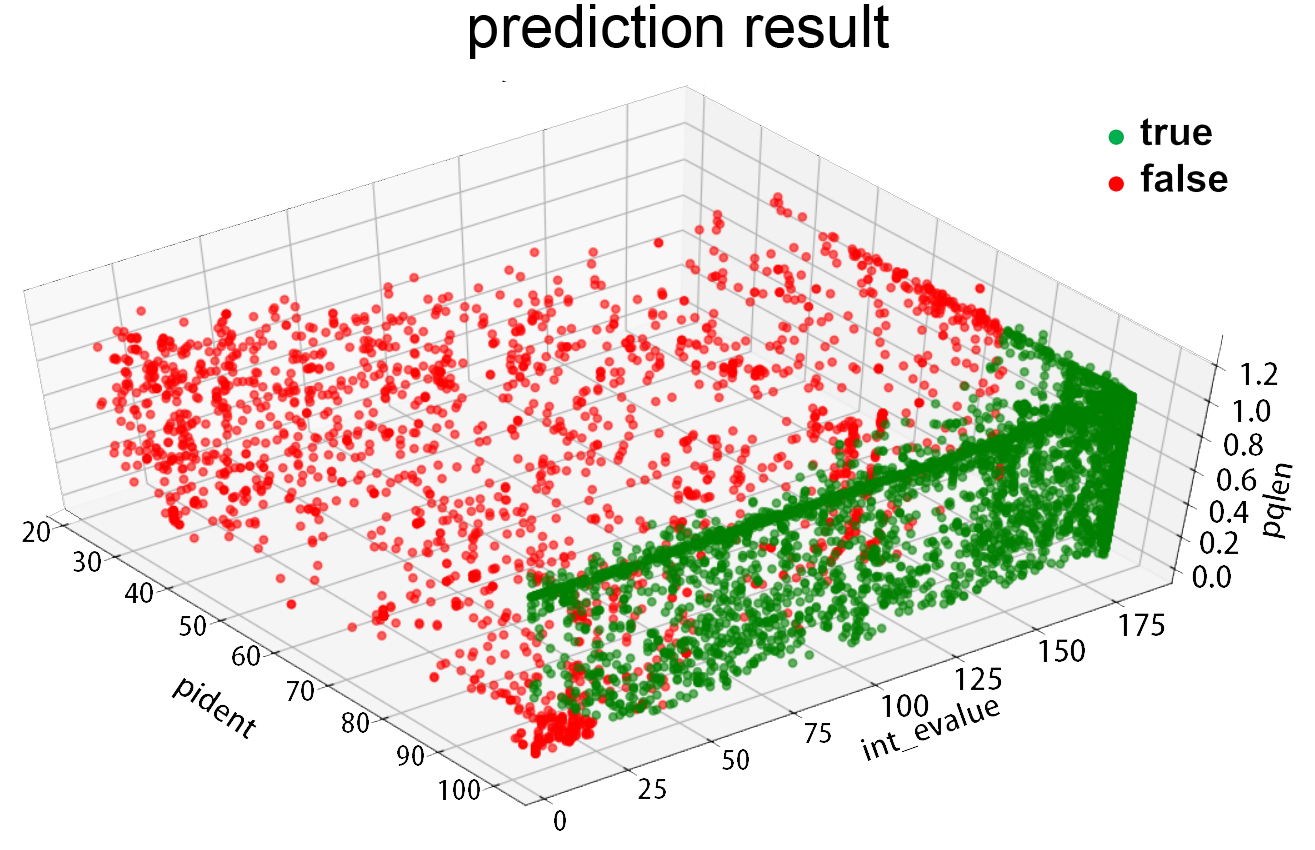
Fig.5.Prediction result
We compared this classifier with SVM(support vector machine) classifier, the 3-fold validation accuracy of SVM classifier is around 0.93, lower than the value of logistic regression classifier(about 0.98). We plotted the ROC(receiver operating characteristic) curve of this two classifier, the result is as follows:

Fig.6.ROC curve
The AUC(Area Under roc Curve) value of logistic regression classifier is 0.99, while the number of SVM(support vector machine) is 0.94, which shows that the former one is better.
Prediction Model
CNN
Based on the LeNet-5 structure, we constructed a convolutional neural network to predict promoter. Through the movement of the convolution kernel on the input data, it will extract the most basic features.
The DNA sequence converted by the One-Hot Encoding input to the convolutional layer for feature extraction. After the internal weight calculation, the final result will be presented in the last two neurons, corresponding to the promoter and the non-promoter
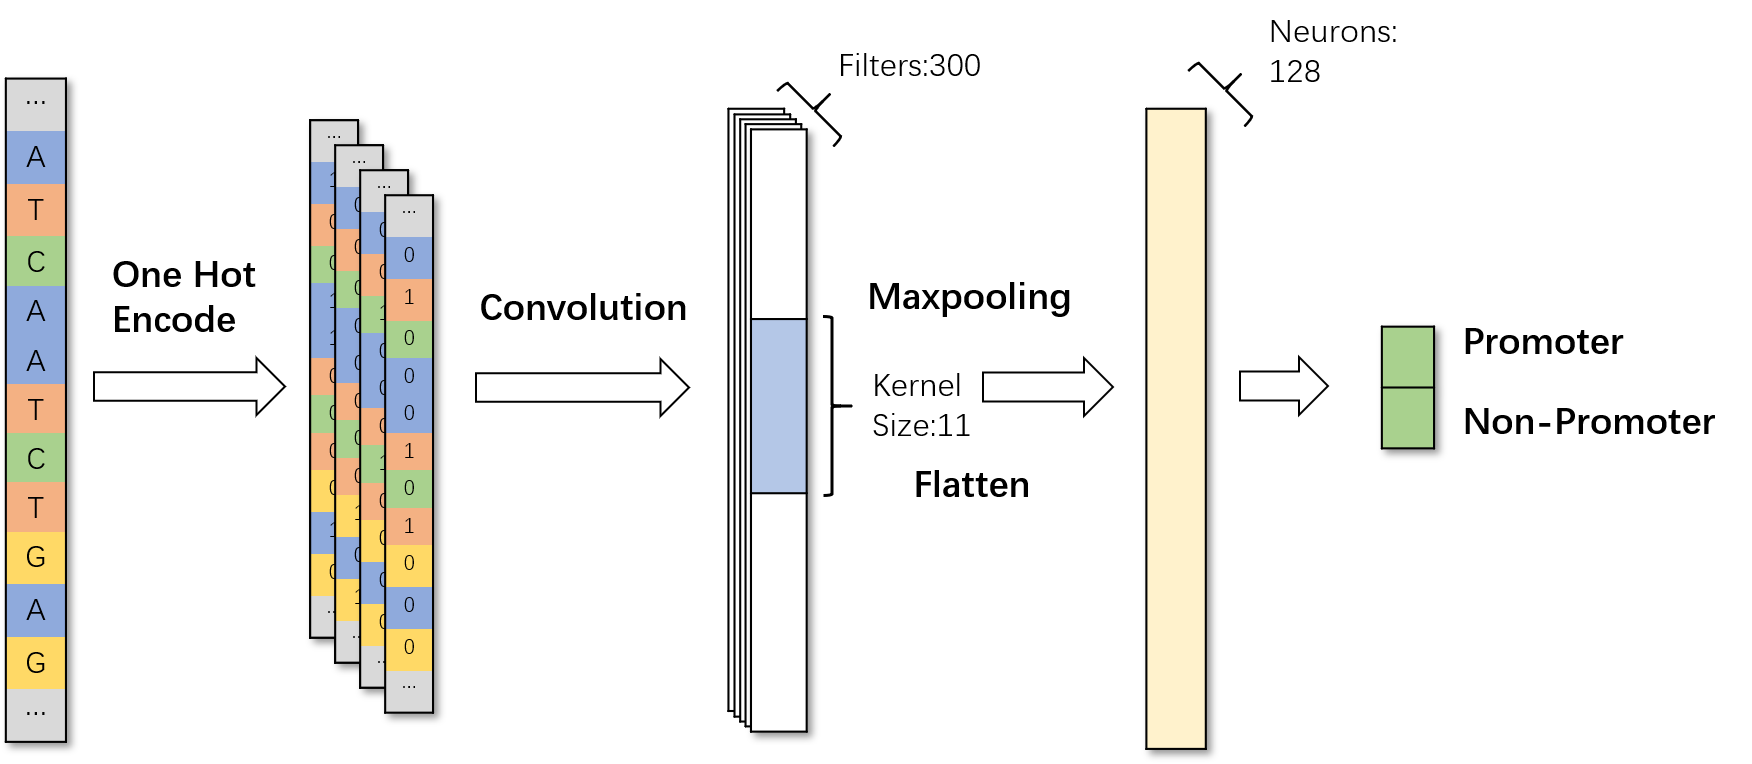
Fig.7.Use CNN to identify promoter in DNA sequence.
Multi-Classifier System
The feature of the promoter region is very different from other genomic regions such as exons, introns, 3'UTR and internal regions of the gene [5]. Therefore, when identifying eukaryotic promoters, we established three classifiers (promoter and exon, intron, 3UTR) to classify promoters at the same time.
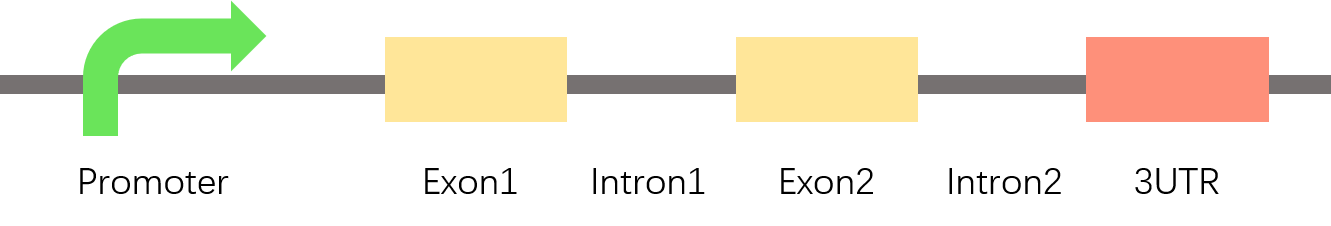
Fig.8.The nature of promoter is different from exon, intron, 3utr.
We put three CNN classifiers together by majority voting rules. A gene sequence \(x\) is simultaneously transferred into three classifiers to obtain the outputs of the three classifiers: \(f^{r} (x),\ r=1,\ 2,\ 3\). In order to determine if \(x\) is a promoter, we need to combine these outputs together and use majority voting rules [6].
\(y=\begin{cases} +1,\ if\displaystyle\sum_{r=1}^{3} \frac{f^{r} (x^r)+1}{2}\geq2\\ -1,\quad Otherwise\\ \end{cases} \)(8)
Where \(y\) is the simulated value of \(x\). If \(y=x+1\), then \(x\) is a promoter, otherwise \(x\) is a non-promoter.
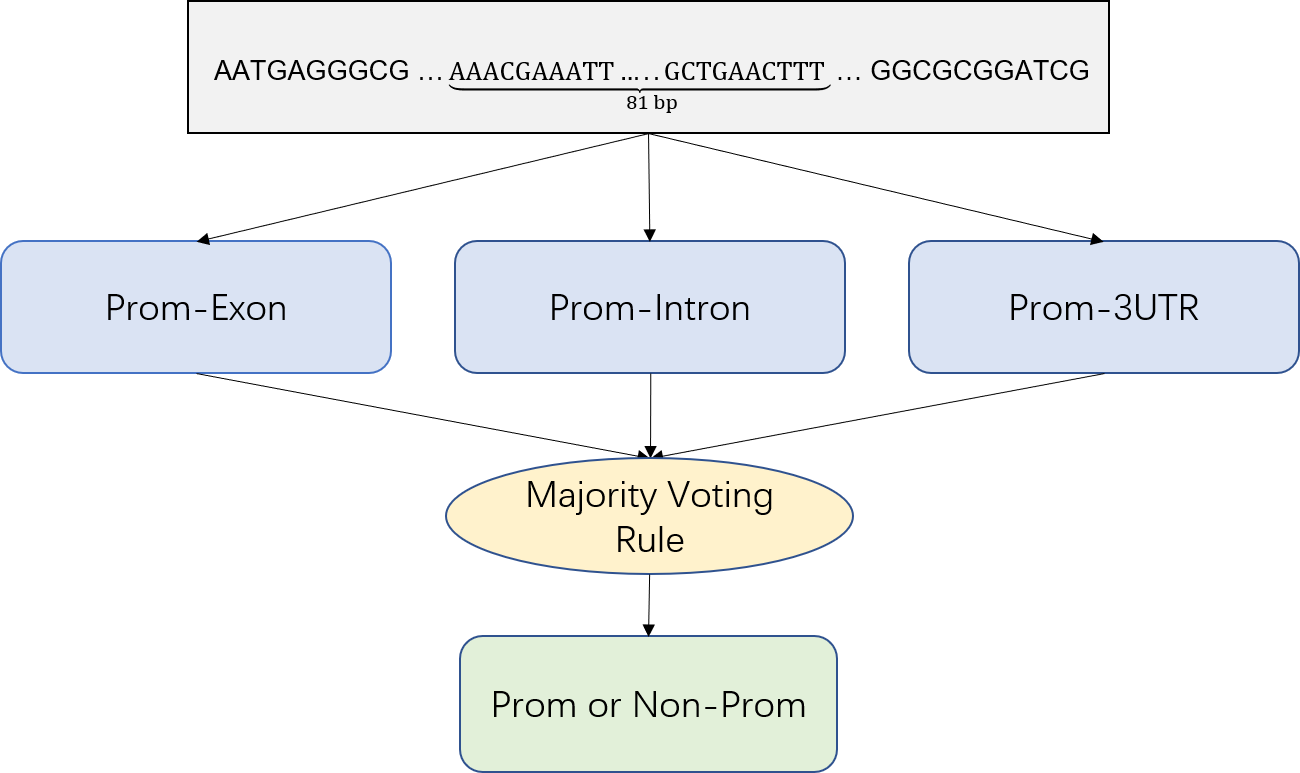
Fig.9.Multiple Classifier System
Global Search
We use a sliding window approach to identify promoter regions in large genome sequences. By moving a fixed-length window in a long sequence, every short sequence is identified to whether it is a promoter sequence. The window length of prokaryotes is 81 bp, and the window length of eukaryotes is 251 bp.
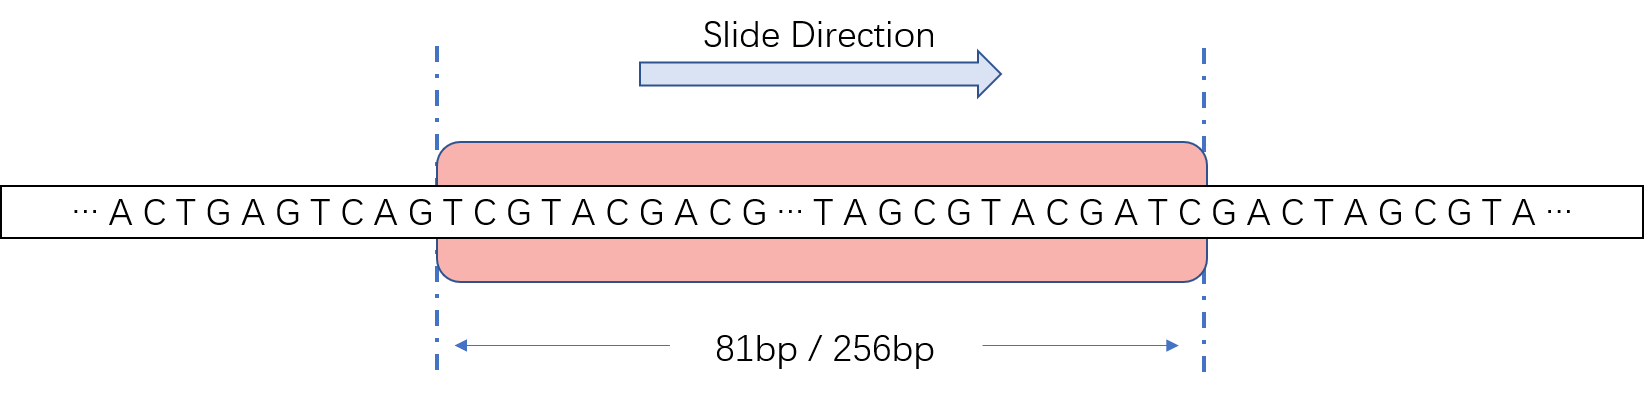
Fig.10.Slide window is used for identify promoter in large scale sequence.
Due to the small difference between adjacent sequences, adjacent windows are likely to have the same classification result. Therefore, we put the region with more than 10 consecutive hits into the candidate set \(G={\{g_1,\ g_2,\ g_3,\ ...,\ g_n\}}\), and select only one window with the highest score to report as the promoter region:
\(g=\displaystyle\max_{n} score(g_1,\ g_2,\ g_3,\ ...,\ g_n)\)(9)
Result
We tested the effect of our model with an independent validation set. In the E. coli Sigma70 promoter prediction, the sensitivity reached 89.1%, the specificity reached 95.2%, and the accuracy reached 92.2%. The performance in eukaryotes is as follows:
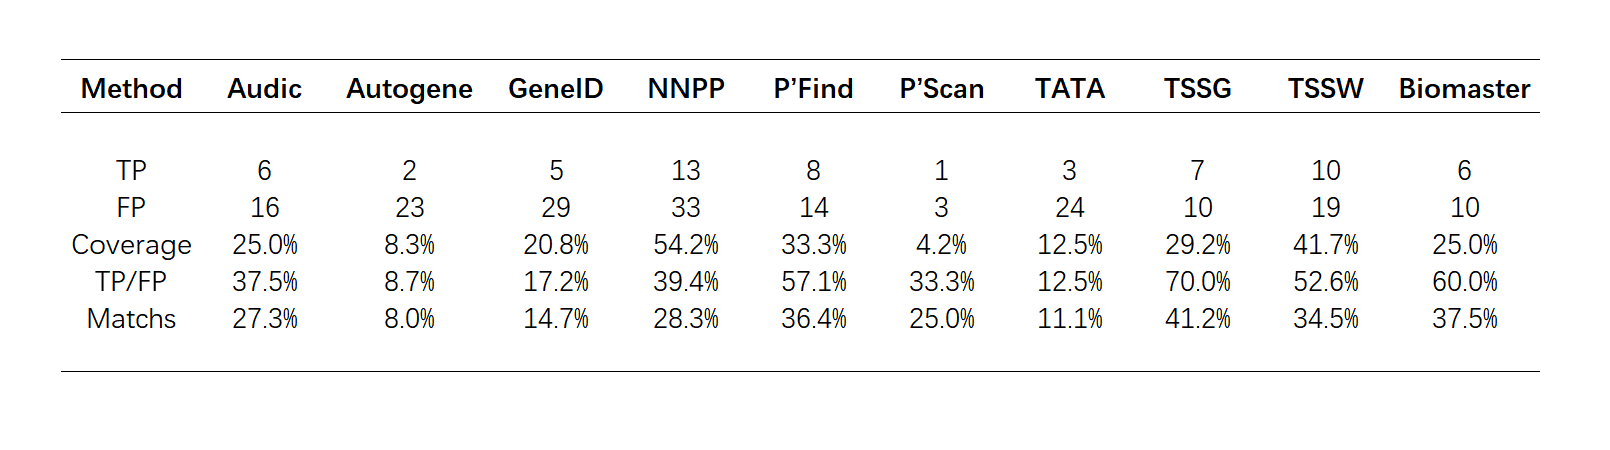
Table.3.The performance compared with other method by Fickett & Hatzigeorgiou's evaluation criterion.
Based on Fickett & Hatzigeorgiou's datasets and evaluation criterion [7], we evaluated the effect of our tool in human genes. Since our tool do not have strand specificity, we treated all approaches as “not strand specific”. [8] Its performance is better than most of the tools selected.

Table.4.The performance in eukaryotic with independent validation sets.
Reference
[1] blast+2.7.1. Download from ftp://ftp.ncbi.nlm.nih.gov/blast/executables/blast+/2.7.1/
[2] eTutorials.org. Basic local alignment search tool (blast). Retrieved from http://etutorials.org/Misc/blast/Part+III+Practice/Chapter+7.+A+BLAST+Statistics+Tutorial/7.1+Basic+BLAST+Statistics/
[3] scikit-learn.org. Supervised learning. Retrieved from http://scikit-learn.org/stable/supervised_learning.html#supervised-learning
[4] Fan,R; Chang,K. (2008). LIBLINEAR: A Library for Large Linear Classification
[5] Zeng, Jia, Xiao-Qin Cao, and Hong Yan. "Human promoter recognition using Kullback-Leibler divergence." Machine Learning and Cybernetics, 2007 International Conference on. Vol. 6. IEEE, 2007.
[6] Xu, Wenxuan, Li Zhang, and Yaping Lu. "SD-MSAEs: promoter recognition in human genome based on deep feature extraction." Journal of biomedical informatics 61 (2016): 55-62.
[7] Fickett, James W., and Artemis G. Hatzigeorgiou. "Eukaryotic promoter recognition." Genome research 7.9 (1997): 861-878.
[8] Scherf, Matthias, Andreas Klingenhoff, and Thomas Werner. "Highly specific localization of promoter regions in large genomic sequences by PromoterInspector: a novel context analysis approach." Journal of molecular biology 297.3 (2000): 599-606.