Difference between revisions of "Team:Queens Canada/Linker Software"
| Line 28: | Line 28: | ||
<div> | <div> | ||
| − | <h2>Linker | + | <h2><em>Linker Software Summary</em></h2> |
| + | <h5>Summary</h5> | ||
<p>The software being developed is designed to connect two selected points on the molecule by finding the | <p>The software being developed is designed to connect two selected points on the molecule by finding the | ||
| − | + | shortest path that connects them without interfering with the rest of the molecule. This is done by first | |
| − | + | finding the shortest path at a specified resolution using an extended version of Dijkstra’s Algorithm. | |
| − | + | After the shortest path has been found linkers are designed to suit the path found. The method used to | |
| − | + | generate the linkers has yet to been determined. This software will be usable through the PyMOL software | |
| − | + | to account for visual representation and interaction with the molecule of choice.</p> | |
| − | + | ||
| + | <h5>File Description</h5> | ||
| + | <p><em>Main File</em><br>The main file interfaces with PyMOL allowing for user inputs to be used in the linker software. | ||
| + | In addition, this file processes the inputs and manages all the function calls that coordinate the creation of the linkers.</p> | ||
<figure> | <figure> | ||
| − | + | <img src="https://static.igem.org/mediawiki/2018/6/67/T--Queens_Canada--PyMOL.jpg" alt='pymol'/> | |
| − | + | <figcaption>An image of the PyMOL model of the molecule used for initial testing and demonstration.</figcaption> | |
</figure> | </figure> | ||
| + | <p><em>Ellipsoid Fit</em><br>The ellipsoid fit module finds the tightest fitting ellipsoid to a set of points that represent the | ||
| + | atoms that compose the molecule. This is done using an algorithm that is based on the Khachiyan Algorithm. This module returns the | ||
| + | center, radii and rotation of the ellipsoid that encloses the points and allows for the plotting of the ellipsoid as a mesh graph.</p> | ||
<figure> | <figure> | ||
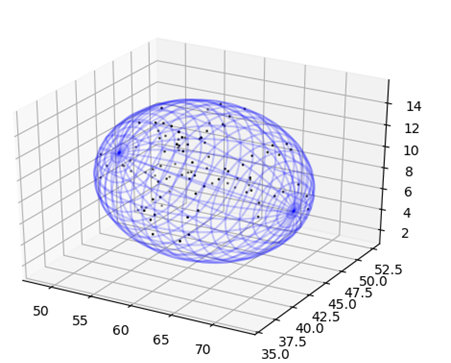
| − | + | <img src="https://static.igem.org/mediawiki/2018/7/72/T--Queens_Canada--BestFitEllipsoid.jpg" alt='bestfit'/> | |
| − | + | <figcaption>The best fitting ellipsoid to the set of points. The set of points that represent the atoms comprising | |
| − | + | the molecule are shown above as black dots while the best fitting ellipsoid is represented as a blue mesh grid.</figcaption> | |
</figure> | </figure> | ||
| + | <p><em>Ellipsoid Points</em><br>The Ellipsoid Points algorithm generates a grid of points that are contained in an ellipsoid with a | ||
| + | given spacing. To increase the efficiency of the algorithm the points from one of the eight quadrants are generated and the corresponding | ||
| + | points from the other seven quadrants are calculated by including all the possible combinations of positive and negative values. Another | ||
| + | function in this module sets up a set of points for Dijkstra’s Algorithm by checking to see if the point is an obstacle, setting the points | ||
| + | to unvisited, setting the distance to be infinite and the previous node to be an empty list.</p> | ||
<figure> | <figure> | ||
| − | + | <img src="https://static.igem.org/mediawiki/2018/b/bd/T--Queens_Canada--RedPointsEllipsoid.jpg" alt='redpoints'/> | |
| − | + | <figcaption>The red points in this image represent the point grid that is developed for later use in the path finding algorithm.</figcaption> | |
</figure> | </figure> | ||
| + | |||
| + | <p><em>Dijkstra R3</em><br>This module implements an extended version of Dijkstra’s algorithm that allows for the shortest path through a | ||
| + | set of points in R3. The algorithm implements a heuristic approach using the Euclidean distance of the current point to the end of the | ||
| + | proposed linker site.</p> | ||
</div> | </div> | ||
| + | <!-- INFORMATION TO BE RELOCATED | ||
<div> | <div> | ||
<h2>Eric's Latex files (to insert)</h2> | <h2>Eric's Latex files (to insert)</h2> | ||
| Line 163: | Line 179: | ||
into proximity than the linker is likely too inflexible. | into proximity than the linker is likely too inflexible. | ||
</p> | </p> | ||
| − | + | --> | |
| + | |||
</body> | </body> | ||
</html> | </html> | ||
Revision as of 17:42, 5 September 2018
Linker Software Summary
Summary
The software being developed is designed to connect two selected points on the molecule by finding the shortest path that connects them without interfering with the rest of the molecule. This is done by first finding the shortest path at a specified resolution using an extended version of Dijkstra’s Algorithm. After the shortest path has been found linkers are designed to suit the path found. The method used to generate the linkers has yet to been determined. This software will be usable through the PyMOL software to account for visual representation and interaction with the molecule of choice.
File Description
Main File
The main file interfaces with PyMOL allowing for user inputs to be used in the linker software.
In addition, this file processes the inputs and manages all the function calls that coordinate the creation of the linkers.

Ellipsoid Fit
The ellipsoid fit module finds the tightest fitting ellipsoid to a set of points that represent the
atoms that compose the molecule. This is done using an algorithm that is based on the Khachiyan Algorithm. This module returns the
center, radii and rotation of the ellipsoid that encloses the points and allows for the plotting of the ellipsoid as a mesh graph.
Ellipsoid Points
The Ellipsoid Points algorithm generates a grid of points that are contained in an ellipsoid with a
given spacing. To increase the efficiency of the algorithm the points from one of the eight quadrants are generated and the corresponding
points from the other seven quadrants are calculated by including all the possible combinations of positive and negative values. Another
function in this module sets up a set of points for Dijkstra’s Algorithm by checking to see if the point is an obstacle, setting the points
to unvisited, setting the distance to be infinite and the previous node to be an empty list.

Dijkstra R3
This module implements an extended version of Dijkstra’s algorithm that allows for the shortest path through a
set of points in R3. The algorithm implements a heuristic approach using the Euclidean distance of the current point to the end of the
proposed linker site.