Difference between revisions of "Team:Queens Canada/Linker Software"
| Line 13: | Line 13: | ||
margin-left: auto; | margin-left: auto; | ||
margin-right: auto; | margin-right: auto; | ||
| + | } | ||
| + | figure { | ||
| + | font-style: italic; | ||
| + | font-size: smaller; | ||
| + | text-indent: 0; | ||
} | } | ||
</style> | </style> | ||
| Line 28: | Line 33: | ||
to account for visual representation and interaction with the molecule of choice. | to account for visual representation and interaction with the molecule of choice. | ||
</p> | </p> | ||
| − | < | + | |
| + | <figure> | ||
| + | <img src="https://static.igem.org/mediawiki/2018/6/67/T--Queens_Canada--PyMOL.jpg" alt='pymol'/> | ||
| + | <figcaption>An image of the PyMOL model of the molecule used for initial testing and demonstration.</figcaption> | ||
| + | </figure> | ||
| + | |||
| + | <figure> | ||
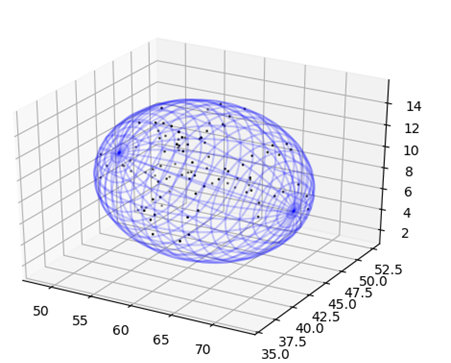
| + | <img src="https://static.igem.org/mediawiki/2018/7/72/T--Queens_Canada--BestFitEllipsoid.jpg" alt='bestfit'/> | ||
| + | <figcaption>The best fitting ellipsoid to the set of points. The set of points that represent the atoms comprising | ||
| + | the molecule are shown above as black dots while the best fitting ellipsoid is represented as a blue mesh grid.</figcaption> | ||
| + | </figure> | ||
| + | |||
| + | <figure> | ||
| + | <img src="https://static.igem.org/mediawiki/2018/b/bd/T--Queens_Canada--RedPointsEllipsoid.jpg" alt='redpoints'/> | ||
| + | <figcaption>The red points in this image represent the point grid that is developed for later use in the path finding algorithm.</figcaption> | ||
| + | </figure> | ||
| + | |||
</div> | </div> | ||
Revision as of 02:09, 2 September 2018
Linker Dynamics (Abigael)
The software being developed is designed to connect two selected points on the molecule by finding the shortest path that connects them without interfering with the rest of the molecule. This is done by first finding the shortest path at a specified resolution using an extended version of Dijkstra’s Algorithm. After the shortest path has been found linkers are designed to suit the path found. The method used to generate the linkers has yet to been determined. This software will be usable through the PyMOL software to account for visual representation and interaction with the molecule of choice.


Eric's Latex files (to insert)
We determined that the linkers between the GR-LBD and the inteins halves would need to be flexible as there is no direct path connecting the termini and they would require the flexibility to meet each other and produces a trans-splicing event. To determine which linker would be ideal we ran simulations of Root-mean-square deviation of atomic positions to determine optimal linker length and composition. Firstly, we chose various linker designs inspired from previous work [a,b], then the entropy equations were run on the Queen’s University Computer Cluster for seven days by Dr. Campbell.