Introduction
This is the modeling for project ATM allergen testing system of Team Tsinghua-A in iGEM2018. The details of our project are demonstrated in Project. And you can also check our model by downloading the pdf file report. If you have any questions and advice, or are just interested in our model,after reading this modeling demonstration, please don't hesitate to contact with us by emails lkm16@mails.tsinghua.edu.cn or meet us in the Giant Jamboree.
Assumptions
- The yeasts and histamines uniformly distribute in the testing system.
- The testing begins when the concentration of yeast is stable
- The histamine-receptor combinations are decomposable
- The fluorescence intensity in one yeast are proportion to the concentration of EGFP in it
- Part of the parameters obey normal distribution
Flow chart of the System
Reaction in system
This part of model focuses on the reaction of histamine and receptors in the testing system, and figures out the relation between the amount of histamine and ligand-receptor combinations.
| Name | Description | Unit |
|---|---|---|
| $R$ | The inactivated histamine receptor | 1 |
| $RL$ | The activated histamine receptor in the system | 1 |
| $RL_p$ | The activated histamine receptor in per yeast | 1 |
| $L_t$ | - The ligand histamine | 1 |
| Name | Description | value | Unit |
|---|---|---|---|
| $K$ | The affinity of receptor | 10 | nM |
| $V$ | The volume of the reaction system | $10^{-3}$ | L |
| $N$ | The number of yeasts in the system | $10^7$ | 1 |
| $R_p$ | The receptor number in one yeast | $10^4$ | 1 |
| $N_A$ | Avogadro's number | $6.02\times 10^{23} $ | 1 |
Model Description
The main reaction is described by the following function
$$ K=\frac{[R][L]}{[RL]}=\frac{(NR_p-[RL])(L_t-[RL])}{[RL]}=\frac{\frac{(NR_p-RL)(L_t-RL)}{{(VN_A)}^2}}{{\frac{RL}{VN_A}}} $$
Replacing $RL$ as $x$, we can have follow function
$$ x^2-(NR_p +L_t +KVN_A)x+NR_pL_t=0 $$
The solve of this quadratic function are
$$ x_{1,2}=\frac{NR_p+L_t+KVN_A\pm \sqrt{{(NR_p+L_t+KVN_A)}^2-4L_tNR_p}}{2} $$
According to the limitation $RL \lt R$,we remain this solve to calculate the concentration of ligand-receptor compound in the testing system.
$$ RL_t=x_1=\frac{NR_p+L_t+KVN_A- \sqrt{{(NR_p+L_t+KVN_A)}^2-4L_tNR_p}}{2} $$
Now we simply use the expectation of the activated histamine receptor in each cell,which is defined as $ERL=\frac{RL_t}{N}$ to approximate the reality.This figure below demonstrates the relation between concentrations of histamine and the activated histamine receptor.
$$RL_t=f(L_t)$$
Signal pathway in a yeast
This part o model displays the modified pheromone pathway in the yeast. The input signal is the concentration of activated receptor in a yeast. The system is constructed by GPCR, MAPK and the expression of the EGFP gene. And the output is the concentration of EGFP.In this part, we use Simbiology in MATLAB to construct and simulate our model.
Compartment Diagram
Model details
The species, parameters and functions of the model can be found inModel Files.
Model Analysis
First, we took a glance at the input time series (activated histamine receptor) and the transcription fact (ste12active) which is the output of MAPK cascade.
In this figure, the degradation of activated histamine receptor (RL) and the output of signal transmission (ste12active) is demonstrated. We are surprised that the system -- GPCR and MAPK in series connection has a function of pulse broadening. This function is because the amplification of MAPK cascade, which ensures the output transcription factor is stable while the input is really low. Thus, this part of the cascade ensures the stability of the output even if the input is a narrow pulse by pulse broadening.
And we run some parameter scan to analysis how the model works under various parameter sets. And we focus on the affinity of the histamine receptor and the degradation rate of the activated histamine, which are both reckoned as highly sensitive parameters before.
The the affinity of histamine receptor and degradation rate of activating receptor scan results are showed below.
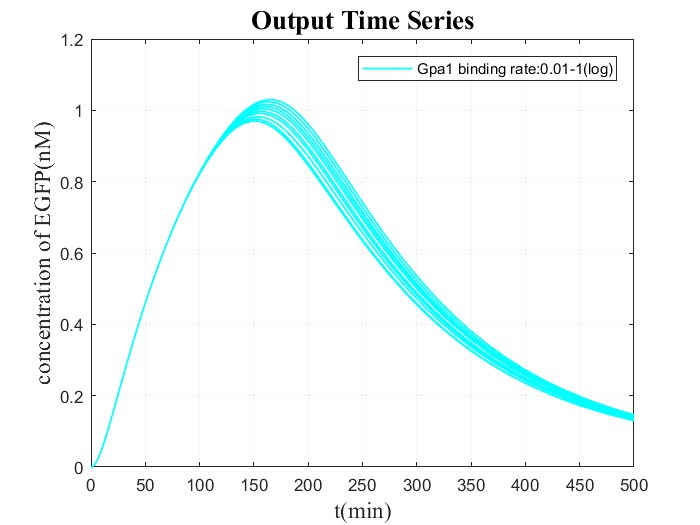
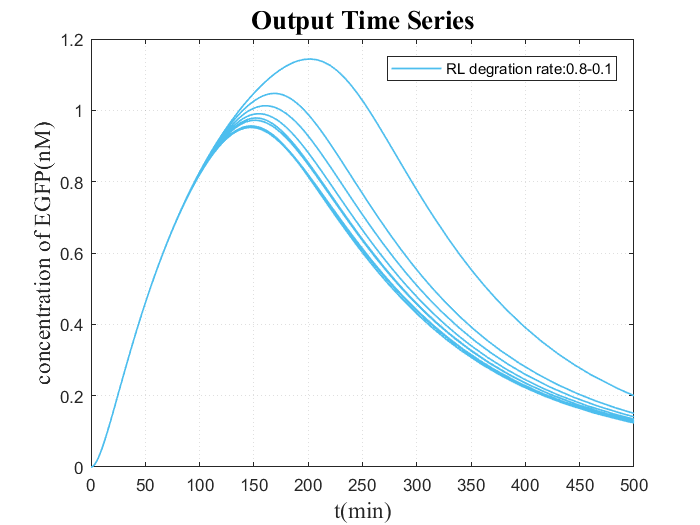
From the figures, we figure that the peak of the concentration of EGFP increases and the decline of it is delayed as the affinity goes higher or the degradation rate of receptor gets lower, which implied us that we can artificially tune these two parameters to adjust the output. Besides,it reminds us that the randomness of these should be further considered in the stochastic model.
Then, we did an input scan and get a figure of output time series of various input, which is demonstrated below. As to the system, the input is the activated histamine receptor in a cell and the output is the concentration of EGFP.
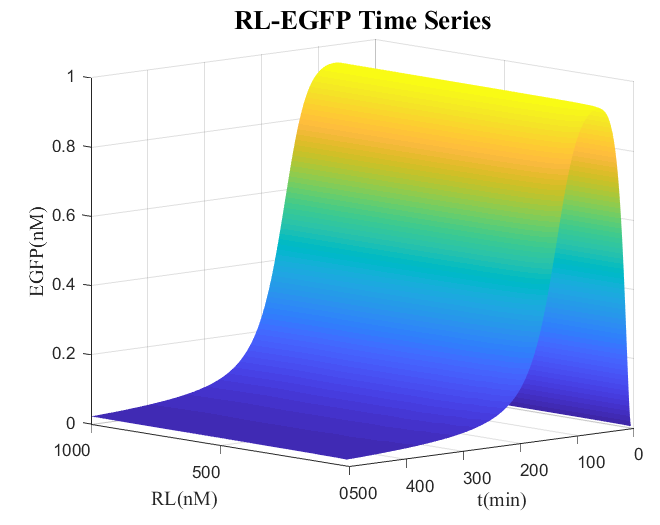
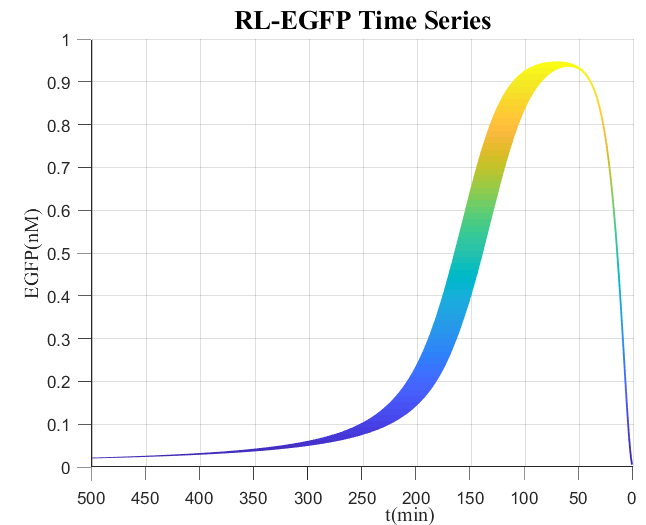
From this figure, it is obvious that the concentration of EGFP soars at the first time and reach a peak,then gradually decreases, since the activated histamine receptor degrade as the time goes by. In addition, the concentration of EGFP monotonously changes as that of RL (input) goes up , which is an evidence that it is possible to test the concentration of activated receptor by that of EGFP.
Diagnosis Model
Diagnosis Model is a model constructed to design, analyze and optimize the diagnostic criteria of histamine testing we developed. In this testing, our purpose is to test whether the histamine concentration in a sample reaches a certain level. If it does, we consider this kind of result as a positive result, which means allergy has possibly happened. However, if the histamine concentration maintains at a background level, we consider it as a negative result. So the diagnosis model is indeed a classification model which focuses on the strategy to determine how we announce the testing result and how much we can believe in it. And, to be emphasized, this model is on the basis of the models we constructed before -- 'Reaction in system' and 'Signal pathway in a yeast.
Diagnostic criteria design
Now we begin with the EGFP concentration in a yeast when certain amount of the histamine receptor activated, which is the output in the signal pathway model. From figure 14, it is clear that the output is dynamic. However, using the whole time series as an output result is complicated in calculation and analysis. Thus, we decide to choose the output at a certain time as the output. Now the dilemma is how to choose the proper time that makes the testing is most accurate and effective.
The core concept is the greedy method here. As the result we observed in figure 14, the EGFP outputs at a certain time are different from the input, which means we can define a gap at a certain time as follow
$$ gap(t)=max\{EGFP(t,RL_{max})\}-min\{EGFP(t,RL_{min})\} $$
The $RL_{max}$ and $RL_{min}$ in the definition mean the $RL$ values that let the EGFP in time $t$ has the maximum or minimum value respectively.Generally, $RL_{max}=RL_p$ and $RL_{min}=0$.The gap can be calculated and shown in the following chart.
Then,the time that has biggest gap $t_{max}$ can be easily found by algorithms, for example, the simulated annealing we used.In this set of parameter, we find that $t_{max}=145$.
Next, we focus on the relation between the concentration of activated histamine receptor (input) and that of EGFP (output) in the time $t_{max}$ (145), which is demonstrated in the follow line charts.
As the chart shows, the concentration of EGFP soars when that of activated histamine receptor is less than approximate 250nM, but the growth rate decreases and maintains stable after this.And, by interpolation, we figure out the function of relation between the concentration of activated histamine receptor and that of EGFP in one yeast.
Then, we assume that the fluorescence intensity ($Flo_p$) and the concentration of EGFP in one yeast (EGFP) follow this simple linear relation.
$$ Flo_p=kEGFP=kf(RL_p) $$
Recalling the number of yeasts in the testing system $N$, we can derive the relation between the fluorescence intensity ($Flo_t$) and the expectation of concentration of EGFP in one yeast.
$$ Flo_t=k\times N \times EGFP=k N f(RL_p) $$
The $k$ is scale coefficient and $N$ is the number of yeast in the system.To further improve, we combine the model 'Reaction in system' that provides the relation of histamine in the system and the expectation activated histamine in one cell. Thus, we have a full model from the histamine in the cell to the fluorescence intensity.And we consider it as a known function
$$ Flo_t=Testing(L_t) $$
Taking $k=1000,N={10}^7$, the plot of this function is showed below.
In this testing, we can flexibly control the input concentration of histamine by diluting or concentrating. However, we know from other researchers and clinical doctors that the expectation histamine concentration of positive result ($EH_p$) is often ten times of that of negative one ($EH_n$).
$$ log(EH_p)=log(EH_n)+1 $$
Thus, with the above rule, we have to find a proper negative input, which ensures the testing system has the best discrimination. In other words, we need to decide the expectation of histamine input of negative result, which makes the negative result and positive result is the furthest. We can define the difference between the negative and positive result as follow as we know that $EH_p=10EH_n$
$$ dif=Testing(EH_p)-Testing(EH_n)=Testing(10EH_n)-Testing(EH_n) $$
The $dif$ is a function of $EH_n$, so we can find a $EH_n$ that maximize the $dif$.The figure of $dif $ is shown below.
In this parameter set we choose, the proper expectation histamine input of negative result that makes the difference biggest is $EN_n=3.16nM$, and the corresponding input of positive result is $EN_p = 10EN_n =31.65nM$. We can directly point these in the plot of the system function as below.
In summary, after analyzing the testing system, we figure out that letting the negative histamine input be $EN_n=3.16nM$(With this parameter set) and testing fluorescence in time $t_{max}=145$(With this parameter set) should be the most efficient and accurate criteria.
Threshold Calculation
After we designed the deterministic model of diagnosis, the error of the input and system should be considered. It is reasonable that there are errors in both negative and positive input, as the histamine in example is different and the manual operation also brings errors. Thus, we tend to assume that the negative and positive inputs ($H_n$ and $H_p$) are subject to normal distributions as below
$$ H_n \sim N(EH_n,\sigma_n^2) $$
$$ H_p \sim N(EH_p,\sigma_p^2) $$
Besides, the error of affinity of receptor and receptor amount in per yeast, as system errors, are also considered. From papers, we know that affinity $K$ is probably between $5nM$ to $15nM$, and the receptors in per yeast $R_p$ is probably $10^4$,thus
$$ K \sim N(10,2.5) $$
$$ R_p \sim N(10^4,\sigma_R^2) $$
And we also consider an uniformity error of the system output ($Flo_t$), which is caused by the error of fluorescence detection hardware.
$$ Flo_t \sim N(E(Flo_t),\sigma_f^2) $$
After defining deviations of the system, we simply take follow parameters to testing.
$$ \sigma_n^2=5\%EH_n \; \sigma_p^2=5\%EH_p \; \sigma_R^2=500 \; \sigma_f^2=1\%E(Flo_t) $$
Then, we can use Monte Carlo methods to simulate the negative and positive result. We choose 100000 iterations Gibs Sampling to simulate this system. And the outcome is demonstrated below.
And we can use the ROC to decide the proper threshold that makes the testing most accurate and efficient. The ROC plot is showed below
From the ROC, it is clear that the threshold of the testing should be 8.822 and the AUC that measure the quality of testing is 0.929, which is adequately high.
Risk Analysis
At the final part of the modeling, we are interested in how the errors of input and system influence the testing accuracy. First, we continue to use the definition of error in the previous part,and more specific class the errors into two parts.
Relative system errors
The relative error of the testing system, mainly because of the uncertainty of sensitive parameters and fluorescence detection error of the hardware.
Relative input errors
The relative error of input concentration of histamine, basically because of the operation errors and the natural variance of samples.
And we also use the Monte Carlo method to simulate it and get a heat plot, which gives us hints about how errors in system and input influence the testing quality. In this analysis, we use AUC to indicates the testing quality.
From the heat chart, it is clear that the raative error in a system has much less effect on the accuracy of testing than that of input, which implies us that it is vital to control the deviation of input. Thus, we have to find a stable and precise way to deal with our histamine samples. The better the input error is controlled, the more accurate the testing is.
Acknowledgement
At the point of finishing this paper, I'd like to express my sincere thanks to all those teammates Li Yaqi Zuo Duyun etc. and advisors Mr. Wang Xiaobo Mr. Xie Zhen and Ms. Wang Jingjing who have lent me hands in the course of my writing this paper. Besides, I would like to thank friends below who are not in our team but still give generous support to me.
For statistic and questionnaire survey advise
For algorithm and latex guidance
For chemistry counseling
Reference
- Lee Bardwell, Jeanette G. Cook, Ernie C. Chang, Bradley R. Cairns, and Jeremy Thorner. Signaling in the yeast pheromone response pathway: specific and high- affinity interaction of the mitogen-activated protein (map) kinases kss1 and fus3 with the upstream map kinase kinase ste7. Molecular Cellular Biology, 16(7):3637, 1996.
- Rolf Isermann. Model-based fault-detection and diagnosis – status and applications . Annual Reviews in Control, 29(1):71–85, 2005.
- B Kofahl and E Klipp. Modelling the dynamics of the yeast pheromone pathway. Yeast, 21(10):831, 2004.
- Zoltan Szallasi, JoRg Stelling, and Vipul Periwal. System modeling in cell biology. MIT Press,, 2006.