Team:Groningen/Model/Stochastic Modeling
Introduction
The team decided to use a scaffold to bind together the cellulases that will allow the yeast to degrade cellulose. Experimental data suggests that cellulose gets degraded more effectively this way. Intuitively the scaffold allows the yeast to more efficiently absorb the products of the degradation due to to proximity, but does scaffolding come at a cost? This model aims to simulate a scaffold similar to the one used in the lab mathematically, to see whether it suffers from any disadvantage and whether the choice of cellulases make a difference. For comparison, a system of free enzymes was also modelled in a similar way.
Method
It is assumed that any advantage of scaffolding will also occur for a system of three cellulases. The model follows the degradation of cellulose chains by two enzymes, an exoglucanase and endoglucanase. To simplify the problem further, it is assumed that the cellulase chains are maximally 100 units long and are all completely soluble. This shouldn’t stop the model from working because cellulose is commercially available in soluble form and at short chain length distributions.
Free Enzymes
| Symbol | Meaning | Unit |
|---|---|---|
| Ci | Concentration Of Cellulose chain of length i. | mmol/L |
| ECBHI, EEG2 | Concentration Of Enzymes Cellobiohydrolase and Endoglucanase | mmol/L |
Figure 1. Table Of Variables For Mechanistic Model
The breakdown of cellulose by two free cellulases is described by balances in figure 2.


As described by Levine et al., the complexation step of the cellulase enzyme to the cellulose is so fast compared to the catalysis, that the complex concentration is considered to be in equilibrium.
This allows the for expression of the complexes in terms of the concentrations of the chains, enzymes and equilibrium constants (also called dissociation constants), figure 3.

It must be kept in mind that the enzymes are complexing with available sites. An endoglucanase binds to the 1-4 glucose bonds, so the concentration available is the concentration of chain i, times the amount of binding sites on chain i. The exoglucanase can only attach to chain ends.
The equilibrium constants are assumed to be the same regardless of the length of the chain. The values for the equilibrium constants were retrieved from the Levine et al. simulation.
Next the concentration balances for each cellulose were derived, to create a system of differential equations. An example of such a derivation (for 2<i<99) is given in figure 4.


The other rate equations, not shown, are derived in exactly the same way. The kcat values for the catalytic steps were also retrieved from Levine’s paper. A summary of all the constants used can be seen in figure 5.
| Symbol | Value | Unit |
|---|---|---|
| Keq,EG2 | 0.053 | mmol L-1 |
| Keq,CBH1 | 0.0032 | mmol L-1 |
| kEG2,cat | 65 | s-1 |
| kCBH1,cat | 9.4 | s-1 |
Figure 5. Table Of Constants used for free enzyme model.
The concentrations of free enzymes (not in complex) is also a dependent variable, and therefore must be described by an equation for the system to be solvable. This can be done with the general Derivation in figure 6.

Since the complexation is considered instantaneous, initial conditions for the free enzyme are calculated by subtracting the enzymes complexed with the cellulose feed from the enzyme feed.
Scaffolded Enzymes
To model the effect of a scaffold, several additional assumptions are made:
- The scaffold will benefit from the highest affinity of the constituent enzymes.
- The catalytic rate of the scaffold is determined by the ratio of the catalytic rates of the individual enzymes. The smallest one having the highest contribution, to be rate determining.
- Upon complexation, The scaffold produces the products of both enzymes in one step. (see figure 7)

The cellulose differentials for the scaffold are derived in the same way as the free enzymes. This time, only one enzyme acts on the cellulose, and every reaction leads to the production of cellobiose.
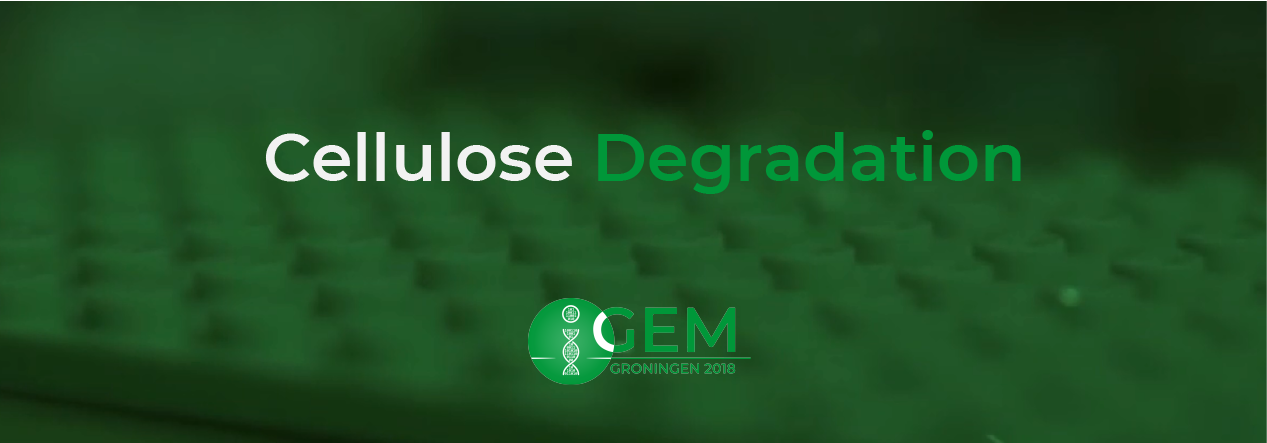
It can be seen the affinity of the Endoglucanase for a particular chain goes up with its length, as evident from the factor (J-1). At times, the affinity of the Endoglucanase is higher than that of the Exoglucanase. According to the assumptions, the scaffold should benefit from the highest affinity ( lowest dissociation constant). To do this, the dissociation constant is allowed vary with the length of the corresponding chain by the equation in figure 8. This equation is a smooth approximation of the maximum of the affinities of both enzymes as a function of chain length. It had to be used because the mathematica solver cannot work with discontinuities.

Figure 9 shows how the dissociation constants of exoglucanase and endoglucanases vary with chain length along with function this model uses to approximate that of the scaffold’s.
Results
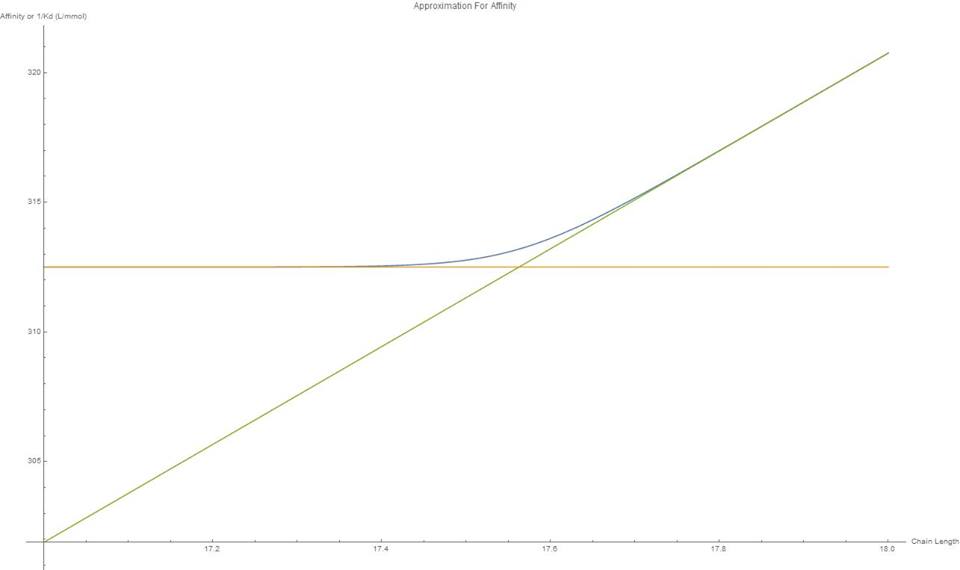
The results show a sigmoidal production of short-length sugars with time. It can be seen that the scaffold is slightly slower than the system of free enzymes. The degradation of the C100 chains show an exponential decreasing relationship with time. Here, also it can be seen that the free enzymes of are slightly faster than the scaffold. The effect of the difference in kCats of the constituent enzymes was also plotted (fig 12). Decreasing the difference in kCats causes the production of absorbable products to increase in rate, a rightward shift in the function.
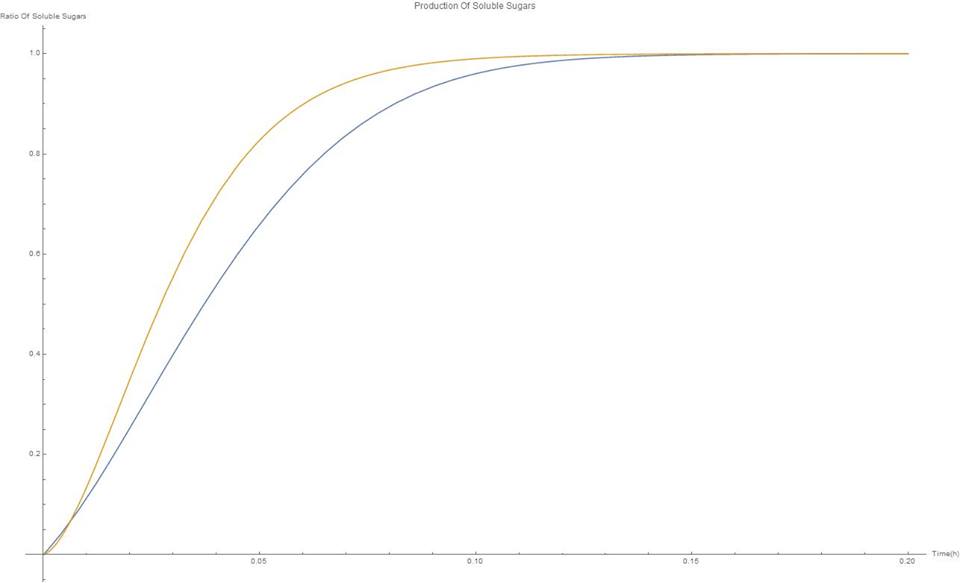

On figure 12 the effect of varying the difference between the constituent enzyme’s kcats can be seen. As the kCats get closer together, the efficiency goes up. Although for cellulases this effect isn’t very strong, this would be something important to keep in mind in future scaffolding experiments.
Conclusions
In this model a scaffold was modelled using a system of differential equations. The performance of the scaffold on degrading cellulose chains was compared with that of free enzymes. The effect of varying the kCats between the constituent enzymes was also investigated. The results show that the scaffold performs overall a bit slower than the free enzymes. However, the difference isn't big enough to say that using a scaffold would cause a significant disadvantage in terms of reaction rate. The team could therefore use it and make use of the other advantages it offers, such as giving the yeast cell higher proximity to the products. Also, the scaffold will strongly benefit from the cellulose binding domain that MD simulations have found to give it a very large adsoprtion-affinity. Although beyond the scope of this project, this strong affinity of the binding domain could be assumed to increase the local concentration of cellulose, explaining the scaffold's high experimental speeds.
References
Levine, S. E., Fox, J. M., Blanch, H. W. and Clark, D. S. (2010), A mechanistic model of the enzymatic hydrolysis of cellulose. Biotechnol. Bioeng., 107: 37-51. doi:10.1002/bit.22789
Wen F, Sun J, Zhao H. Yeast Surface Display of Trifunctional Minicellulosomes for Simultaneous Saccharification and Fermentation of Cellulose to Ethanol . Applied and Environmental Microbiology. 2010;76(4):1251-1260. doi:10.1128/AEM.01687-09.