Team:KUAS Korea/Model
Model |
Modeling Overview
Does altruistic character benefit the survival?
: cost and benefit of altruism – and how it relates to the evolutionary strategy of organisms.
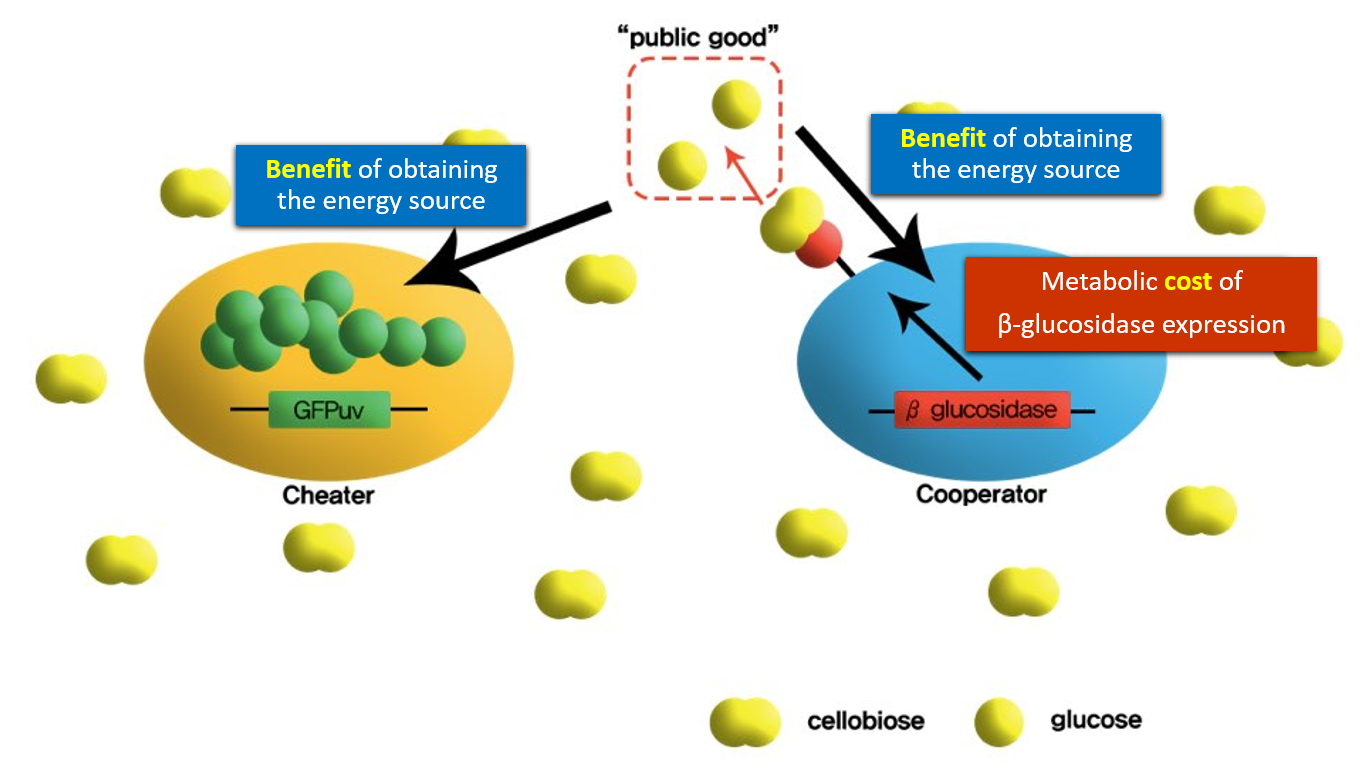
- Cost(c): the metabolic cost of the expression of β-glucosidase (transcription, translation, surface display mechanism)(only cooperator)
Benefit(δ): the consumption of the energy source (glucose)(both the cheater and the cooperator)
- The goal of our modeling is to compare the cost(c) and benefit(δ) of the cell’s altruistic activity. In order to do that, we’ve designed the most basic biological situation with two types of E. coli: the cheater and the cooperator. The key point of this model is that the two strains compete for a single type of energy source- the glucose(which is marked as ‘public good’ in the figure). However, the glucose is scarce in the environment; it is actually not provided in the media but can only be generated by the hydrolytic activity of β-glucosidase on cellobiose. This is the point where the cooperator shows it’s altruism. By displaying the β-glucosidase on the cell surface, the cooperator both benefits itself and the cheater. This process also requires some cost, such as the metabolic cost of expressing the β-glucosidase, and the energy required for its activity. On the other hand, the cheater only receives benefits from the cooperator’s activity providing nothing in return.
- In our modeling, we’ve established mathematical equations for estimating the growth rate of each strain. Then, we compared the value of c and δ at various growth conditions to figure out the effect of altruism on the survival.
- Several assumptions were made prior to the modeling.
- The higher total cell density will increase the relative growth rate of the cooperator. - If the total cell density is high, it is more likely that there are more cooperators which leads to the bigger production of glucose. Less scarcity of the glucose loosens the competition of cooperator and cheater, which means the effect of cost on survival becomes smaller while the effect of the benefit becomes bigger.
- The growth rate of the cooperator will increase as its initial relative population increase. - The initial population condition will be one of the key variables of this model. If the cooperator to cheater ratio is high, cooperator will gain enough benefit from their cellobiose-cleavage activity. In this case, the metabolic cost of β-glucosidase expression is endurable since the cooperator itself needs the β-glucosidase activity anyway in order to obtain glucose as the energy source. However, when the cooperator to cheater ration is low, cooperator will not get enough benefit compared to the investment(cost) it has made. This will lower the survival rate of the cooperator while making cheater easy to survive.
- By dry-lab modeling of our project, we can...
- Estimate the results of wet-lab experiment and compare the data.
- Expand the project to more sophisticated evolutionary situation that is closer to real life but yet hard to implement in wet-lab.
Modeling Equations
- Because we have to know about the relation of microbial growth rates in an aqueous environment with the concentration of a limiting nutrient, we used monod equation for design cheater and cooperators mathematical model. In our case, limiting nutrient will be cellobiose. Also, in our experiment we have to find out the quantificated information of the dependence of the growth rate on substance. Finally, we can compare the growth rates of two E.coli strains.
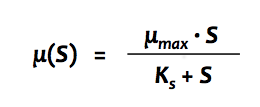
[Fig 1] Monod Equation
This is basic monod Equation. S is glucose released from cellobiose by cooperators. S can be derived from multiplication of q, ρ, χ. q refers the glucose released from cellobiose by cooperators, ρ is the number of total cell density, and χ is the frequency of the cooperator.
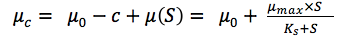
[Fig 2] Cooperator Equation
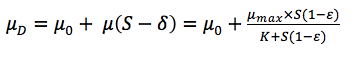
[Fig 3] Cheater Equation
[Fig 4] relative fitness
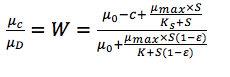
And we divided _𝜇_𝑐_ by _𝜇_𝐷_ to express the relative fitness of cooperator.
Glucose Capture Efficiency
-
1. Calculation of the flux of glucose into a cooperator cell
• Measurement of displayed β-glucosidase per cell using whole-cell activity
- Vmax = 2.49 x 10^7 glucose·s-1 per cell
- The specific growth rate = 0.61 h-1 in 0.004% (w/v) glucose (5.16 x 10^5 cells·μL-1)
- Glucose creation rate = 2.40 x 10^7 glucose·s-1 per cell
- Glucose consumption = 2.59 x 10^8 glucose per cell
• The resulting flux of glucose into a single cell
= the growth rate x the number of glucose molecules per cell = 4.39 x 10^4 glucose ·s-1 per cell
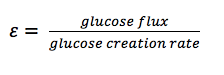
[Fig 5] glucose capture efficiency
And we esitmated the efficency of glucose capture with dividing glucose flux by glucose creation rate. We assumed that the glucose molecules produced by β-glucosidase directly diffuse into media because it is located in the outer membrane of E.coli. And this will cause temporary increase of glucose concentration by a local cloud of glucose at the surface. And this will benefit to influx rate of the glucose into the cell.
Modeling results
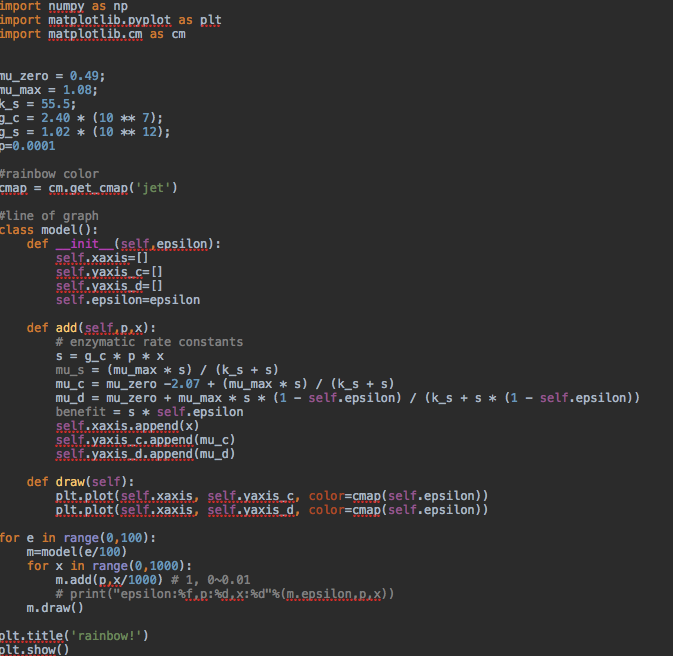
- We coded python for our mathematical mode. We can change the parameter values.
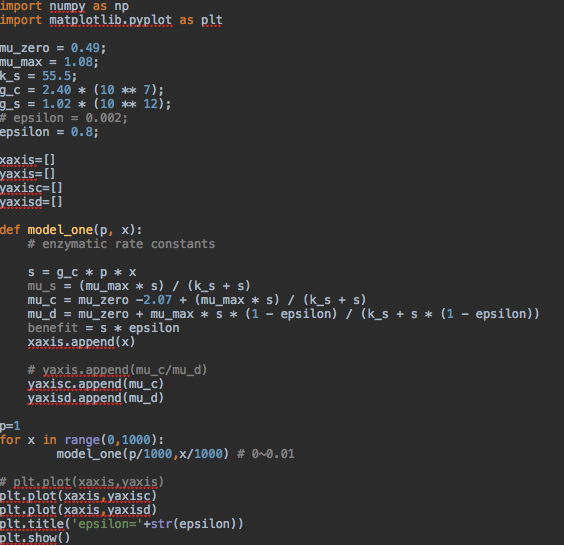
[Fig 1] Python code
We plotted graph by this python code, and these are results. We changed glucose capture efficiency value for each graph. In graph orange shows cheater's growth rate, and blue graph shows the cooperator's growth rate.
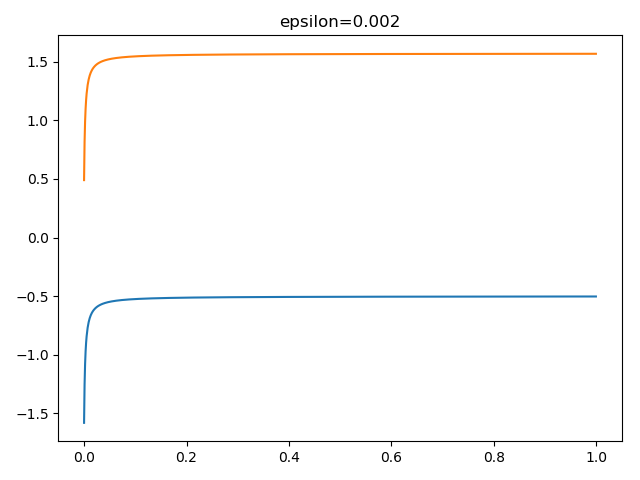
[Fig 2] curve of epsilon is 0.002
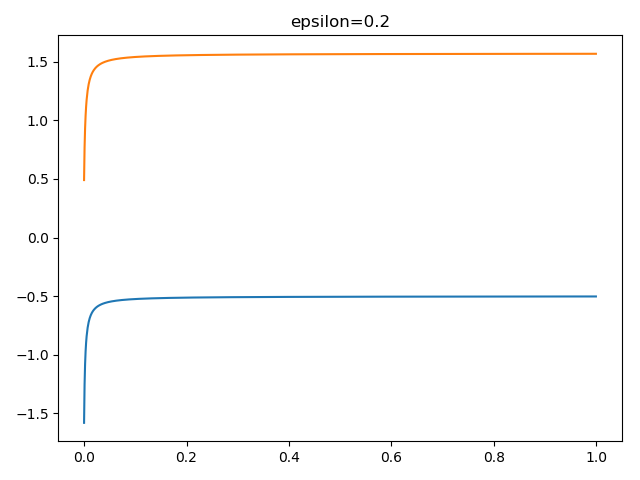
[Fig 3] Curve of epsilon = 0.2
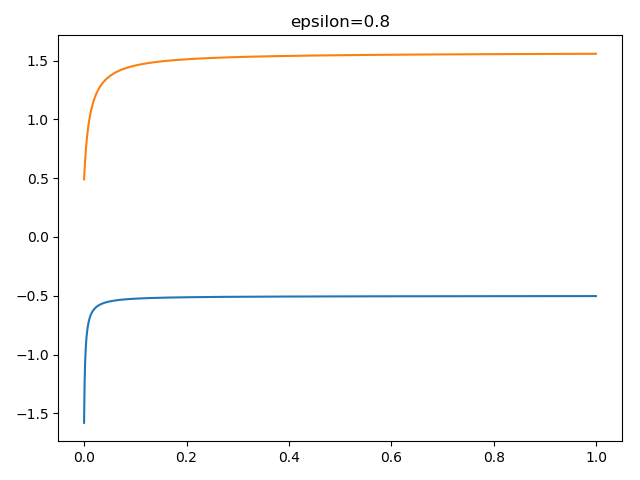
[Fig 4] Curve of epsilon = 0.8
[Fig 5] code which plot the rainbow curve
If epsilon is 0, shows the blue cheater graph. And if epsilon is 1, shows the red cheater graph.
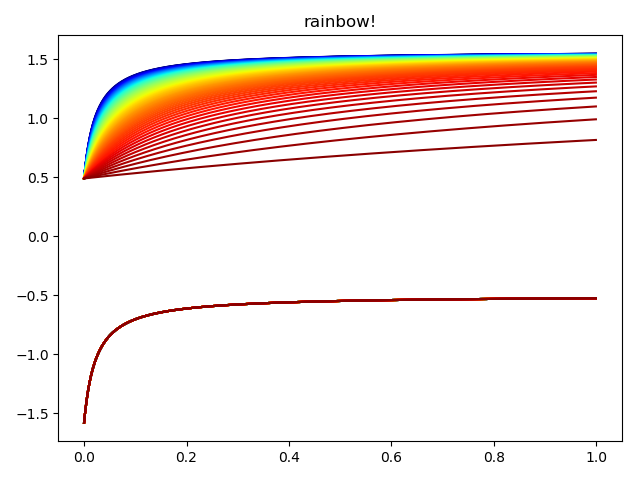
[Fig 5] Graph of epsilon changing continuously
Conclusion
By dry-lab modeling, we can modify the specific conditions of the model by changing the values of the parameters. In the case above, we changed the epsilon value. In the well mixed medium, cheater is the dominant species in the co-culture environment. But when the epsilon value increases, cheater needs more altruistic activities of cooperators. However in the end, cheater and cooperator certain concentration in co-culture. We assumed that it is because only the cooperator can make glucose, which is the only energy source for both cheater and cooperator.Sponsors


