Team:NKU CHINA/Model
Loading...
Model
Abstract
PopQC, which is the abbreviation for population quality control, is a new approach designed for biosynthesis production enhancement based on the non-genetic cell-to-cell variation. Because of some nongenetic differences, different cells in a single colony will have considerable variations in protein and metabolite concentrations. Based on this, PopQC was designed as a plasmid-based gene circuit, which continuously selects high-producers to increase production.
We first use ordinary differential equations to demonstrate that the concentration of intracellular glutamate can vary in a wide range in different cells and stay stable because of two feedback suppression networks, which provides a theoretical basis for our experiment. We then use biophysical model to simulate the biosynthetic performance of our system based on the inhibition effect of promoter's occupation by RNA polymerase. In this link, we find that with tetracycline added to the medium, mRNA distribution of tetA is significantly different in different cells because the intracellular glutamate concentrations are different. This means our system has high sensitivity, and tetracycline can be used to achieve separation of high-producers and low-producers effectively. Finally, we use our model to simulate the production increase and predict the best initial condition to get the maximum production. The result demonstrates that precise regulation of tetracycline concentration is needed near the critical point of production increase in industrial production. Here we also designed an interactive part to show the result dynamically.
Intracellular Glutamate and GltC Concentration Simulated by ODEs
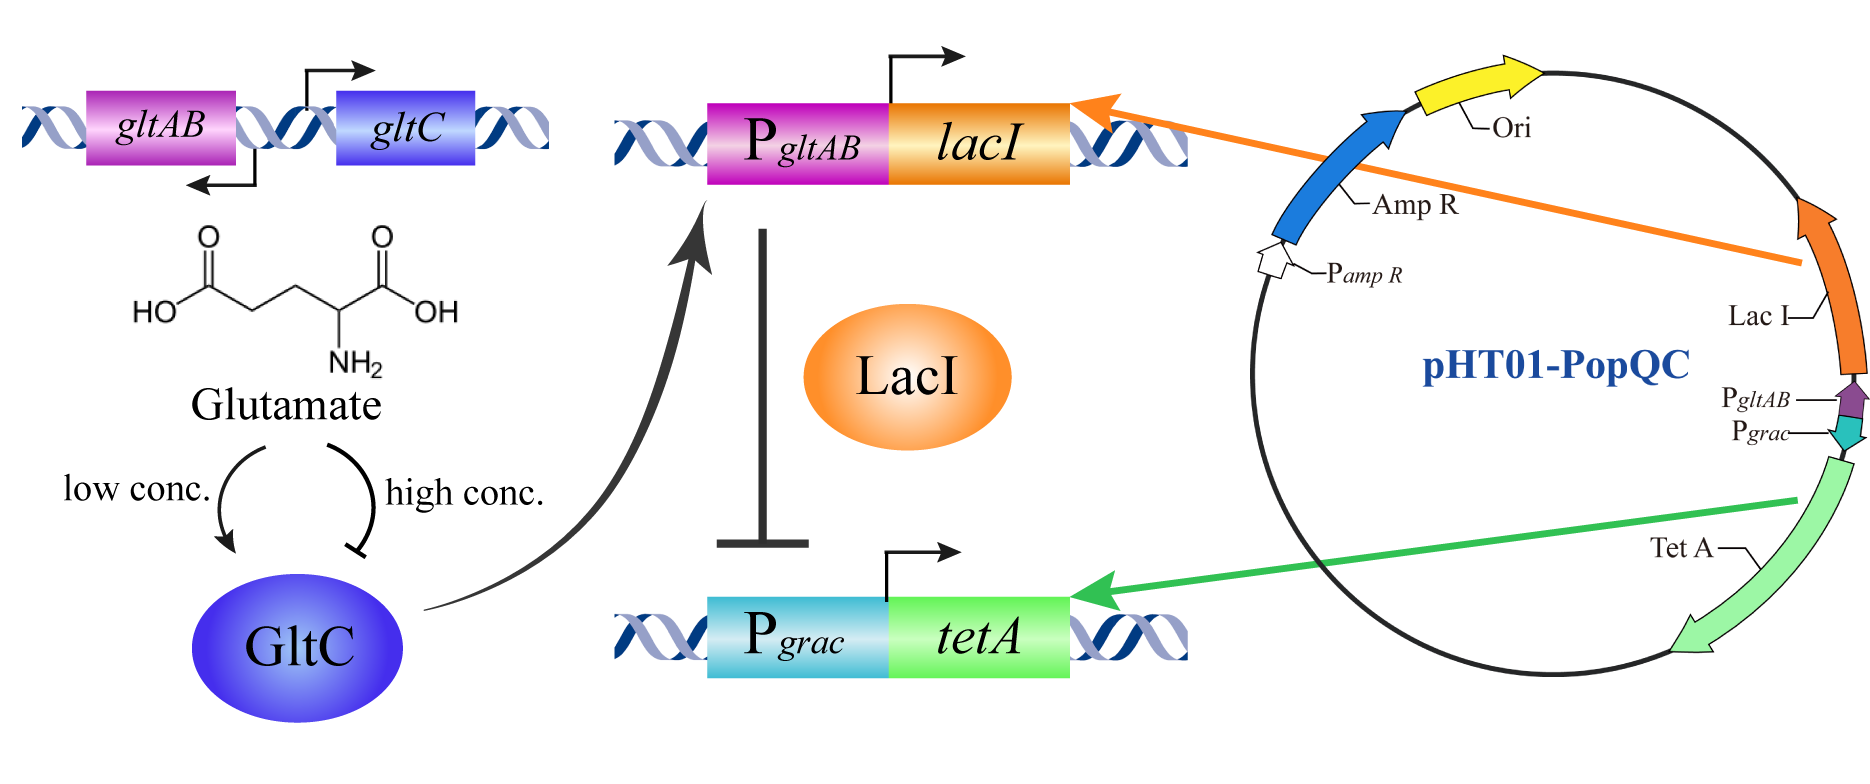
Figure 1: Pattern diagram of PopQC based on our design
In our project, Bacillus amyloliquefaciens LL3 was selected as the engineered strain introduced into the PopQC plasmid. In Bacillus amyloliquefaciens LL3, the intracellular glutamate concentration varies from 20 mM to 200 mM based on some nongenetic differences, which is from the result of our lab's previous work. We hope in the presence of PopQC, high glutamate strains can stay alive while low glutamate strains are unable to survive.
GltC combines with glutamate to form GltC-Glu complex. And it 's suggested that in the case of Bacillus amyloliquefaciens RNAP, glutamate inhibits GltC-dependent transcription of gltAB mostly by GltC-Glu complex 's additional non-specific inhibitory effect on RNAP for binding on gltAB promoter[1]. gltAB operon encodes glutamate synthase[2], so there forms a feedback suppression network by GltC-Glu complex. Meanwhile, GltC-Glu complex also has an inhibitory effect on gltC promoter, which forms a self-negative feedback network. These feedback suppression networks work together to keep intracellular glutamate pool stable. See Figure 2:
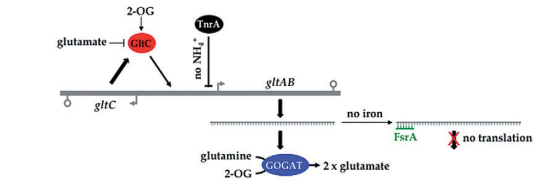
Figure 2: Feedback suppression networks based on GltC-Glu complex.[2]
We use ordinary differential equations (Table 1) to describe this process in a cell cycle, the fitting result is shown as Figure 3:
Table 1: Ordinary differential equations that describes feedback suppression networks based on GltC-Glu complex. We have estimated the parameters and the result are: k1=0.81, k2=2.15×10⁴, k3=49, k4=0.96, k5=0.84, k6=1.6×10⁻⁴, k7=5.0×10⁶, k8=0.47, k9=1.7×10⁶,k10=9.7×10⁴. β represents gene leakage rate, const=1.

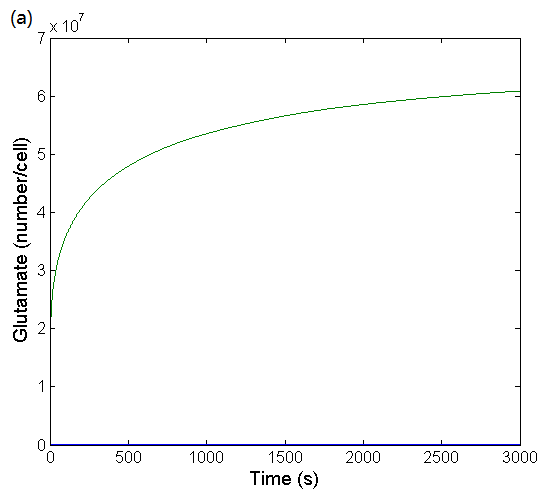
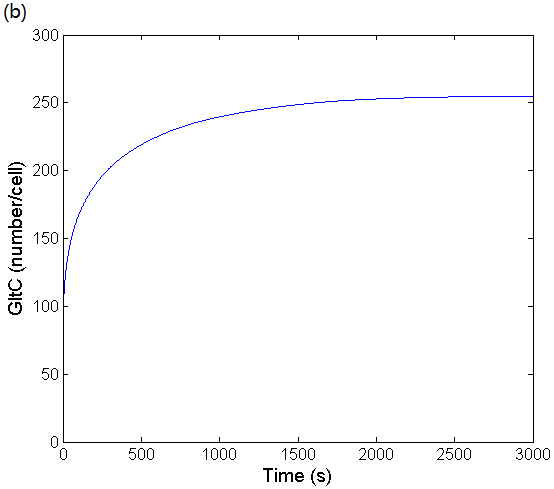
Figure 3: (a) Simulation result of glutamate concentration changing over time in a cell cycle. The fitting result is obtained by using ODEs to simulate glutamate's feedback suppression network. (b) Simulation result of GltC concentration changing over time in a cell cycle. The fitting result is obtained by using ODEs to simulate GltC's self-negative feedback network.
Accroding to Figure 3, it can be seen that the time evolutions are smooth and that no oscillations are present, and eventually the concentration of glutamate and GltC are stable, which is necessary for bacteria. We have also found that even small changes in mRNA degradation rates or mRNA copy numbers may result in large differences in intracellular glutamate concentrations. This result demonstrates why the concentration of glutamate can vary in a wide range and stay stable, which provides a theoretical basis for our experiment.
However, we find that the intracellular GltC concentration is basically equivalent in different cells because of its self-negative feedback network. So is reasonable to assume that the concentration of GltC-Glu complex is only affected by different intracellular glutamate concentrations. The reaction equilibrium constant in Equation (9) is  , so the concentration of GltC-Glu complex is proportional to glutamate concentration. Define its proportional coefficient
  .
.
Simulate Biosynthetic Performance by Biophysical Model
We assume that the intracellular glutamate concentration is normally distributed between 20∼200 mM, which is from the result of our lab's previous work. See Figure 4:
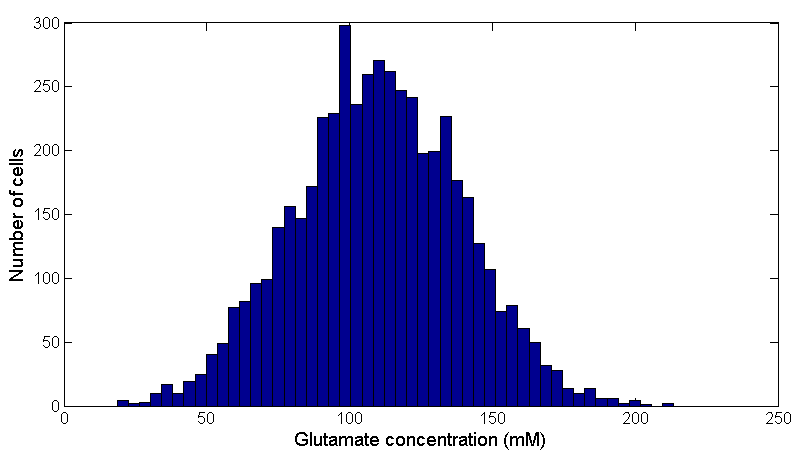
Figure 4: Bacteria distribution with different intracellular glutamate concentrations. Data was obtained from 50000 cells by assuming a normal distribution of intracellular glutamate concentration.Data was obtained from 50000 cells by assuming a normal distribution of intracellular glutamate concentration using MATLAB R2014(a).
The complex GltC-Glu achieves transcriptional regulation by altering the probability of RNA polymerase binding to the PgltAB promoter. We model this process and assume that the probability of binding of RNA polymerase to the tetA promoter is linear to the tetA mRNA transcription level.
Total partition function:

(16)
where Z(P, R; NNS) refers to the partition function of P polymerase and R complex GltC-Glu binding to NNS non-specific sites (Dividing DNA sites into promoters and non-specific binding sites,which is approximately equal to 4×10⁶ in Bacillus amyloliquefaciens.) β=KBT. Here we assume that RNA polymerase is randomly collided onto DNA. Therefore, the probability of a promoter occupied by RNA polymerase is:

(17)
Because the number of polymerase and GltC-Glu complexes is negligible relative to the number of effective binding sites, so:

(18)
Substituting Equation (17) into Equation (18):

(19)
We define the degree of deterrence(D) as the ratio of the probability that the promoter is occupied by RNA polymerase in the absence of a complex GltC-Glu to the probability of having a complex GltC-Glu:

(20)
For weak promotors:

(21)
Define the expression level of PgltAB as 1 when glutamate concentration is 0, so the relative expression level of PgltAB is:

(22)
According to the in vitro experimental data [1] as in Figure 5(a), we can find the parameter in equation (8) as: and get a fitting result, which is shown in Figure 5(b):
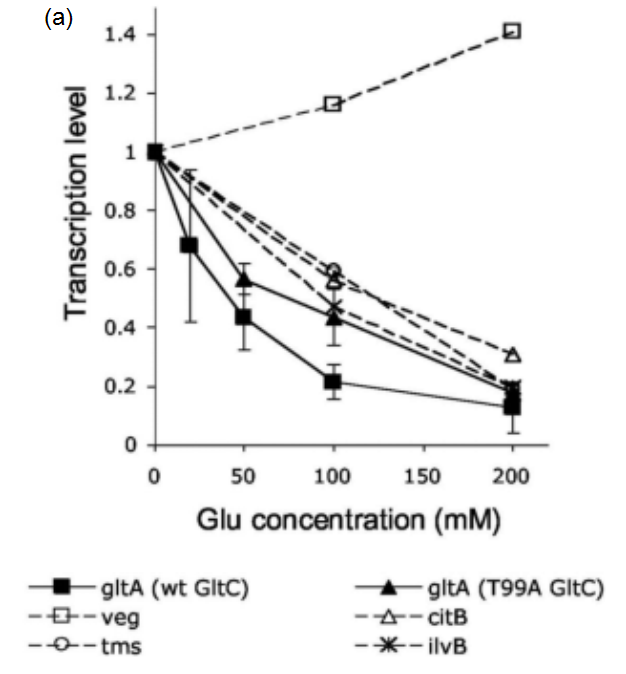
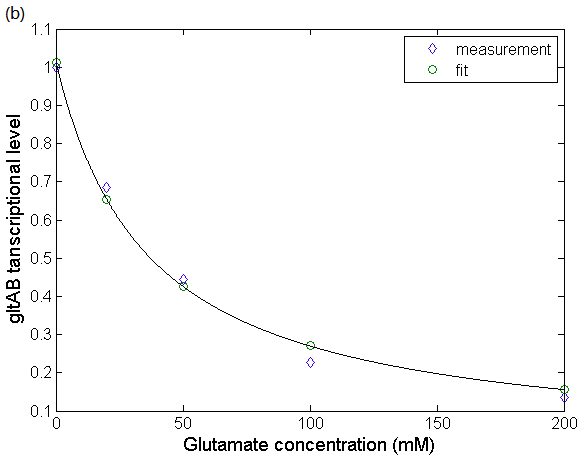
Figure 5: The relationship between gltAB transcriptional level and glutamate concentration. (a)Effect of glutamate on B. subtilis RNAP-dependent gltA expression. Data obtained from Molecular mechanism of the regulation of Bacillus subtilis gltAB expression by GltC. (Picossi, et al, 2007. DOI: 10.1016/j.jmb.2006.10.100). (b) Fitting result of the relationship between glutamate concentration and relative transcriptional level of gltAB. We use biophysical model to simulate the progress that GltC-Glu complex achieves transcriptional regulation by altering the probability of RNA polymerase binding to the PgltAB promoter.
According to the above formulas and glutamate distribution, we can get the distribution of gltAB expression in the cells, and since the PgltAB promoter is linked to LacI protein, which can also be considered as the distribution of intracellular LacI in Figure 6:
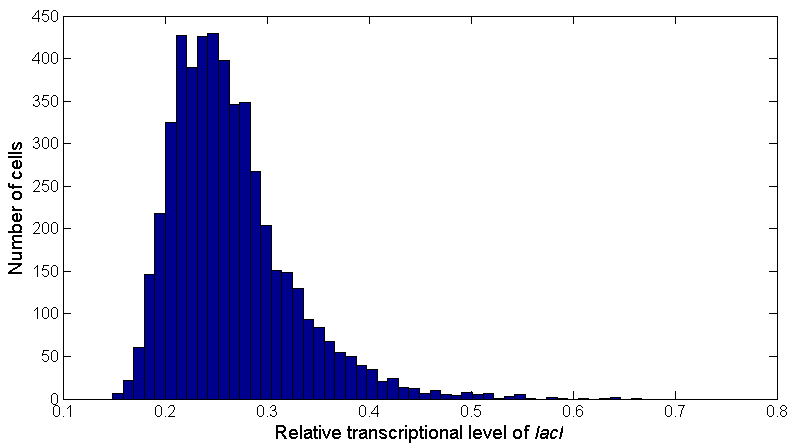
Figure 6: The distribution of intracellular lacI transcriptional level. Bars indicate the number of cells containing different lacI transcriptional levels. The distribution is obtained according to the glutamate distribution and the relationship between lacI transcriptional level and glutamate concentration.
LacI protein achieves transcriptional regulation by altering the probability of RNA polymerase binding to the tetA gene promoter, which is similar to the complex GltC-Glu alters the probability of RNA polymerase binding to the PgltAB promoter. So similarly we can get the total partition function:

(23)
where Z(P, R; NNS) refers to the partition function of P polymerase and R LacI proteins binding to NNS non-specific sites. Then:

(24)

(25)
Figure 7(a) shows the quantitative fluorescence PCR experimental data obtained by our team and the fitting result of the relationship between tetA expression and lacI according to equation (25). The distribution of tetA mRNA in cells can also be obtained as Figure 7(b):
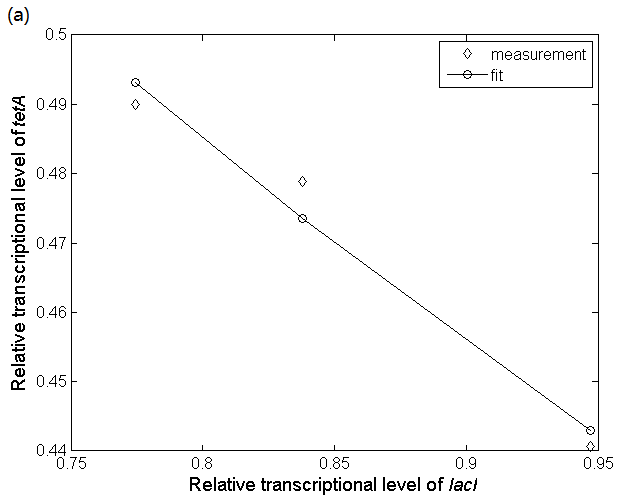
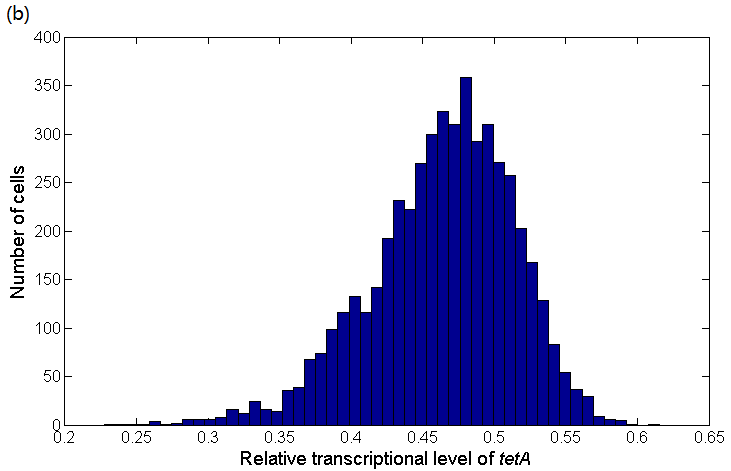
Figure 7: (a) Quantitative fluorescence PCR experimental data indicating the relationship between lacI transcriptional level and tetA transcriptional level and their fitting result. The fitting result is obtained by using biophysical model which simulates the progress that LacI protein achieves transcriptional regulation by altering the probability of RNA polymerase binding to the PtetA promoter. (b) The distribution of tetA transcriptional level. Bars indicate the number of cells containing different tetA transcriptional levels. The distribution is obtained according to the lacI distribution and the relationship between lacI transcriptional level and glutamate concentration.
It can be seen that in the same community, the mRNA distribution of tetA is significantly different, and the system has high sensitivity, so tetracycline can be used to achieve separation of high-producers and low-producers.
Simulate Production Increase and Predict the Best Initial Condition
When tetracycline is added to the medium, we assume that the bacteria whose tetA mRNA expression is at a certain threshold can survive (that is, the intracellular glutamate concentration is at a certain threshold), and we hope to predict the threshold for maximizing the total production. The specific model is: set this threshold to m, and the bacteria can survive when the intracellular glutamate concentration is greater than m. And since the difference in the expression of glutamate is non-genetic, it can be considered that the glutamate remains normal distribution between 20 mM to 200 mM in the offspring after the bacterial division. Among these bacteria, also whose intracellular glutamate concentration is greater than m that can survive. Define ω as the ratio of the number of bacteria with intracellular glutamate concentration greater than m devide by the total number of bacteria:

(26)
The average glutamate concentration in these strains is:

(27)
Assume that the production of γ-polyglutamic acid is proportional to the intracellular glutamate content, that is:

(28)
Substituting equation (28) into the Logistic formula, and assume that tetracycline only affects the population growth rate and the initial bacterial number without changing the environmental capacity, that is, after adding a certain amount of tetracycline:

(29)

(30)
Simplified:

(31)
The total γ-polyglutamic acid concentration is:

(32)
Polyglutamic acid is a growth-coupled product in B. amyloliquefaciens LL3 [3]. For the growth coupled product, the Luedeking-Pieret formula which describes product synthes kinetics is:

(33)
Since X0 is negligible, Equation (33) has a consistent form with the predicted total γ-polyglutamic acid production Equation (32), which confirms the correctness of the established model. Here we designed an interactive part to show the result dynamically:
The fitting result for total γ-polyglutamic acid production is also shown in Figure 8:
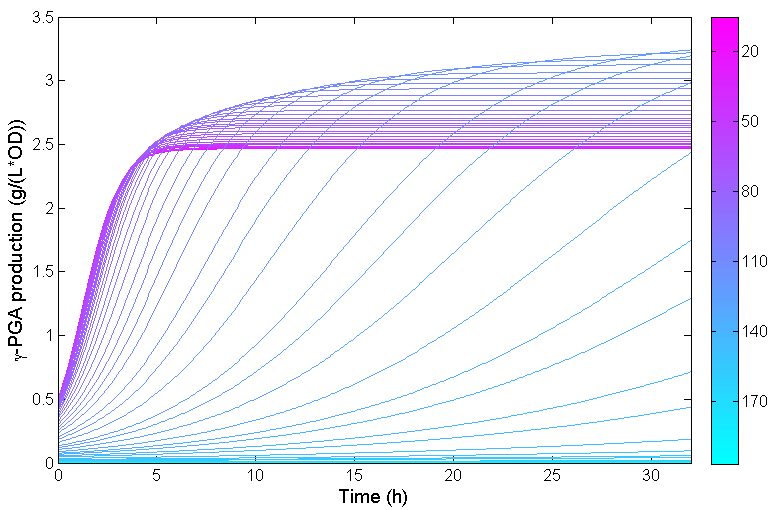
Figure 8: Total γ-polyglutamic acid production changing over time in one fermentation. Parameter m indicates the intracellular glutamate concentration threshold. Only the bacteria whose intracellular glutamate concentration is greater than m can survive when tetracycline is added to the medium. We fit the process of increasing m from 20 to 200 mM with interval 3 mM, generating 60 curves, which is expressed in different colors in this figure.
It can be seen from Figure 8 that the concentration of γ-polyglutamic acid increases first and then decreases with increasing m at a certain point in time (e.g. t=32h). When m is too small, the total concentration is small due to the presence of low production cells; and when m is too large, the total concentration of γ-polyglutamic acid is small because the tetracycline has a strong inhibitory effect and the total number of cells is small. When the concentration of tetracycline is too high, the bacteria hardly grow, which is also consistent with the observed results.
We chose t=32 h as the time of one fermentation. When γ-polyglutamic acid production reaches the highest at t=32 h, m equals to 132 mM, which is shown in Figure 9. This result demonstrates we need to adjust the concentration of tetracycline to make the strains whose intracellular glutamate concentration below 132 mM to die, and the strains whose intracellular glutamate concentration is above this threshold can continue to survive. In that case, the maximum production increase is about 35%. We can also find the fact that production will drop quickly after its increase reaches the peak, which indicates that precise regulation of tetracycline is needed near the critical point in industrial production.
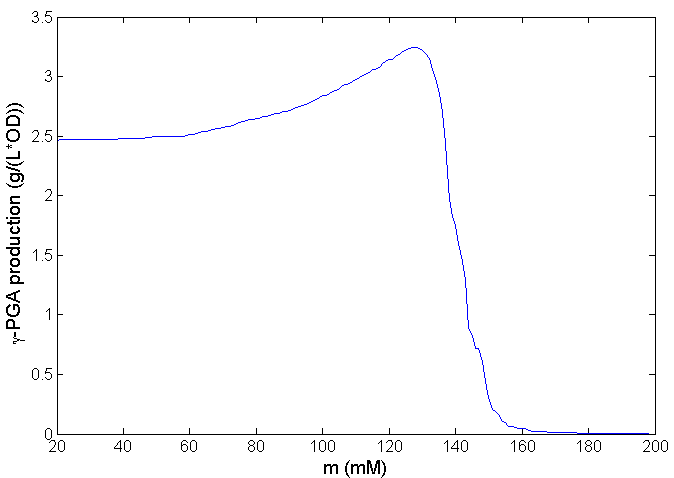
Figure 9: Relationship between total γ-polyglutamic acid production and threshold m at t=32 h. Only the bacteria whose intracellular glutamate concentration is greater than m can survive when tetracycline is added to the medium. Maximum production increase is achieved at m=132 mM.
Abstract
PopQC, which is the abbreviation for population quality control, is a new approach designed for biosynthesis production enhancement based on the non-genetic cell-to-cell variation. Because of some nongenetic differences, different cells in a single colony will have considerable variations in protein and metabolite concentrations. Based on this, PopQC was designed as a plasmid-based gene circuit, which continuously selects high-producers to increase production.
We first use ordinary differential equations to demonstrate that the concentration of intracellular glutamate can vary in a wide range in different cells and stay stable because of two feedback suppression networks, which provides a theoretical basis for our experiment. We then use biophysical model to simulate the biosynthetic performance of our system based on the inhibition effect of promoter's occupation by RNA polymerase. In this link, we find that with tetracycline added to the medium, mRNA distribution of tetA is significantly different in different cells because the intracellular glutamate concentrations are different. This means our system has high sensitivity, and tetracycline can be used to achieve separation of high-producers and low-producers effectively. Finally, we use our model to simulate the production increase and predict the best initial condition to get the maximum production. The result demonstrates that precise regulation of tetracycline concentration is needed near the critical point of production increase in industrial production. Here we also designed an interactive part to show the result dynamically.
Intracellular Glutamate and GltC Concentration Simulated by ODEs
Figure 1: Pattern diagram of PopQC based on our design
In our project, Bacillus amyloliquefaciens LL3 was selected as the engineered strain introduced into the PopQC plasmid. In Bacillus amyloliquefaciens LL3, the intracellular glutamate concentration varies from 20 mM to 200 mM based on some nongenetic differences, which is from the result of our lab's previous work. We hope in the presence of PopQC, high glutamate strains can stay alive while low glutamate strains are unable to survive.
GltC combines with glutamate to form GltC-Glu complex. And it 's suggested that in the case of Bacillus amyloliquefaciens RNAP, glutamate inhibits GltC-dependent transcription of gltAB mostly by GltC-Glu complex 's additional non-specific inhibitory effect on RNAP for binding on gltAB promoter[1]. gltAB operon encodes glutamate synthase[2], so there forms a feedback suppression network by GltC-Glu complex. Meanwhile, GltC-Glu complex also has an inhibitory effect on gltC promoter, which forms a self-negative feedback network. These feedback suppression networks work together to keep intracellular glutamate pool stable. See Figure 2:
Figure 2: Feedback suppression networks based on GltC-Glu complex.[2]
We use ordinary differential equations (Table 1) to describe this process in a cell cycle, the fitting result is shown as Figure 3:
Table 1: Ordinary differential equations that describes feedback suppression networks based on GltC-Glu complex. We have estimated the parameters and the result are: k1=0.81, k2=2.15×10⁴, k3=49, k4=0.96, k5=0.84, k6=1.6×10⁻⁴, k7=5.0×10⁶, k8=0.47, k9=1.7×10⁶,k10=9.7×10⁴. β represents gene leakage rate, const=1.
Figure 3: (a) Simulation result of glutamate concentration changing over time in a cell cycle. The fitting result is obtained by using ODEs to simulate glutamate's feedback suppression network. (b) Simulation result of GltC concentration changing over time in a cell cycle. The fitting result is obtained by using ODEs to simulate GltC's self-negative feedback network.
Accroding to Figure 3, it can be seen that the time evolutions are smooth and that no oscillations are present, and eventually the concentration of glutamate and GltC are stable, which is necessary for bacteria. We have also found that even small changes in mRNA degradation rates or mRNA copy numbers may result in large differences in intracellular glutamate concentrations. This result demonstrates why the concentration of glutamate can vary in a wide range and stay stable, which provides a theoretical basis for our experiment.
However, we find that the intracellular GltC concentration is basically equivalent in different cells because of its self-negative feedback network. So is reasonable to assume that the concentration of GltC-Glu complex is only affected by different intracellular glutamate concentrations. The reaction equilibrium constant in Equation (9) is , so the concentration of GltC-Glu complex is proportional to glutamate concentration. Define its proportional coefficient .
Simulate Biosynthetic Performance by Biophysical Model
We assume that the intracellular glutamate concentration is normally distributed between 20∼200 mM, which is from the result of our lab's previous work. See Figure 4:
Figure 4: Bacteria distribution with different intracellular glutamate concentrations. Data was obtained from 50000 cells by assuming a normal distribution of intracellular glutamate concentration.Data was obtained from 50000 cells by assuming a normal distribution of intracellular glutamate concentration using MATLAB R2014(a).
The complex GltC-Glu achieves transcriptional regulation by altering the probability of RNA polymerase binding to the PgltAB promoter. We model this process and assume that the probability of binding of RNA polymerase to the tetA promoter is linear to the tetA mRNA transcription level.
Total partition function:
(16)
where Z(P, R; NNS) refers to the partition function of P polymerase and R complex GltC-Glu binding to NNS non-specific sites (Dividing DNA sites into promoters and non-specific binding sites,which is approximately equal to 4×10⁶ in Bacillus amyloliquefaciens.) β=KBT. Here we assume that RNA polymerase is randomly collided onto DNA. Therefore, the probability of a promoter occupied by RNA polymerase is:
(17)
Because the number of polymerase and GltC-Glu complexes is negligible relative to the number of effective binding sites, so:
(18)
Substituting Equation (17) into Equation (18):
(19)
We define the degree of deterrence(D) as the ratio of the probability that the promoter is occupied by RNA polymerase in the absence of a complex GltC-Glu to the probability of having a complex GltC-Glu:
(20)
For weak promotors:
(21)
Define the expression level of PgltAB as 1 when glutamate concentration is 0, so the relative expression level of PgltAB is:
(22)
According to the in vitro experimental data [1] as in Figure 5(a), we can find the parameter in equation (8) as: and get a fitting result, which is shown in Figure 5(b):
Figure 5: The relationship between gltAB transcriptional level and glutamate concentration. (a)Effect of glutamate on B. subtilis RNAP-dependent gltA expression. Data obtained from Molecular mechanism of the regulation of Bacillus subtilis gltAB expression by GltC. (Picossi, et al, 2007. DOI: 10.1016/j.jmb.2006.10.100). (b) Fitting result of the relationship between glutamate concentration and relative transcriptional level of gltAB. We use biophysical model to simulate the progress that GltC-Glu complex achieves transcriptional regulation by altering the probability of RNA polymerase binding to the PgltAB promoter.
According to the above formulas and glutamate distribution, we can get the distribution of gltAB expression in the cells, and since the PgltAB promoter is linked to LacI protein, which can also be considered as the distribution of intracellular LacI in Figure 6:
Figure 6: The distribution of intracellular lacI transcriptional level. Bars indicate the number of cells containing different lacI transcriptional levels. The distribution is obtained according to the glutamate distribution and the relationship between lacI transcriptional level and glutamate concentration.
LacI protein achieves transcriptional regulation by altering the probability of RNA polymerase binding to the tetA gene promoter, which is similar to the complex GltC-Glu alters the probability of RNA polymerase binding to the PgltAB promoter. So similarly we can get the total partition function:
(23)
where Z(P, R; NNS) refers to the partition function of P polymerase and R LacI proteins binding to NNS non-specific sites. Then:
(24)
(25)
Figure 7(a) shows the quantitative fluorescence PCR experimental data obtained by our team and the fitting result of the relationship between tetA expression and lacI according to equation (25). The distribution of tetA mRNA in cells can also be obtained as Figure 7(b):
Figure 7: (a) Quantitative fluorescence PCR experimental data indicating the relationship between lacI transcriptional level and tetA transcriptional level and their fitting result. The fitting result is obtained by using biophysical model which simulates the progress that LacI protein achieves transcriptional regulation by altering the probability of RNA polymerase binding to the PtetA promoter. (b) The distribution of tetA transcriptional level. Bars indicate the number of cells containing different tetA transcriptional levels. The distribution is obtained according to the lacI distribution and the relationship between lacI transcriptional level and glutamate concentration.
It can be seen that in the same community, the mRNA distribution of tetA is significantly different, and the system has high sensitivity, so tetracycline can be used to achieve separation of high-producers and low-producers.
Simulate Production Increase and Predict the Best Initial Condition
When tetracycline is added to the medium, we assume that the bacteria whose tetA mRNA expression is at a certain threshold can survive (that is, the intracellular glutamate concentration is at a certain threshold), and we hope to predict the threshold for maximizing the total production. The specific model is: set this threshold to m, and the bacteria can survive when the intracellular glutamate concentration is greater than m. And since the difference in the expression of glutamate is non-genetic, it can be considered that the glutamate remains normal distribution between 20 mM to 200 mM in the offspring after the bacterial division. Among these bacteria, also whose intracellular glutamate concentration is greater than m that can survive. Define ω as the ratio of the number of bacteria with intracellular glutamate concentration greater than m devide by the total number of bacteria:
(26)
The average glutamate concentration in these strains is:
(27)
Assume that the production of γ-polyglutamic acid is proportional to the intracellular glutamate content, that is:
(28)
Substituting equation (28) into the Logistic formula, and assume that tetracycline only affects the population growth rate and the initial bacterial number without changing the environmental capacity, that is, after adding a certain amount of tetracycline:
(29)
(30)
Simplified:
(31)
The total γ-polyglutamic acid concentration is:
(32)
Polyglutamic acid is a growth-coupled product in B. amyloliquefaciens LL3 [3]. For the growth coupled product, the Luedeking-Pieret formula which describes product synthes kinetics is:
(33)
Since X0 is negligible, Equation (33) has a consistent form with the predicted total γ-polyglutamic acid production Equation (32), which confirms the correctness of the established model. Here we designed an interactive part to show the result dynamically:
The fitting result for total γ-polyglutamic acid production is also shown in Figure 8:
Figure 8: Total γ-polyglutamic acid production changing over time in one fermentation. Parameter m indicates the intracellular glutamate concentration threshold. Only the bacteria whose intracellular glutamate concentration is greater than m can survive when tetracycline is added to the medium. We fit the process of increasing m from 20 to 200 mM with interval 3 mM, generating 60 curves, which is expressed in different colors in this figure.
It can be seen from Figure 8 that the concentration of γ-polyglutamic acid increases first and then decreases with increasing m at a certain point in time (e.g. t=32h). When m is too small, the total concentration is small due to the presence of low production cells; and when m is too large, the total concentration of γ-polyglutamic acid is small because the tetracycline has a strong inhibitory effect and the total number of cells is small. When the concentration of tetracycline is too high, the bacteria hardly grow, which is also consistent with the observed results.
We chose t=32 h as the time of one fermentation. When γ-polyglutamic acid production reaches the highest at t=32 h, m equals to 132 mM, which is shown in Figure 9. This result demonstrates we need to adjust the concentration of tetracycline to make the strains whose intracellular glutamate concentration below 132 mM to die, and the strains whose intracellular glutamate concentration is above this threshold can continue to survive. In that case, the maximum production increase is about 35%. We can also find the fact that production will drop quickly after its increase reaches the peak, which indicates that precise regulation of tetracycline is needed near the critical point in industrial production.
Figure 9: Relationship between total γ-polyglutamic acid production and threshold m at t=32 h. Only the bacteria whose intracellular glutamate concentration is greater than m can survive when tetracycline is added to the medium. Maximum production increase is achieved at m=132 mM.
References:
[1] Silvia Picossi, Boris R. Belitsky, and Abraham L. Sonenshein (2007). Molecular mechanism of the regulation of Bacillus subtilis gltAB expression by GltC. J Mol Biol, 365(5): 1298–1313.
[2] Katrin Gunka and Fabian M. Commichau*. Control of glutamate homeostasis in Bacillus subtilis: a complex interplay between ammonium assimilation, glutamate biosynthesis and degradation. Molecular Microbiology (2012) 85(2), 213–224.
[3] Mingfeng Cao, Weitao Geng, Li Liu, Cunjiang Song, Hui Xie, Wenbin Guo, Yinghong Jin, Shufang Wang (2011). Glutamic acid independent production of poly-c-glutamic acid by Bacillus amyloliquefaciens LL3 and cloning of pgsBCA genes. Bioresource Technology 102 (2011) 4251-4257.