Team:Newcastle/Results/Operon

Alternative Roots
Naringenin Operon Assembly Results
Results
Introduction
Guided by the successful chemotaxis results, proving that 50 µM naringenin attracts the nitrogen-fixing bacteria Azospirillum brasilense and Herbospirillum seropedicae, we aimed to engineer a naturally colonising endophyte Pseudomonas sp. (CT 364) to produce naringenin. For proof of concept the production of naringenin would first need to be demonstrated in E. coli before being tested in Pseudomonas sp., our final chassis organism.
Naringenin biosynthesis is achieved through the expression of an operon containing four genes encoding the enzymes that constitute the naringenin biosynthetic pathway (Figure 1). This operon was previously assembled and submitted to the iGEM Registry by the TU Darmstadt 2014 iGEM team BBa_K1497016 and is a composite of the following four genes, each with the strong ribosome binding site (RBS) BBa_B0034:
- 4-Coumaryl ligase - 4CL BBa_K1033001
- Tyrosine ammonia lyase - TAL BBa_K1033000
- Chalcone isomerase - CHI BBa_K1497000
- Chalcone synthase - CHS BBa_K1497001

Figure 1. The naringenin synthesis pathway from L-tyrosine.
We were required to optimise the sequence for the enzyme tyrosine ammonia lyase by reducing the G/C content so that it could be synthesised by IDT BBa_K2797014. The entire operon was synthesised in four separate parts referred to as gBlocks that were subsequently used for Gibson assembly, as this was how TU Darmstadt assembled their operon successfully. Moreover this assembly does not leave restriction site scars due to the overlapping fragments. Instead of using Pseudomonas sp. it was deemed logical to use E. coli DH5α during the cloning experiments as we had a greater understanding of its transformation ability. Using this as a proof of concept would allow us to carry out a preliminary screening for naringenin production before attempting to transform our endophyte.
Alongside this, in an attempt to optimise naringenin production, a new design of the naringenin operon was made in Benchling. This was guided by the pathway modelling results and was constructed to show how BG28 and BG51 dual E. coli-Pseudomonas promoters with a 10-fold difference in strength could increase naringenin production (1).
Results
Operon and Plasmid Design
Plasmid Design
The initial plasmid design for naringenin biosynthesis was based on TU Darmstadt’s design but with a codon optimised tyrosine ammonia lyase. We used pSB1C3 as a backbone, into which we would clone each of the four necessary genes downstream of a strong RBS (BBa_B0034). This construct was under the control of a strong Anderson promoter (J23100) to allow for constitutive expression of the operon (Figure 2 and Figure 4). Once biosynthesis under the control of J23100 is achieved, future experiments will test this under the strong inducible T7 promoter in E. coli (Figure 3 and Figure 5). Parts for biosynthesis in root-colonising Pseudomona sp., will be implemented into a plasmid backbone more suitable for its uptake.
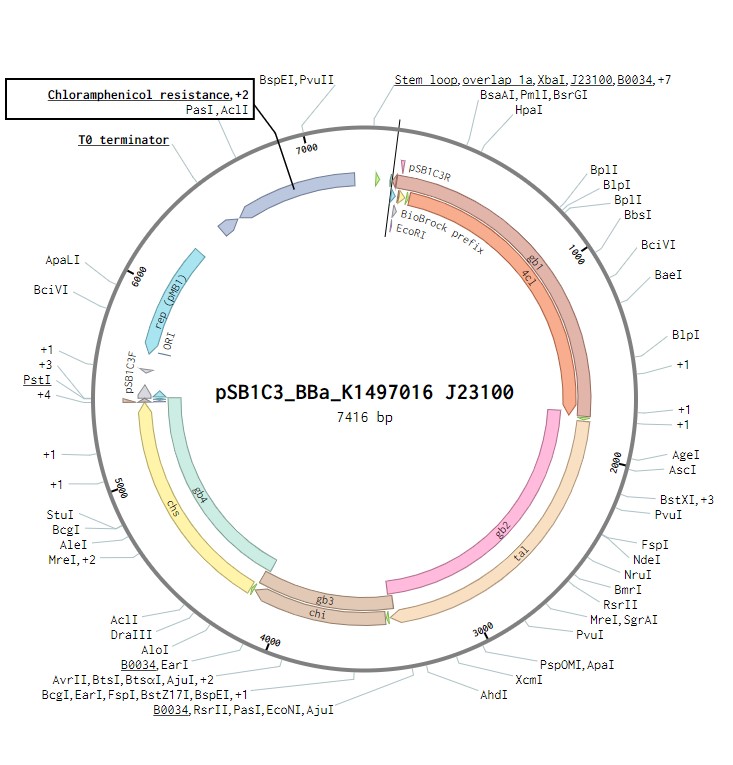
Figure 2. The naringenin biosynthetic operon under control of a J23100 promoter created in Benchling.

Figure 3. The naringenin biosynthetic operon under control of a T7 promoter created in Benchling.

Figure 4. The naringenin biosynthetic operon construct under control of a J23100 promoter created in SBOL.

Figure 5. The naringenin biosynthetic operon contruct under control of a T7 promoter created in SBOL.
Naringenin pathway modelling influenced design
Results of the naringenin pathway modelling demonstrated that weaker expression of the first two genes and 10-fold stronger expression of the last two genes would reduce the build-up of malonyl CoA, a pathway intermediate, and optimise naringenin synthesis. As a result of this, two synthetic promoters (BG28 and BG51) (Figure 7) were selected and an additional E. coli his operon terminator was placed after the first two genes (Figure 6 and Figure 8). These changes to the operon design could allow enhanced naringenin production in future experiments. More information about the pathway can be found here.

Figure 6. The naringenin biosynthetic operon under control of synthetic promoters BG28 and BG51 created in Benchling.

Figure 7. A close up of the synthetic promoters BG28 and BG51 placement in the operon, created in Benchling.

Figure 8. The naringenin biosynthetic operon contruct under control of a BG28 and BG51 promoters and an additional his operon terminator created in SBOL.
Primers were designed for amplification of the backbone and the 4 gBlocks (Table 1). These were designed in Benchling. The primers were used to both amplify the gBlock templates (synthesised by IDT) for use in Gibson assemblies, and to detect the specific genes from the operon that could be present in transformed cells.
Table 1. Primers designed in Benchling for amplification of the 4 gBlocks and the pSB1C3 backbone.
| Primer name | Sequence | Tm | Ta Q5 | Amplified product(bp) | Shown to work | Description |
|---|---|---|---|---|---|---|
| pSB1C3F | tactagtagcggccgctgc | 70 | 71 | 2070 | 6/8/18 | To amplify pSB1C3 backbone |
| pSB1C3R | ctctagaagcggccgcga | 70 | 71 | 2070 | 6/8/18 | To amplify pSB1C3 backbone |
| 4CLF | ccaaatcgccgccaattttc | 59 | 56 | 1686 | 6/9/18 | To amplify 4CL part |
| 4CLR | cgtcgtcgttttgaagtggt | 59.07 | 56 | 1686 | 28/9/18 | To amplify 4CL part |
| TALF | gaatgtccgaacgctacagg | 58.72 | 55 | 1649 | 28/9/18 | To amplify TAL part |
| TALR | tcggaattgagcaggtcgat | 59.18 | 56 | 1649 | 28/9/18 | To amplify TAL part |
| CHIF | ctgggcatagaggtctggag | 58.95 | 56 | 726 | 28/9/18 | To amplify CHI part |
| CHIR | caccttctccgagtactgct | 58.82 | 56 | 726 | 28/9/18 | To amplify CHI part |
| CHSF | aagacgtgcctgggttgata | 59.02 | 56 | 1197 | 28/9/18 | To amplify CHS part |
| CHSR | gcttctcctccttcaaccct | 59.01 | 56 | 1197 | 6/9/18 | To amplify CHS part |
| gb1F | ctggaattcgcggccgct | 72 | 54 | 1686 | 20/9/18 | To amplify 4CL part |
| gb1R | ttacaatccatttgctag | 53 | 54 | 1686 | 20/9/18 | To amplify 4CL part |
| gb2F | ggcaaaactagcaaatgg | 59 | 59 | 1649 | 20/9/18 | To amplify TAL part |
| gb2R | ttatcagacgggagattg | 58 | 59 | 1649 | 20/9/18 | To amplify TAL part |
| gb3F | cttgcagcaatctcccgt | 65 | 59 | 726 | 20/9/18 | To amplify CHI part |
| gb3R | ctagactccaatcactgg | 58 | 59 | 726 | 20/9/18 | To amplify CHI part |
| gb4F | tactattccagtgattgg | 54 | 55 | 1197 | 20/9/18 | To amplify CHS part |
| gb4R | cggactgcagcggccgct | 78 | 55 | 1197 | 20/9/18 | To amplify CHS part |
Results
Experimental Work
Backbone amplification
The pSB1C3 backbone was amplified, purified and quantified in preparation for Gibson assembly of the naringenin operon. Amplification was performed by PCR using Q5® High-Fidelity DNA Polymerase and primers pSB1C3F and pSB1C3R. The resultant PCR product was analysed by agarose gel electrophoresis and showed a band at 2 kb that corresponded to the size of the plasmid backbone. The backbone was then purified using Qiagen QIAquick PCR Purification Kit and the DNA concentration quantified using a Qubit fluorometer, this was determined to be 3.58 µg/ml. As this concentration was far too low for Gibson assembly, the backbone was amplified and purified again using the same techniques resulting in a brighter band at 2 kb than before (Figure 9) and a stock concentration of 26.2 µg/ml.
Protocol Details found here
Figure 9. Agarose gel showing the 2 kb band representing the amplified plasmid backbone (pSB1C3).
Positive control - Gibson assemblies
A positive control of the Gibson assembly was conducted. The NEBuilder® HiFi DNA Assembly Cloning Kit was used. A positive control reagent supplied with the kit contained two overlapping dsDNA fragments and the pUC19 plasmid. The positive control was conducted to check that the assembly mix was working, the protocols for transformation were correct and that the cells prepared previously were competent.
The results of the positive control showed that the E. coli DH5α cells had successfully been made competent as they were able to take up the three-part assembly of the two overlapping fragments and the pUC19 backbone (Figure 10A). Furthermore, the reagents and protocols used in the Gibson assemblies were shown to have worked proving their viability for use in future experiments. No colonies grew on the negative control plates (Figure 10B), verifying that E. coli DH5α cells are not ordinarily resistant to ampicillin and that no contamination had occurred.

Figure 10. A) Successful E. coli DH5α transformation of the positive control provided in the NEBuilder® HiFi DNA Assembly Cloning Kit in LB ampicillin plates. B) Negative control plate of un-transformed E. coli DH5α cells.
Initial Gibson Assemblies of the naringenin operon
All Gibson assemblies were carried out using the 4 gBlocks, the pSB1C3 backbone and the competent cells produced on the 10/8/18. Gibson assemblies were conducted using the NEBuilder HiFi Assembly mix. For the assembly of 4 – 6 fragments the total concentration of DNA for the reaction had to be between 0.2 – 0.5 pmol with equimolar concentrations between all the inserts and the vector (0.05 pmol each) (Table 2). This reaction was incubated for 60 minutes at 50°C. The DH5α cells were then heat-shock transformed with the Gibson assembly product. The cells were spread onto LB plates containing chloramphenicol. Negative control plates containing un-transformed DH5α cells with no DNA were produced.
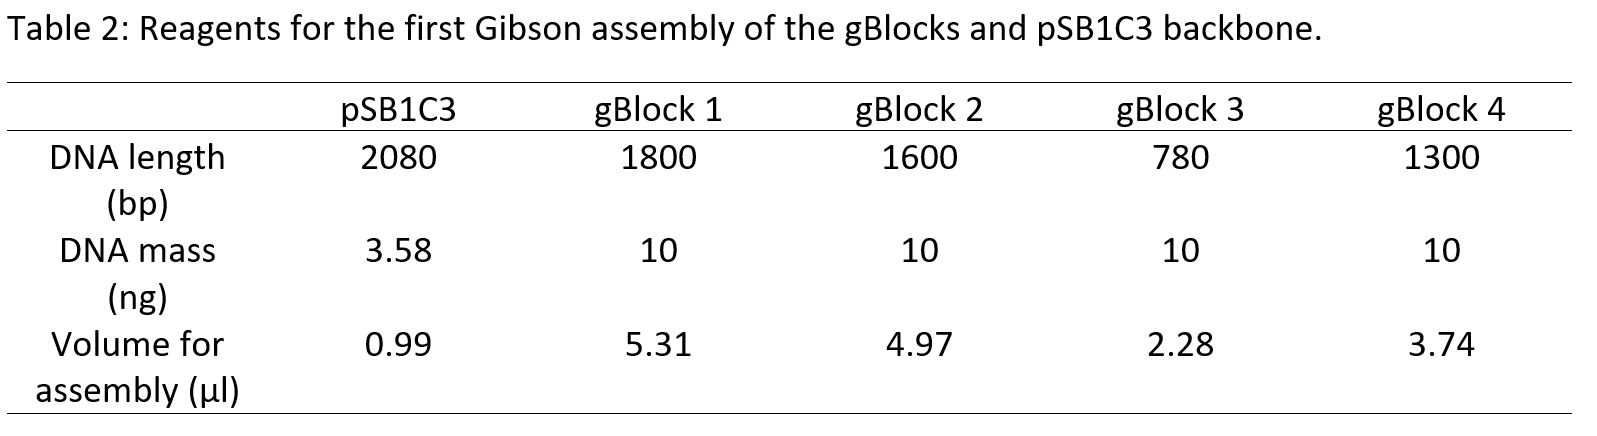

Figure 11. A) E. coli DH5α colony from cells transformed with the second Gibson assembly. B) E. coli DH5α colony from cells transformed with the third Gibson assembly. C) Negative control plate of un- transformed E. coli DH5α cells showing no colonies.
For the first Gibson assembly (Table 2), the backbone had a very low concentration, resulting in a low transformation efficiency.There was no colony growth on the transformed plates indicating the plasmid had not been taken up. Additionally there was no colony growth on the negative control.
Following the lack of colonies, the amplified backbone with the higher concentration of 26.2µg/ml was used coupled with reducing the total reaction volume in Gibson assembly from 36µl to 20µl (Table 3). This method yielded two colonies from cells that had been transformed (Figure 11A and 11B) and a corresponding negative control plate (Figure 11C). It was discovered through agarose gel electrophoresis of the miniprep of these colonies that they had only taken up the 2 kb plasmid without the operon, as the only bright band was at 2 kb when compared to the ladder (Figure 12). The absence of colony growth indicated a low transformation efficiency, so commercial cells were used in future experiments instead of homemade competent cells.

Figure 12. Agarose gel electrophoresis of the two miniprepped colonies from the second and third Gibson assemblies. 6 columns as split the 2 colonies into 3 separate tubes for the miniprep.
Gibson assembly transformations into commercial cells
Following multiple unsuccessful Gibson assembly attempts, the gBlocks and backbone were amplified by PCR using Q5® High-Fidelity DNA Polymerase. Gel extraction was performed using the QIAquick Gel Extraction Kit. Four Gibson assemblies using combinations of these amplified, gel extracted and original un- amplified gBlocks were set up (Table 4, Table 5, Table 6 and Table 7). These were then used to transform commercial DH5α cells competent cells. As a result, 30 to 60 colonies per transformation plate grew (Figure 13).


Figure 13. Colonies from transformed cells with Gibson assemblies 1-4 using different volumes of gBlocks.
As primers had been designed for detection of the operon from transformants, colony PCR was conducted on 5 of the colonies from the plates 1-4 using Q5® High-Fidelity DNA Polymerase to amplify the 5 kb band corresponding to the full length of the operon. No bands were observed following agarose gel electrophoresis of the PCR products (Figure 14).

Figure 14. Colony PCR of colonies from transformed cells using the primers for the beginning and end of the operon.
No bands were observed that corresponded to the 5 kb operon, possibly due to inherent difficulties commonly associated with the amplification of large PCR products. Based on this, colony PCR was not utilised in the future for the detection of the operon. As an alternative, plasmids would be extracted from the colonies obtained in future transformations. These would be analysed by agarose gel electrophoresis performed to visualise the plasmid. 45 colonies of DH5α transformants were inoculated in LB medium containing chloramphenicol and those cultures were used to carry out plasmid extractions that were later run on an agarose gel (Figure 15 and Figure 16). Two colonies from plate 4 (Figure 13) showed a promising 7 kb band corresponding to the expected size of the operon and the plasmid.

Figure 15. Agarose gel electrophoresis plasmid extractions from transformants which were using Gibson assemblies 1-4 with the amplified and un-amplified gBlocks. Bands are visible at 2 kb corresponding to the plasmid backbone without the operon.

Figure 16. Agarose gel electrophoresis of plasmid extractions showing two 7 kb bands at position 9 on the first gel and 4 on the second. These were both from plate 4 of the 1-4 Gibson assemblies with amplified and un-amplified gBlocks.
Plasmids extracted from the two colonies displaying a 7 kb band were sent for sequencing using primers Gb1F, Gb1R, Gb2F, Gb2R, Gb3F and Gb2R (Eurofins Genomics). These primers were selected as the combined reads should provide sufficient sequence data coverage for the complete operon. Unfortunately, the sequence reads obtained did not provide sufficient data to confirm the correct assembly. Although some reactions provided sequence reads > 1 kb, others provided little or poor quality data which resulted in insufficient coverage. One of the plasmids sequenced appeared to contain regions that aligned to the naringenin operon design, however due to gaps in the sequence reads this was not conclusive evidence of successful assembly (Figure 17). This may be due to the sensitive nature of the primers when annealing to the template during the sequencing reaction. Overall, it is likely that the relatively large size of the naringenin operon inserted into the pSB1C3 backbone (7 kb) led to reduced efficiency in transformation.

Figure 17. Alignment of the sequences amplified by Gb1F and Gb1R to the gblock1 from the naringenin operon. Alignment constructed in Benchling.
The Gibson assembly was attempted a final time, using DpnI to remove all the plasmid template from the reaction mixture (Table 8).

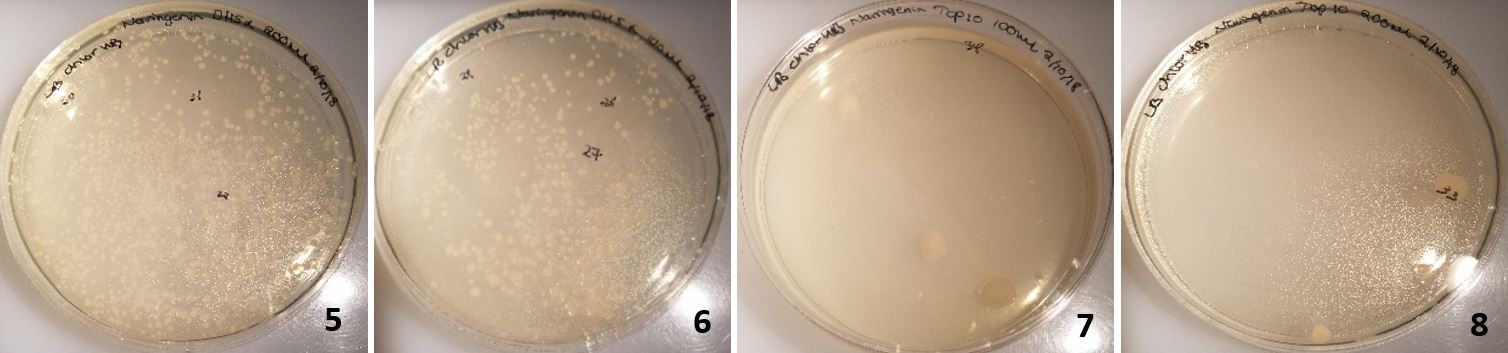
Figure 18. Colonies from cells transformed with Gibson assembly treated with Dpn1. 5-6 were DH5α cells and 7-8 were TOP10 commercial cells.
In plates 5-6, DH5α cells were transformed and in plates 7-8 TOP10 cells were transformed (Figure 18). Dpn1 digestion had been implemented. This resulted in over 40 colonies on each plate for DH5α and 2-3 colonies of TOP10 transformed cells on each plate. Following the same procedure as before; plasmids were extracted from 8 colonies, however only the 2 kb backbone was present following analysis by agarose gel electrophoresis (Figure 19).

Figure 19. Agarose gel electrophoresis of plasmids extracted from transformants where Dpn1 had been used in the preparation of the Gibson assembly mix, subsequently used for transformation. 2 kb bands can be observed corresponding to the pSB1C3 plasmid backbone.
Results
Conclusions
Two colonies obtained through transformation using a Gibson assembly of the naringenin operon, were found to contain a 7 kb plasmid. This corresponded to the size of the operon and pSB1C3 plasmid backbone. However, sequencing of these two plasmids did not provide sufficient evidence to confirm their correct assembly. Future experimentation should attempt to assemble the gBlocks one by one into the plasmid backbone and gain sequencing results that show full alignment. Following this, BL21 expression cells should be transformed with the 7 kb plasmid to produce naringenin. This would be extracted using ethyl acetate and analysed using HPLC. HPLC should be conducted using a series of known naringenin concentrations to create a standard curve. Following successful assembly of the operon under constitutive expression, Q5 site directed mutagenesis could be used to replace the J23100 promoter with the inducible T7 promoter. The same method could also be used to introduce the BG51 and BG28 promoters, suggested by the naringenin biosynthesis pathway modelling. This construct could be introduced into the chassis organism Pseudomonas sp.
References & Attributions
Attributions: Heather Bottomley and Patrycja Ubysz
References: 1. Zobel S, et al. (2015) Tn7-Based Device for Calibrated Heterologous Gene Expression in Pseudomonas putida. Acs Synth Biol 4(12):1341-1351.