After producing our target protein---bacteriocin, we investigate function of bacteriocins including Inhibition Zone and Inhibition Ability. We choose Bacillus subtilis as our target model
Difference between revisions of "Team:NCTU Formosa/Wet Lab/Functional Analysis"
| Line 252: | Line 252: | ||
margin-left: 5%; | margin-left: 5%; | ||
display: inline-block; | display: inline-block; | ||
| + | } | ||
| + | |||
| + | .p_value{ | ||
| + | width: 60%; | ||
| + | margin-left: 20%; | ||
| + | } | ||
| + | |||
| + | .f3{ | ||
| + | width: 28%; | ||
| + | margin-left: 6%; | ||
| + | display: inline-block; | ||
| + | } | ||
| + | .f4{ | ||
| + | width: 28%; | ||
| + | margin-left: 2%; | ||
| + | display: inline-block; | ||
| + | } | ||
| + | .f5{ | ||
| + | width: 28%; | ||
| + | margin-left: 2%; | ||
| + | display: inline-block; | ||
| + | } | ||
| + | |||
| + | .g3,.g4,.g5{ | ||
| + | width: 100%; | ||
} | } | ||
| Line 298: | Line 323: | ||
<img src="https://static.igem.org/mediawiki/2018/e/e9/T--NCTU_Formosa--FA.png" class="title_title"> | <img src="https://static.igem.org/mediawiki/2018/e/e9/T--NCTU_Formosa--FA.png" class="title_title"> | ||
<div class="text"> | <div class="text"> | ||
| − | <p> After producing our target protein---bacteriocin, we investigate function of bacteriocins including Inhibition Zone and Inhibition Ability. We choose <i><i>Bacillus subtilis</i></i> as our target model | + | <p> After producing our target protein---bacteriocin, we investigate function of bacteriocins including Inhibition Zone and Inhibition Ability. We choose <i><i>Bacillus subtilis</i></i> as our target model</p> |
</div> | </div> | ||
</div> | </div> | ||
| Line 304: | Line 329: | ||
<div class="title"><p>Inhibition Zone</p></div> | <div class="title"><p>Inhibition Zone</p></div> | ||
<div class="text"> | <div class="text"> | ||
| − | <p> To test the inhibition ability of bacteriocins in solid medium, we | + | <p> To test the inhibition ability of bacteriocins in solid medium, we use Inhibition Zone to measure the effective inhibition of bacteriocins. We use the condensed culture spread to the agar plate and add bacteriocins and let it to dry. In that case, the dose of inhibition zone is as same as microdilution which can be in contrast with liquid condition.</p> |
</div> | </div> | ||
</div> | </div> | ||
| Line 310: | Line 335: | ||
<div class="title"><p>Inhibition Ability Analysis</p></div> | <div class="title"><p>Inhibition Ability Analysis</p></div> | ||
<div class="text"> | <div class="text"> | ||
| − | <p> The purpose of this experiment is to verify that | + | <p> The purpose of this experiment is to verify that Bacteriocins have function. Firstly, we cultivated <i>Bacillus subtilis</i> as Bacteriocins’ inhibiting target. Centrifuge products which have been sonicated and used supernatants as samples. The positive control in this experiment is Ampicillin and the negative control is <i>Bacillus subtilis</i> without adding Bacteriocins. We use Elisa Reader to record O.D.<sub>600nm</sub> values of samples once an hour, if OD values decrease, it means that our bacteriocin inhibit the growth of <i>Bacillus subtilis</i>. Further, we can also know when does bacteriocin degrade by observing the growth curve of <i>Bacillus subtilis</i>. The pre-test data are all triplicated and normalized.</p> |
</div> | </div> | ||
</div> | </div> | ||
| + | <div class="title"><p>Inhibition Analysis of purified bacteriocins</p></div> | ||
| + | <div class="pic"> | ||
| + | <img src="https://static.igem.org/mediawiki/2018/1/1f/T--NCTU_Formosa--FT1.png" class="bar"> | ||
| + | <div class="explanation"><p> | ||
| + | <svg class="icon" aria-hidden="true" data-prefix="fas" data-icon="arrow-circle-up" class="svg-inline--fa fa-arrow-circle-up fa-w-16" role="img" xmlns="http://www.w3.org/2000/svg" viewBox="0 0 512 512"><path fill="currentColor" d="M8 256C8 119 119 8 256 8s248 111 248 248-111 248-248 248S8 393 8 256zm143.6 28.9l72.4-75.5V392c0 13.3 10.7 24 24 24h16c13.3 0 24-10.7 24-24V209.4l72.4 75.5c9.3 9.7 24.8 9.9 34.3.4l10.9-11c9.4-9.4 9.4-24.6 0-33.9L273 107.7c-9.4-9.4-24.6-9.4-33.9 0L106.3 240.4c-9.4 9.4-9.4 24.6 0 33.9l10.9 11c9.6 9.5 25.1 9.3 34.4-.4z"></path></svg> | ||
| + | Figure 1:Normalized growth curve of purified Leucocyciclin Q. | ||
| + | </p> | ||
| + | </div> | ||
| + | </div> | ||
| + | <div class="pic2"> | ||
| + | <img src="https://static.igem.org/mediawiki/2018/8/82/T--NCTU_Formosa--FT2.png" class="zone"> | ||
| + | <div class="explanation"><p> | ||
| + | <svg class="icon" aria-hidden="true" data-prefix="fas" data-icon="arrow-circle-up" class="svg-inline--fa fa-arrow-circle-up fa-w-16" role="img" xmlns="http://www.w3.org/2000/svg" viewBox="0 0 512 512"><path fill="currentColor" d="M8 256C8 119 119 8 256 8s248 111 248 248-111 248-248 248S8 393 8 256zm143.6 28.9l72.4-75.5V392c0 13.3 10.7 24 24 24h16c13.3 0 24-10.7 24-24V209.4l72.4 75.5c9.3 9.7 24.8 9.9 34.3.4l10.9-11c9.4-9.4 9.4-24.6 0-33.9L273 107.7c-9.4-9.4-24.6-9.4-33.9 0L106.3 240.4c-9.4 9.4-9.4 24.6 0 33.9l10.9 11c9.6 9.5 25.1 9.3 34.4-.4z"></path></svg> | ||
| + | Figure 2:Normalized growth curve of purified Enterocin B. | ||
| + | </p> | ||
| + | </div> | ||
| + | </div> | ||
| + | |||
| + | <div class="title"><p>Dose Response Assessment of purified bacteriocin (Inhibition Zone)</p></div> | ||
| + | <div class="f3"> | ||
| + | <img src="https://static.igem.org/mediawiki/2018/c/cf/T--NCTU_Formosa--FT3.png" class="g3"> | ||
| + | <div class="explanation"><p> | ||
| + | <svg class="icon" aria-hidden="true" data-prefix="fas" data-icon="arrow-circle-up" class="svg-inline--fa fa-arrow-circle-up fa-w-16" role="img" xmlns="http://www.w3.org/2000/svg" viewBox="0 0 512 512"><path fill="currentColor" d="M8 256C8 119 119 8 256 8s248 111 248 248-111 248-248 248S8 393 8 256zm143.6 28.9l72.4-75.5V392c0 13.3 10.7 24 24 24h16c13.3 0 24-10.7 24-24V209.4l72.4 75.5c9.3 9.7 24.8 9.9 34.3.4l10.9-11c9.4-9.4 9.4-24.6 0-33.9L273 107.7c-9.4-9.4-24.6-9.4-33.9 0L106.3 240.4c-9.4 9.4-9.4 24.6 0 33.9l10.9 11c9.6 9.5 25.1 9.3 34.4-.4z"></path></svg> | ||
| + | Figure 3:Inhibition zone test of Enterocin B for four dosages. | ||
| + | <br>A: Enterocin B 1.0 | ||
| + | <br>B: Enterocin B 0.5 | ||
| + | <br>C: Enterocin B 0.25 | ||
| + | <br>D: Enterocin B 0.125 | ||
| + | <br>E: Negative Control | ||
| + | </p> | ||
| + | </div> | ||
| + | </div> | ||
| + | <div class="f4"> | ||
| + | <img src="https://static.igem.org/mediawiki/2018/5/58/T--NCTU_Formosa--FT4.png" class="g4"> | ||
| + | <div class="explanation"><p> | ||
| + | <svg class="icon" aria-hidden="true" data-prefix="fas" data-icon="arrow-circle-up" class="svg-inline--fa fa-arrow-circle-up fa-w-16" role="img" xmlns="http://www.w3.org/2000/svg" viewBox="0 0 512 512"><path fill="currentColor" d="M8 256C8 119 119 8 256 8s248 111 248 248-111 248-248 248S8 393 8 256zm143.6 28.9l72.4-75.5V392c0 13.3 10.7 24 24 24h16c13.3 0 24-10.7 24-24V209.4l72.4 75.5c9.3 9.7 24.8 9.9 34.3.4l10.9-11c9.4-9.4 9.4-24.6 0-33.9L273 107.7c-9.4-9.4-24.6-9.4-33.9 0L106.3 240.4c-9.4 9.4-9.4 24.6 0 33.9l10.9 11c9.6 9.5 25.1 9.3 34.4-.4z"></path></svg> | ||
| + | Figure 4:Inhibition zone test of Leucocyclicin Q for four dosages. | ||
| + | <br>A: Leucocyclicin Q 1.0 | ||
| + | <br>B: Leucocyclicin Q 0.5 | ||
| + | <br>C: Leucocyclicin Q 0.25 | ||
| + | <br>D: Leucocyclicin Q 0.125 | ||
| + | <br>E: Negative Control | ||
| + | </p> | ||
| + | </div> | ||
| + | </div> | ||
| + | <div class="f5"> | ||
| + | <img src="https://static.igem.org/mediawiki/2018/d/df/T--NCTU_Formosa--FT5.png" class="g5"> | ||
| + | <div class="explanation"><p> | ||
| + | <svg class="icon" aria-hidden="true" data-prefix="fas" data-icon="arrow-circle-up" class="svg-inline--fa fa-arrow-circle-up fa-w-16" role="img" xmlns="http://www.w3.org/2000/svg" viewBox="0 0 512 512"><path fill="currentColor" d="M8 256C8 119 119 8 256 8s248 111 248 248-111 248-248 248S8 393 8 256zm143.6 28.9l72.4-75.5V392c0 13.3 10.7 24 24 24h16c13.3 0 24-10.7 24-24V209.4l72.4 75.5c9.3 9.7 24.8 9.9 34.3.4l10.9-11c9.4-9.4 9.4-24.6 0-33.9L273 107.7c-9.4-9.4-24.6-9.4-33.9 0L106.3 240.4c-9.4 9.4-9.4 24.6 0 33.9l10.9 11c9.6 9.5 25.1 9.3 34.4-.4z"></path></svg> | ||
| + | Figure 5:Inhibition zone test of Enterocin 96 for four dosages. | ||
| + | </p> | ||
| + | </div> | ||
| + | </div> | ||
| + | <div class="text"><p> Concentration of Enterocin B 1.0 is 263mg/L, Leucocyclicin Q 1.0 is 217mg/L and Enterocin 96 1.0 is 74mg/L.</p></div> | ||
| + | <div class="text"><p> Figure3~5 show that Enterocin B, Leucocyclicin Q and Enterocin 96 have significantly inhibition rangecomparing to negative control, column buffer, which is the buffer that protein solubilize in after purification.</p></div> | ||
<div class="title"><p>Inhibition Analysis of unpurified bacteriocins</p></div> | <div class="title"><p>Inhibition Analysis of unpurified bacteriocins</p></div> | ||
| − | <div class="text"> | + | <div class="text"> |
| − | + | <p> | |
| − | <img src="https://static.igem.org/mediawiki/2018/ | + | After purifying bacteriocins, we do the inhibition analysis of unpurified bacteriocins, which only been sonicated after expression, and we find out that bacteriocins also have strong inhibition ability to Bacillus subtilis. Therefore, we do a series of experiments using unpurified bacteriocins, and the following data shows that each bacteriocin can have effective function without purifying, keeping costs of using bacteriocins as a biostimulator low. |
| + | </p> | ||
| + | </div> | ||
| + | <img src="https://static.igem.org/mediawiki/2018/6/67/T--NCTU_Formosa--all_bar.png" class="all_bar"> | ||
<div class="explanation"><p> | <div class="explanation"><p> | ||
<svg class="icon" aria-hidden="true" data-prefix="fas" data-icon="arrow-circle-up" class="svg-inline--fa fa-arrow-circle-up fa-w-16" role="img" xmlns="http://www.w3.org/2000/svg" viewBox="0 0 512 512"><path fill="currentColor" d="M8 256C8 119 119 8 256 8s248 111 248 248-111 248-248 248S8 393 8 256zm143.6 28.9l72.4-75.5V392c0 13.3 10.7 24 24 24h16c13.3 0 24-10.7 24-24V209.4l72.4 75.5c9.3 9.7 24.8 9.9 34.3.4l10.9-11c9.4-9.4 9.4-24.6 0-33.9L273 107.7c-9.4-9.4-24.6-9.4-33.9 0L106.3 240.4c-9.4 9.4-9.4 24.6 0 33.9l10.9 11c9.6 9.5 25.1 9.3 34.4-.4z"></path></svg> | <svg class="icon" aria-hidden="true" data-prefix="fas" data-icon="arrow-circle-up" class="svg-inline--fa fa-arrow-circle-up fa-w-16" role="img" xmlns="http://www.w3.org/2000/svg" viewBox="0 0 512 512"><path fill="currentColor" d="M8 256C8 119 119 8 256 8s248 111 248 248-111 248-248 248S8 393 8 256zm143.6 28.9l72.4-75.5V392c0 13.3 10.7 24 24 24h16c13.3 0 24-10.7 24-24V209.4l72.4 75.5c9.3 9.7 24.8 9.9 34.3.4l10.9-11c9.4-9.4 9.4-24.6 0-33.9L273 107.7c-9.4-9.4-24.6-9.4-33.9 0L106.3 240.4c-9.4 9.4-9.4 24.6 0 33.9l10.9 11c9.6 9.5 25.1 9.3 34.4-.4z"></path></svg> | ||
| − | Figure | + | Figure 1:Bar diagram that showed percentage resistance of six bacteriocins to <i>Bacillus subtilis</i> after four hours.<br> |
Lacticin Z(96.64%), Bovicin HJ50(82.05%), Enterocin 96(46.47%), Enterocin B(46.06%), Leucocyclicin Q(40.58%),Durancin TW-49M(19.52%).</p> | Lacticin Z(96.64%), Bovicin HJ50(82.05%), Enterocin 96(46.47%), Enterocin B(46.06%), Leucocyclicin Q(40.58%),Durancin TW-49M(19.52%).</p> | ||
</div> | </div> | ||
| − | <img src="https://static.igem.org/mediawiki/2018/1/ | + | <img src="https://static.igem.org/mediawiki/2018/1/17/T--NCTU_Formosa--all_normalized.png" class="all_normalized"> |
<div class="explanation"><p> | <div class="explanation"><p> | ||
<svg class="icon" aria-hidden="true" data-prefix="fas" data-icon="arrow-circle-up" class="svg-inline--fa fa-arrow-circle-up fa-w-16" role="img" xmlns="http://www.w3.org/2000/svg" viewBox="0 0 512 512"><path fill="currentColor" d="M8 256C8 119 119 8 256 8s248 111 248 248-111 248-248 248S8 393 8 256zm143.6 28.9l72.4-75.5V392c0 13.3 10.7 24 24 24h16c13.3 0 24-10.7 24-24V209.4l72.4 75.5c9.3 9.7 24.8 9.9 34.3.4l10.9-11c9.4-9.4 9.4-24.6 0-33.9L273 107.7c-9.4-9.4-24.6-9.4-33.9 0L106.3 240.4c-9.4 9.4-9.4 24.6 0 33.9l10.9 11c9.6 9.5 25.1 9.3 34.4-.4z"></path></svg> | <svg class="icon" aria-hidden="true" data-prefix="fas" data-icon="arrow-circle-up" class="svg-inline--fa fa-arrow-circle-up fa-w-16" role="img" xmlns="http://www.w3.org/2000/svg" viewBox="0 0 512 512"><path fill="currentColor" d="M8 256C8 119 119 8 256 8s248 111 248 248-111 248-248 248S8 393 8 256zm143.6 28.9l72.4-75.5V392c0 13.3 10.7 24 24 24h16c13.3 0 24-10.7 24-24V209.4l72.4 75.5c9.3 9.7 24.8 9.9 34.3.4l10.9-11c9.4-9.4 9.4-24.6 0-33.9L273 107.7c-9.4-9.4-24.6-9.4-33.9 0L106.3 240.4c-9.4 9.4-9.4 24.6 0 33.9l10.9 11c9.6 9.5 25.1 9.3 34.4-.4z"></path></svg> | ||
| − | Figure | + | Figure 2:Normalized growth curve of bacteriocins and Negative Control. |
</p> | </p> | ||
</div> | </div> | ||
<div class="text"> | <div class="text"> | ||
<ul> | <ul> | ||
| − | <li>Figure | + | <li>Figure 1 shows six bacteriocins’ inhibiting ability to <i>B. sub</i>, and Durancin TW-49M has the most effective function, inhibiting 80% of <i>B. sub</i>’s growth.</li> |
| − | <li>Figure | + | <li>Figure 2 shows how O.D.<sub>600nm</sub> value of each sample decreases, indicating the strongest bacteriocin is Durancin TW-49M. It has strong inhibiting ability and its standard difference is also small, which means Durancin TW-49M has is both effective and stable.</li> |
| + | <li>The following data showed that each bacteriocin can have effective function without purifying, keeping costs of using bacteriocins as a biostimulator low.</li> | ||
</ul> | </ul> | ||
</div> | </div> | ||
| Line 342: | Line 426: | ||
<div class="explanation"><p> | <div class="explanation"><p> | ||
<svg class="icon" aria-hidden="true" data-prefix="fas" data-icon="arrow-circle-up" class="svg-inline--fa fa-arrow-circle-up fa-w-16" role="img" xmlns="http://www.w3.org/2000/svg" viewBox="0 0 512 512"><path fill="currentColor" d="M8 256C8 119 119 8 256 8s248 111 248 248-111 248-248 248S8 393 8 256zm143.6 28.9l72.4-75.5V392c0 13.3 10.7 24 24 24h16c13.3 0 24-10.7 24-24V209.4l72.4 75.5c9.3 9.7 24.8 9.9 34.3.4l10.9-11c9.4-9.4 9.4-24.6 0-33.9L273 107.7c-9.4-9.4-24.6-9.4-33.9 0L106.3 240.4c-9.4 9.4-9.4 24.6 0 33.9l10.9 11c9.6 9.5 25.1 9.3 34.4-.4z"></path></svg> | <svg class="icon" aria-hidden="true" data-prefix="fas" data-icon="arrow-circle-up" class="svg-inline--fa fa-arrow-circle-up fa-w-16" role="img" xmlns="http://www.w3.org/2000/svg" viewBox="0 0 512 512"><path fill="currentColor" d="M8 256C8 119 119 8 256 8s248 111 248 248-111 248-248 248S8 393 8 256zm143.6 28.9l72.4-75.5V392c0 13.3 10.7 24 24 24h16c13.3 0 24-10.7 24-24V209.4l72.4 75.5c9.3 9.7 24.8 9.9 34.3.4l10.9-11c9.4-9.4 9.4-24.6 0-33.9L273 107.7c-9.4-9.4-24.6-9.4-33.9 0L106.3 240.4c-9.4 9.4-9.4 24.6 0 33.9l10.9 11c9.6 9.5 25.1 9.3 34.4-.4z"></path></svg> | ||
| − | Figure | + | Figure 3:Bar diagram that showed percentage resistance of Durancin TW-49M to <i>Bacillus subtilis</i> after acting for four hours. |
Durancin TW-49M (18.94%) | Durancin TW-49M (18.94%) | ||
</p> | </p> | ||
| Line 351: | Line 435: | ||
<div class="explanation"><p> | <div class="explanation"><p> | ||
<svg class="icon" aria-hidden="true" data-prefix="fas" data-icon="arrow-circle-up" class="svg-inline--fa fa-arrow-circle-up fa-w-16" role="img" xmlns="http://www.w3.org/2000/svg" viewBox="0 0 512 512"><path fill="currentColor" d="M8 256C8 119 119 8 256 8s248 111 248 248-111 248-248 248S8 393 8 256zm143.6 28.9l72.4-75.5V392c0 13.3 10.7 24 24 24h16c13.3 0 24-10.7 24-24V209.4l72.4 75.5c9.3 9.7 24.8 9.9 34.3.4l10.9-11c9.4-9.4 9.4-24.6 0-33.9L273 107.7c-9.4-9.4-24.6-9.4-33.9 0L106.3 240.4c-9.4 9.4-9.4 24.6 0 33.9l10.9 11c9.6 9.5 25.1 9.3 34.4-.4z"></path></svg> | <svg class="icon" aria-hidden="true" data-prefix="fas" data-icon="arrow-circle-up" class="svg-inline--fa fa-arrow-circle-up fa-w-16" role="img" xmlns="http://www.w3.org/2000/svg" viewBox="0 0 512 512"><path fill="currentColor" d="M8 256C8 119 119 8 256 8s248 111 248 248-111 248-248 248S8 393 8 256zm143.6 28.9l72.4-75.5V392c0 13.3 10.7 24 24 24h16c13.3 0 24-10.7 24-24V209.4l72.4 75.5c9.3 9.7 24.8 9.9 34.3.4l10.9-11c9.4-9.4 9.4-24.6 0-33.9L273 107.7c-9.4-9.4-24.6-9.4-33.9 0L106.3 240.4c-9.4 9.4-9.4 24.6 0 33.9l10.9 11c9.6 9.5 25.1 9.3 34.4-.4z"></path></svg> | ||
| − | Figure | + | Figure 4:Inhibition Zone Test of Durancin TW-49M. A: Durancin TW-49M; B: Negative Control |
</p> | </p> | ||
</div> | </div> | ||
| Line 358: | Line 442: | ||
<div class="explanation"><p> | <div class="explanation"><p> | ||
<svg class="icon" aria-hidden="true" data-prefix="fas" data-icon="arrow-circle-up" class="svg-inline--fa fa-arrow-circle-up fa-w-16" role="img" xmlns="http://www.w3.org/2000/svg" viewBox="0 0 512 512"><path fill="currentColor" d="M8 256C8 119 119 8 256 8s248 111 248 248-111 248-248 248S8 393 8 256zm143.6 28.9l72.4-75.5V392c0 13.3 10.7 24 24 24h16c13.3 0 24-10.7 24-24V209.4l72.4 75.5c9.3 9.7 24.8 9.9 34.3.4l10.9-11c9.4-9.4 9.4-24.6 0-33.9L273 107.7c-9.4-9.4-24.6-9.4-33.9 0L106.3 240.4c-9.4 9.4-9.4 24.6 0 33.9l10.9 11c9.6 9.5 25.1 9.3 34.4-.4z"></path></svg> | <svg class="icon" aria-hidden="true" data-prefix="fas" data-icon="arrow-circle-up" class="svg-inline--fa fa-arrow-circle-up fa-w-16" role="img" xmlns="http://www.w3.org/2000/svg" viewBox="0 0 512 512"><path fill="currentColor" d="M8 256C8 119 119 8 256 8s248 111 248 248-111 248-248 248S8 393 8 256zm143.6 28.9l72.4-75.5V392c0 13.3 10.7 24 24 24h16c13.3 0 24-10.7 24-24V209.4l72.4 75.5c9.3 9.7 24.8 9.9 34.3.4l10.9-11c9.4-9.4 9.4-24.6 0-33.9L273 107.7c-9.4-9.4-24.6-9.4-33.9 0L106.3 240.4c-9.4 9.4-9.4 24.6 0 33.9l10.9 11c9.6 9.5 25.1 9.3 34.4-.4z"></path></svg> | ||
| − | Figure | + | Figure 5:Normalized growth curve of <i>Bacillus subtilis</i> that showed Durancin TW-49M inhibiting ability throughout four hours. |
</p> | </p> | ||
</div> | </div> | ||
| Line 367: | Line 451: | ||
<div class="explanation"><p> | <div class="explanation"><p> | ||
<svg class="icon" aria-hidden="true" data-prefix="fas" data-icon="arrow-circle-up" class="svg-inline--fa fa-arrow-circle-up fa-w-16" role="img" xmlns="http://www.w3.org/2000/svg" viewBox="0 0 512 512"><path fill="currentColor" d="M8 256C8 119 119 8 256 8s248 111 248 248-111 248-248 248S8 393 8 256zm143.6 28.9l72.4-75.5V392c0 13.3 10.7 24 24 24h16c13.3 0 24-10.7 24-24V209.4l72.4 75.5c9.3 9.7 24.8 9.9 34.3.4l10.9-11c9.4-9.4 9.4-24.6 0-33.9L273 107.7c-9.4-9.4-24.6-9.4-33.9 0L106.3 240.4c-9.4 9.4-9.4 24.6 0 33.9l10.9 11c9.6 9.5 25.1 9.3 34.4-.4z"></path></svg> | <svg class="icon" aria-hidden="true" data-prefix="fas" data-icon="arrow-circle-up" class="svg-inline--fa fa-arrow-circle-up fa-w-16" role="img" xmlns="http://www.w3.org/2000/svg" viewBox="0 0 512 512"><path fill="currentColor" d="M8 256C8 119 119 8 256 8s248 111 248 248-111 248-248 248S8 393 8 256zm143.6 28.9l72.4-75.5V392c0 13.3 10.7 24 24 24h16c13.3 0 24-10.7 24-24V209.4l72.4 75.5c9.3 9.7 24.8 9.9 34.3.4l10.9-11c9.4-9.4 9.4-24.6 0-33.9L273 107.7c-9.4-9.4-24.6-9.4-33.9 0L106.3 240.4c-9.4 9.4-9.4 24.6 0 33.9l10.9 11c9.6 9.5 25.1 9.3 34.4-.4z"></path></svg> | ||
| − | Figure | + | Figure 6:Bar diagram that showed percentage resistance of Enterocin B to <i>Bacillus subtilis</i> after acting for four hours.<br>Enterocin B(44.24%) |
</p> | </p> | ||
</div> | </div> | ||
| Line 375: | Line 459: | ||
<div class="explanation"><p> | <div class="explanation"><p> | ||
<svg class="icon" aria-hidden="true" data-prefix="fas" data-icon="arrow-circle-up" class="svg-inline--fa fa-arrow-circle-up fa-w-16" role="img" xmlns="http://www.w3.org/2000/svg" viewBox="0 0 512 512"><path fill="currentColor" d="M8 256C8 119 119 8 256 8s248 111 248 248-111 248-248 248S8 393 8 256zm143.6 28.9l72.4-75.5V392c0 13.3 10.7 24 24 24h16c13.3 0 24-10.7 24-24V209.4l72.4 75.5c9.3 9.7 24.8 9.9 34.3.4l10.9-11c9.4-9.4 9.4-24.6 0-33.9L273 107.7c-9.4-9.4-24.6-9.4-33.9 0L106.3 240.4c-9.4 9.4-9.4 24.6 0 33.9l10.9 11c9.6 9.5 25.1 9.3 34.4-.4z"></path></svg> | <svg class="icon" aria-hidden="true" data-prefix="fas" data-icon="arrow-circle-up" class="svg-inline--fa fa-arrow-circle-up fa-w-16" role="img" xmlns="http://www.w3.org/2000/svg" viewBox="0 0 512 512"><path fill="currentColor" d="M8 256C8 119 119 8 256 8s248 111 248 248-111 248-248 248S8 393 8 256zm143.6 28.9l72.4-75.5V392c0 13.3 10.7 24 24 24h16c13.3 0 24-10.7 24-24V209.4l72.4 75.5c9.3 9.7 24.8 9.9 34.3.4l10.9-11c9.4-9.4 9.4-24.6 0-33.9L273 107.7c-9.4-9.4-24.6-9.4-33.9 0L106.3 240.4c-9.4 9.4-9.4 24.6 0 33.9l10.9 11c9.6 9.5 25.1 9.3 34.4-.4z"></path></svg> | ||
| − | Figure | + | Figure 7:Inhibition Zone Test of Enterocin B<br> |
A: Enterocin B; B: Negative Control | A: Enterocin B; B: Negative Control | ||
</p> | </p> | ||
| Line 383: | Line 467: | ||
<div class="explanation"><p> | <div class="explanation"><p> | ||
<svg class="icon" aria-hidden="true" data-prefix="fas" data-icon="arrow-circle-up" class="svg-inline--fa fa-arrow-circle-up fa-w-16" role="img" xmlns="http://www.w3.org/2000/svg" viewBox="0 0 512 512"><path fill="currentColor" d="M8 256C8 119 119 8 256 8s248 111 248 248-111 248-248 248S8 393 8 256zm143.6 28.9l72.4-75.5V392c0 13.3 10.7 24 24 24h16c13.3 0 24-10.7 24-24V209.4l72.4 75.5c9.3 9.7 24.8 9.9 34.3.4l10.9-11c9.4-9.4 9.4-24.6 0-33.9L273 107.7c-9.4-9.4-24.6-9.4-33.9 0L106.3 240.4c-9.4 9.4-9.4 24.6 0 33.9l10.9 11c9.6 9.5 25.1 9.3 34.4-.4z"></path></svg> | <svg class="icon" aria-hidden="true" data-prefix="fas" data-icon="arrow-circle-up" class="svg-inline--fa fa-arrow-circle-up fa-w-16" role="img" xmlns="http://www.w3.org/2000/svg" viewBox="0 0 512 512"><path fill="currentColor" d="M8 256C8 119 119 8 256 8s248 111 248 248-111 248-248 248S8 393 8 256zm143.6 28.9l72.4-75.5V392c0 13.3 10.7 24 24 24h16c13.3 0 24-10.7 24-24V209.4l72.4 75.5c9.3 9.7 24.8 9.9 34.3.4l10.9-11c9.4-9.4 9.4-24.6 0-33.9L273 107.7c-9.4-9.4-24.6-9.4-33.9 0L106.3 240.4c-9.4 9.4-9.4 24.6 0 33.9l10.9 11c9.6 9.5 25.1 9.3 34.4-.4z"></path></svg> | ||
| − | Figure | + | Figure 8:Normalized growth curve of <i>Bacillus subtilis</i> that showed Enterocin B inhibiting ability throughout four hours. |
| + | </p> | ||
| + | </div> | ||
| + | |||
| + | <div class="title_1"><p>Lacticin Z</p></div> | ||
| + | <div class="pic"> | ||
| + | <img src="https://static.igem.org/mediawiki/2018/a/ac/T--NCTU_Formosa--FT30.png" class="bar"> | ||
| + | <div class="explanation"><p> | ||
| + | <svg class="icon" aria-hidden="true" data-prefix="fas" data-icon="arrow-circle-up" class="svg-inline--fa fa-arrow-circle-up fa-w-16" role="img" xmlns="http://www.w3.org/2000/svg" viewBox="0 0 512 512"><path fill="currentColor" d="M8 256C8 119 119 8 256 8s248 111 248 248-111 248-248 248S8 393 8 256zm143.6 28.9l72.4-75.5V392c0 13.3 10.7 24 24 24h16c13.3 0 24-10.7 24-24V209.4l72.4 75.5c9.3 9.7 24.8 9.9 34.3.4l10.9-11c9.4-9.4 9.4-24.6 0-33.9L273 107.7c-9.4-9.4-24.6-9.4-33.9 0L106.3 240.4c-9.4 9.4-9.4 24.6 0 33.9l10.9 11c9.6 9.5 25.1 9.3 34.4-.4z"></path></svg> | ||
| + | Figure 14:Bar diagram that showed percentage resistance of Lacticin Z to <i>Bacillus subtilis</i> after acting for four hours.<br>Lacticin Z (96.32%) | ||
| + | |||
| + | </p> | ||
| + | </div> | ||
| + | </div> | ||
| + | <div class="pic2"> | ||
| + | <img src="https://static.igem.org/mediawiki/2018/7/74/T--NCTU_Formosa--FT15.png" class="zone"> | ||
| + | <div class="explanation"><p> | ||
| + | <svg class="icon" aria-hidden="true" data-prefix="fas" data-icon="arrow-circle-up" class="svg-inline--fa fa-arrow-circle-up fa-w-16" role="img" xmlns="http://www.w3.org/2000/svg" viewBox="0 0 512 512"><path fill="currentColor" d="M8 256C8 119 119 8 256 8s248 111 248 248-111 248-248 248S8 393 8 256zm143.6 28.9l72.4-75.5V392c0 13.3 10.7 24 24 24h16c13.3 0 24-10.7 24-24V209.4l72.4 75.5c9.3 9.7 24.8 9.9 34.3.4l10.9-11c9.4-9.4 9.4-24.6 0-33.9L273 107.7c-9.4-9.4-24.6-9.4-33.9 0L106.3 240.4c-9.4 9.4-9.4 24.6 0 33.9l10.9 11c9.6 9.5 25.1 9.3 34.4-.4z"></path></svg> | ||
| + | Figure 15:Inhibition Zone Test of Lacticin Z.<br>A: Lacticin Z | ||
| + | </p> | ||
| + | </div> | ||
| + | </div> | ||
| + | <img src="https://static.igem.org/mediawiki/2018/2/2a/T--NCTU_Formosa--Lacticin_z_curve.png" class="normalized"> | ||
| + | <div class="explanation"><p> | ||
| + | <svg class="icon" aria-hidden="true" data-prefix="fas" data-icon="arrow-circle-up" class="svg-inline--fa fa-arrow-circle-up fa-w-16" role="img" xmlns="http://www.w3.org/2000/svg" viewBox="0 0 512 512"><path fill="currentColor" d="M8 256C8 119 119 8 256 8s248 111 248 248-111 248-248 248S8 393 8 256zm143.6 28.9l72.4-75.5V392c0 13.3 10.7 24 24 24h16c13.3 0 24-10.7 24-24V209.4l72.4 75.5c9.3 9.7 24.8 9.9 34.3.4l10.9-11c9.4-9.4 9.4-24.6 0-33.9L273 107.7c-9.4-9.4-24.6-9.4-33.9 0L106.3 240.4c-9.4 9.4-9.4 24.6 0 33.9l10.9 11c9.6 9.5 25.1 9.3 34.4-.4z"></path></svg> | ||
| + | Figure 16:Normalized growth curve of <i>Bacillus subtilis</i> that showed Lacticin Z inhibiting ability throughout four hours. | ||
</p> | </p> | ||
</div> | </div> | ||
| Line 392: | Line 501: | ||
<div class="explanation"><p> | <div class="explanation"><p> | ||
<svg class="icon" aria-hidden="true" data-prefix="fas" data-icon="arrow-circle-up" class="svg-inline--fa fa-arrow-circle-up fa-w-16" role="img" xmlns="http://www.w3.org/2000/svg" viewBox="0 0 512 512"><path fill="currentColor" d="M8 256C8 119 119 8 256 8s248 111 248 248-111 248-248 248S8 393 8 256zm143.6 28.9l72.4-75.5V392c0 13.3 10.7 24 24 24h16c13.3 0 24-10.7 24-24V209.4l72.4 75.5c9.3 9.7 24.8 9.9 34.3.4l10.9-11c9.4-9.4 9.4-24.6 0-33.9L273 107.7c-9.4-9.4-24.6-9.4-33.9 0L106.3 240.4c-9.4 9.4-9.4 24.6 0 33.9l10.9 11c9.6 9.5 25.1 9.3 34.4-.4z"></path></svg> | <svg class="icon" aria-hidden="true" data-prefix="fas" data-icon="arrow-circle-up" class="svg-inline--fa fa-arrow-circle-up fa-w-16" role="img" xmlns="http://www.w3.org/2000/svg" viewBox="0 0 512 512"><path fill="currentColor" d="M8 256C8 119 119 8 256 8s248 111 248 248-111 248-248 248S8 393 8 256zm143.6 28.9l72.4-75.5V392c0 13.3 10.7 24 24 24h16c13.3 0 24-10.7 24-24V209.4l72.4 75.5c9.3 9.7 24.8 9.9 34.3.4l10.9-11c9.4-9.4 9.4-24.6 0-33.9L273 107.7c-9.4-9.4-24.6-9.4-33.9 0L106.3 240.4c-9.4 9.4-9.4 24.6 0 33.9l10.9 11c9.6 9.5 25.1 9.3 34.4-.4z"></path></svg> | ||
| − | Figure | + | Figure 12:Bar diagram that showed percentage resistance of Enterocin 96 to Bacillus subtilis after acting for four hours.<br>Enterocin 96 (45.16%) |
</p> | </p> | ||
</div> | </div> | ||
| Line 400: | Line 509: | ||
<div class="explanation"><p> | <div class="explanation"><p> | ||
<svg class="icon" aria-hidden="true" data-prefix="fas" data-icon="arrow-circle-up" class="svg-inline--fa fa-arrow-circle-up fa-w-16" role="img" xmlns="http://www.w3.org/2000/svg" viewBox="0 0 512 512"><path fill="currentColor" d="M8 256C8 119 119 8 256 8s248 111 248 248-111 248-248 248S8 393 8 256zm143.6 28.9l72.4-75.5V392c0 13.3 10.7 24 24 24h16c13.3 0 24-10.7 24-24V209.4l72.4 75.5c9.3 9.7 24.8 9.9 34.3.4l10.9-11c9.4-9.4 9.4-24.6 0-33.9L273 107.7c-9.4-9.4-24.6-9.4-33.9 0L106.3 240.4c-9.4 9.4-9.4 24.6 0 33.9l10.9 11c9.6 9.5 25.1 9.3 34.4-.4z"></path></svg> | <svg class="icon" aria-hidden="true" data-prefix="fas" data-icon="arrow-circle-up" class="svg-inline--fa fa-arrow-circle-up fa-w-16" role="img" xmlns="http://www.w3.org/2000/svg" viewBox="0 0 512 512"><path fill="currentColor" d="M8 256C8 119 119 8 256 8s248 111 248 248-111 248-248 248S8 393 8 256zm143.6 28.9l72.4-75.5V392c0 13.3 10.7 24 24 24h16c13.3 0 24-10.7 24-24V209.4l72.4 75.5c9.3 9.7 24.8 9.9 34.3.4l10.9-11c9.4-9.4 9.4-24.6 0-33.9L273 107.7c-9.4-9.4-24.6-9.4-33.9 0L106.3 240.4c-9.4 9.4-9.4 24.6 0 33.9l10.9 11c9.6 9.5 25.1 9.3 34.4-.4z"></path></svg> | ||
| − | Figure | + | Figure 18:Inhibition Zone Test of Enterocin 96<br>A: Enterocin 96; B: Negative Control |
| + | |||
</p> | </p> | ||
</div> | </div> | ||
| Line 407: | Line 517: | ||
<div class="explanation"><p> | <div class="explanation"><p> | ||
<svg class="icon" aria-hidden="true" data-prefix="fas" data-icon="arrow-circle-up" class="svg-inline--fa fa-arrow-circle-up fa-w-16" role="img" xmlns="http://www.w3.org/2000/svg" viewBox="0 0 512 512"><path fill="currentColor" d="M8 256C8 119 119 8 256 8s248 111 248 248-111 248-248 248S8 393 8 256zm143.6 28.9l72.4-75.5V392c0 13.3 10.7 24 24 24h16c13.3 0 24-10.7 24-24V209.4l72.4 75.5c9.3 9.7 24.8 9.9 34.3.4l10.9-11c9.4-9.4 9.4-24.6 0-33.9L273 107.7c-9.4-9.4-24.6-9.4-33.9 0L106.3 240.4c-9.4 9.4-9.4 24.6 0 33.9l10.9 11c9.6 9.5 25.1 9.3 34.4-.4z"></path></svg> | <svg class="icon" aria-hidden="true" data-prefix="fas" data-icon="arrow-circle-up" class="svg-inline--fa fa-arrow-circle-up fa-w-16" role="img" xmlns="http://www.w3.org/2000/svg" viewBox="0 0 512 512"><path fill="currentColor" d="M8 256C8 119 119 8 256 8s248 111 248 248-111 248-248 248S8 393 8 256zm143.6 28.9l72.4-75.5V392c0 13.3 10.7 24 24 24h16c13.3 0 24-10.7 24-24V209.4l72.4 75.5c9.3 9.7 24.8 9.9 34.3.4l10.9-11c9.4-9.4 9.4-24.6 0-33.9L273 107.7c-9.4-9.4-24.6-9.4-33.9 0L106.3 240.4c-9.4 9.4-9.4 24.6 0 33.9l10.9 11c9.6 9.5 25.1 9.3 34.4-.4z"></path></svg> | ||
| − | Figure | + | Figure 14:Normalized growth curve of <i>Bacillus subtilis</i> that showed Enterocin 96 inhibiting ability throughout four hours. |
</p> | </p> | ||
</div> | </div> | ||
| Line 416: | Line 526: | ||
<div class="explanation"><p> | <div class="explanation"><p> | ||
<svg class="icon" aria-hidden="true" data-prefix="fas" data-icon="arrow-circle-up" class="svg-inline--fa fa-arrow-circle-up fa-w-16" role="img" xmlns="http://www.w3.org/2000/svg" viewBox="0 0 512 512"><path fill="currentColor" d="M8 256C8 119 119 8 256 8s248 111 248 248-111 248-248 248S8 393 8 256zm143.6 28.9l72.4-75.5V392c0 13.3 10.7 24 24 24h16c13.3 0 24-10.7 24-24V209.4l72.4 75.5c9.3 9.7 24.8 9.9 34.3.4l10.9-11c9.4-9.4 9.4-24.6 0-33.9L273 107.7c-9.4-9.4-24.6-9.4-33.9 0L106.3 240.4c-9.4 9.4-9.4 24.6 0 33.9l10.9 11c9.6 9.5 25.1 9.3 34.4-.4z"></path></svg> | <svg class="icon" aria-hidden="true" data-prefix="fas" data-icon="arrow-circle-up" class="svg-inline--fa fa-arrow-circle-up fa-w-16" role="img" xmlns="http://www.w3.org/2000/svg" viewBox="0 0 512 512"><path fill="currentColor" d="M8 256C8 119 119 8 256 8s248 111 248 248-111 248-248 248S8 393 8 256zm143.6 28.9l72.4-75.5V392c0 13.3 10.7 24 24 24h16c13.3 0 24-10.7 24-24V209.4l72.4 75.5c9.3 9.7 24.8 9.9 34.3.4l10.9-11c9.4-9.4 9.4-24.6 0-33.9L273 107.7c-9.4-9.4-24.6-9.4-33.9 0L106.3 240.4c-9.4 9.4-9.4 24.6 0 33.9l10.9 11c9.6 9.5 25.1 9.3 34.4-.4z"></path></svg> | ||
| − | Figure | + | Figure 15:Bar diagram that showed percentage resistance of Bovicin HJ50 to <i>Bacillus subtilis</i> after four hours.<br>Bovicin HJ50 (82.05%) |
</p> | </p> | ||
</div> | </div> | ||
| Line 424: | Line 534: | ||
<div class="explanation"><p> | <div class="explanation"><p> | ||
<svg class="icon" aria-hidden="true" data-prefix="fas" data-icon="arrow-circle-up" class="svg-inline--fa fa-arrow-circle-up fa-w-16" role="img" xmlns="http://www.w3.org/2000/svg" viewBox="0 0 512 512"><path fill="currentColor" d="M8 256C8 119 119 8 256 8s248 111 248 248-111 248-248 248S8 393 8 256zm143.6 28.9l72.4-75.5V392c0 13.3 10.7 24 24 24h16c13.3 0 24-10.7 24-24V209.4l72.4 75.5c9.3 9.7 24.8 9.9 34.3.4l10.9-11c9.4-9.4 9.4-24.6 0-33.9L273 107.7c-9.4-9.4-24.6-9.4-33.9 0L106.3 240.4c-9.4 9.4-9.4 24.6 0 33.9l10.9 11c9.6 9.5 25.1 9.3 34.4-.4z"></path></svg> | <svg class="icon" aria-hidden="true" data-prefix="fas" data-icon="arrow-circle-up" class="svg-inline--fa fa-arrow-circle-up fa-w-16" role="img" xmlns="http://www.w3.org/2000/svg" viewBox="0 0 512 512"><path fill="currentColor" d="M8 256C8 119 119 8 256 8s248 111 248 248-111 248-248 248S8 393 8 256zm143.6 28.9l72.4-75.5V392c0 13.3 10.7 24 24 24h16c13.3 0 24-10.7 24-24V209.4l72.4 75.5c9.3 9.7 24.8 9.9 34.3.4l10.9-11c9.4-9.4 9.4-24.6 0-33.9L273 107.7c-9.4-9.4-24.6-9.4-33.9 0L106.3 240.4c-9.4 9.4-9.4 24.6 0 33.9l10.9 11c9.6 9.5 25.1 9.3 34.4-.4z"></path></svg> | ||
| − | Figure | + | Figure 21:Inhibition Zone Test of Bovicin HJ50.<br>A: Bovicin HJ50; B: Negative Control |
| + | |||
</p> | </p> | ||
</div> | </div> | ||
| Line 431: | Line 542: | ||
<div class="explanation"><p> | <div class="explanation"><p> | ||
<svg class="icon" aria-hidden="true" data-prefix="fas" data-icon="arrow-circle-up" class="svg-inline--fa fa-arrow-circle-up fa-w-16" role="img" xmlns="http://www.w3.org/2000/svg" viewBox="0 0 512 512"><path fill="currentColor" d="M8 256C8 119 119 8 256 8s248 111 248 248-111 248-248 248S8 393 8 256zm143.6 28.9l72.4-75.5V392c0 13.3 10.7 24 24 24h16c13.3 0 24-10.7 24-24V209.4l72.4 75.5c9.3 9.7 24.8 9.9 34.3.4l10.9-11c9.4-9.4 9.4-24.6 0-33.9L273 107.7c-9.4-9.4-24.6-9.4-33.9 0L106.3 240.4c-9.4 9.4-9.4 24.6 0 33.9l10.9 11c9.6 9.5 25.1 9.3 34.4-.4z"></path></svg> | <svg class="icon" aria-hidden="true" data-prefix="fas" data-icon="arrow-circle-up" class="svg-inline--fa fa-arrow-circle-up fa-w-16" role="img" xmlns="http://www.w3.org/2000/svg" viewBox="0 0 512 512"><path fill="currentColor" d="M8 256C8 119 119 8 256 8s248 111 248 248-111 248-248 248S8 393 8 256zm143.6 28.9l72.4-75.5V392c0 13.3 10.7 24 24 24h16c13.3 0 24-10.7 24-24V209.4l72.4 75.5c9.3 9.7 24.8 9.9 34.3.4l10.9-11c9.4-9.4 9.4-24.6 0-33.9L273 107.7c-9.4-9.4-24.6-9.4-33.9 0L106.3 240.4c-9.4 9.4-9.4 24.6 0 33.9l10.9 11c9.6 9.5 25.1 9.3 34.4-.4z"></path></svg> | ||
| − | Figure | + | Figure 22:Normalized growth curve of <i>Bacillus subtilis</i> that showed Bovicin HJ50 inhibiting ability throughout four hours. |
</p> | </p> | ||
</div> | </div> | ||
| Line 440: | Line 551: | ||
<div class="explanation"><p> | <div class="explanation"><p> | ||
<svg class="icon" aria-hidden="true" data-prefix="fas" data-icon="arrow-circle-up" class="svg-inline--fa fa-arrow-circle-up fa-w-16" role="img" xmlns="http://www.w3.org/2000/svg" viewBox="0 0 512 512"><path fill="currentColor" d="M8 256C8 119 119 8 256 8s248 111 248 248-111 248-248 248S8 393 8 256zm143.6 28.9l72.4-75.5V392c0 13.3 10.7 24 24 24h16c13.3 0 24-10.7 24-24V209.4l72.4 75.5c9.3 9.7 24.8 9.9 34.3.4l10.9-11c9.4-9.4 9.4-24.6 0-33.9L273 107.7c-9.4-9.4-24.6-9.4-33.9 0L106.3 240.4c-9.4 9.4-9.4 24.6 0 33.9l10.9 11c9.6 9.5 25.1 9.3 34.4-.4z"></path></svg> | <svg class="icon" aria-hidden="true" data-prefix="fas" data-icon="arrow-circle-up" class="svg-inline--fa fa-arrow-circle-up fa-w-16" role="img" xmlns="http://www.w3.org/2000/svg" viewBox="0 0 512 512"><path fill="currentColor" d="M8 256C8 119 119 8 256 8s248 111 248 248-111 248-248 248S8 393 8 256zm143.6 28.9l72.4-75.5V392c0 13.3 10.7 24 24 24h16c13.3 0 24-10.7 24-24V209.4l72.4 75.5c9.3 9.7 24.8 9.9 34.3.4l10.9-11c9.4-9.4 9.4-24.6 0-33.9L273 107.7c-9.4-9.4-24.6-9.4-33.9 0L106.3 240.4c-9.4 9.4-9.4 24.6 0 33.9l10.9 11c9.6 9.5 25.1 9.3 34.4-.4z"></path></svg> | ||
| − | Figure | + | Figure 18:Bar diagram that showed percentage resistance of Leucocyclicin Q to <i>Bacillus subtilis</i> after four hours.<br>Leucocyclicin Q (40.58%) |
</p> | </p> | ||
</div> | </div> | ||
| Line 448: | Line 559: | ||
<div class="explanation"><p> | <div class="explanation"><p> | ||
<svg class="icon" aria-hidden="true" data-prefix="fas" data-icon="arrow-circle-up" class="svg-inline--fa fa-arrow-circle-up fa-w-16" role="img" xmlns="http://www.w3.org/2000/svg" viewBox="0 0 512 512"><path fill="currentColor" d="M8 256C8 119 119 8 256 8s248 111 248 248-111 248-248 248S8 393 8 256zm143.6 28.9l72.4-75.5V392c0 13.3 10.7 24 24 24h16c13.3 0 24-10.7 24-24V209.4l72.4 75.5c9.3 9.7 24.8 9.9 34.3.4l10.9-11c9.4-9.4 9.4-24.6 0-33.9L273 107.7c-9.4-9.4-24.6-9.4-33.9 0L106.3 240.4c-9.4 9.4-9.4 24.6 0 33.9l10.9 11c9.6 9.5 25.1 9.3 34.4-.4z"></path></svg> | <svg class="icon" aria-hidden="true" data-prefix="fas" data-icon="arrow-circle-up" class="svg-inline--fa fa-arrow-circle-up fa-w-16" role="img" xmlns="http://www.w3.org/2000/svg" viewBox="0 0 512 512"><path fill="currentColor" d="M8 256C8 119 119 8 256 8s248 111 248 248-111 248-248 248S8 393 8 256zm143.6 28.9l72.4-75.5V392c0 13.3 10.7 24 24 24h16c13.3 0 24-10.7 24-24V209.4l72.4 75.5c9.3 9.7 24.8 9.9 34.3.4l10.9-11c9.4-9.4 9.4-24.6 0-33.9L273 107.7c-9.4-9.4-24.6-9.4-33.9 0L106.3 240.4c-9.4 9.4-9.4 24.6 0 33.9l10.9 11c9.6 9.5 25.1 9.3 34.4-.4z"></path></svg> | ||
| − | + | Figure 19:Inhibition Zone Test of Enterocin 96.<br>A: Enterocin 96 | |
</p> | </p> | ||
</div> | </div> | ||
| Line 455: | Line 566: | ||
<div class="explanation"><p> | <div class="explanation"><p> | ||
<svg class="icon" aria-hidden="true" data-prefix="fas" data-icon="arrow-circle-up" class="svg-inline--fa fa-arrow-circle-up fa-w-16" role="img" xmlns="http://www.w3.org/2000/svg" viewBox="0 0 512 512"><path fill="currentColor" d="M8 256C8 119 119 8 256 8s248 111 248 248-111 248-248 248S8 393 8 256zm143.6 28.9l72.4-75.5V392c0 13.3 10.7 24 24 24h16c13.3 0 24-10.7 24-24V209.4l72.4 75.5c9.3 9.7 24.8 9.9 34.3.4l10.9-11c9.4-9.4 9.4-24.6 0-33.9L273 107.7c-9.4-9.4-24.6-9.4-33.9 0L106.3 240.4c-9.4 9.4-9.4 24.6 0 33.9l10.9 11c9.6 9.5 25.1 9.3 34.4-.4z"></path></svg> | <svg class="icon" aria-hidden="true" data-prefix="fas" data-icon="arrow-circle-up" class="svg-inline--fa fa-arrow-circle-up fa-w-16" role="img" xmlns="http://www.w3.org/2000/svg" viewBox="0 0 512 512"><path fill="currentColor" d="M8 256C8 119 119 8 256 8s248 111 248 248-111 248-248 248S8 393 8 256zm143.6 28.9l72.4-75.5V392c0 13.3 10.7 24 24 24h16c13.3 0 24-10.7 24-24V209.4l72.4 75.5c9.3 9.7 24.8 9.9 34.3.4l10.9-11c9.4-9.4 9.4-24.6 0-33.9L273 107.7c-9.4-9.4-24.6-9.4-33.9 0L106.3 240.4c-9.4 9.4-9.4 24.6 0 33.9l10.9 11c9.6 9.5 25.1 9.3 34.4-.4z"></path></svg> | ||
| − | Figure | + | Figure 20:Normalized growth curve of <i>Bacillus subtilis</i> that showed Leucocyclicin Q inhibiting ability throughout four hours. |
</p> | </p> | ||
</div> | </div> | ||
| Line 462: | Line 573: | ||
<div class="text"> | <div class="text"> | ||
<p> | <p> | ||
| − | Secondly, we diluted samples into three different concentration, which is 0.5, 0.25 and 0.125 times of primitive samples. Dose Response Assessment showed that the inhibition wasn’t caused by endotoxin. The positive control in this experiment is Ampicillin and the negative control is <i>Bacillus subtilis</i> without adding | + | Secondly, we diluted samples into three different concentration, which is 0.5, 0.25 and 0.125 times of primitive samples. Dose Response Assessment showed that the inhibition wasn’t caused by endotoxin. The positive control in this experiment is Ampicillin and the negative control is <i>Bacillus subtilis</i> without adding Bacteriocins. The Dose Response Assessment data are all triplicated and normalized. |
</p> | </p> | ||
</div> | </div> | ||
| Line 469: | Line 580: | ||
<div class="explanation"><p> | <div class="explanation"><p> | ||
<svg class="icon" aria-hidden="true" data-prefix="fas" data-icon="arrow-circle-up" class="svg-inline--fa fa-arrow-circle-up fa-w-16" role="img" xmlns="http://www.w3.org/2000/svg" viewBox="0 0 512 512"><path fill="currentColor" d="M8 256C8 119 119 8 256 8s248 111 248 248-111 248-248 248S8 393 8 256zm143.6 28.9l72.4-75.5V392c0 13.3 10.7 24 24 24h16c13.3 0 24-10.7 24-24V209.4l72.4 75.5c9.3 9.7 24.8 9.9 34.3.4l10.9-11c9.4-9.4 9.4-24.6 0-33.9L273 107.7c-9.4-9.4-24.6-9.4-33.9 0L106.3 240.4c-9.4 9.4-9.4 24.6 0 33.9l10.9 11c9.6 9.5 25.1 9.3 34.4-.4z"></path></svg> | <svg class="icon" aria-hidden="true" data-prefix="fas" data-icon="arrow-circle-up" class="svg-inline--fa fa-arrow-circle-up fa-w-16" role="img" xmlns="http://www.w3.org/2000/svg" viewBox="0 0 512 512"><path fill="currentColor" d="M8 256C8 119 119 8 256 8s248 111 248 248-111 248-248 248S8 393 8 256zm143.6 28.9l72.4-75.5V392c0 13.3 10.7 24 24 24h16c13.3 0 24-10.7 24-24V209.4l72.4 75.5c9.3 9.7 24.8 9.9 34.3.4l10.9-11c9.4-9.4 9.4-24.6 0-33.9L273 107.7c-9.4-9.4-24.6-9.4-33.9 0L106.3 240.4c-9.4 9.4-9.4 24.6 0 33.9l10.9 11c9.6 9.5 25.1 9.3 34.4-.4z"></path></svg> | ||
| − | Figure | + | Figure 21:Bar diagram that showed dose response of Enterocin 96 after four hours. |
</p> | </p> | ||
</div> | </div> | ||
| Line 477: | Line 588: | ||
<div class="explanation"><p> | <div class="explanation"><p> | ||
<svg class="icon" aria-hidden="true" data-prefix="fas" data-icon="arrow-circle-up" class="svg-inline--fa fa-arrow-circle-up fa-w-16" role="img" xmlns="http://www.w3.org/2000/svg" viewBox="0 0 512 512"><path fill="currentColor" d="M8 256C8 119 119 8 256 8s248 111 248 248-111 248-248 248S8 393 8 256zm143.6 28.9l72.4-75.5V392c0 13.3 10.7 24 24 24h16c13.3 0 24-10.7 24-24V209.4l72.4 75.5c9.3 9.7 24.8 9.9 34.3.4l10.9-11c9.4-9.4 9.4-24.6 0-33.9L273 107.7c-9.4-9.4-24.6-9.4-33.9 0L106.3 240.4c-9.4 9.4-9.4 24.6 0 33.9l10.9 11c9.6 9.5 25.1 9.3 34.4-.4z"></path></svg> | <svg class="icon" aria-hidden="true" data-prefix="fas" data-icon="arrow-circle-up" class="svg-inline--fa fa-arrow-circle-up fa-w-16" role="img" xmlns="http://www.w3.org/2000/svg" viewBox="0 0 512 512"><path fill="currentColor" d="M8 256C8 119 119 8 256 8s248 111 248 248-111 248-248 248S8 393 8 256zm143.6 28.9l72.4-75.5V392c0 13.3 10.7 24 24 24h16c13.3 0 24-10.7 24-24V209.4l72.4 75.5c9.3 9.7 24.8 9.9 34.3.4l10.9-11c9.4-9.4 9.4-24.6 0-33.9L273 107.7c-9.4-9.4-24.6-9.4-33.9 0L106.3 240.4c-9.4 9.4-9.4 24.6 0 33.9l10.9 11c9.6 9.5 25.1 9.3 34.4-.4z"></path></svg> | ||
| − | Figure | + | Figure 22:Bar diagram that showed dose response of Leucocyclicin Q after four hours. |
</p> | </p> | ||
</div> | </div> | ||
| Line 485: | Line 596: | ||
<div class="explanation"><p> | <div class="explanation"><p> | ||
<svg class="icon" aria-hidden="true" data-prefix="fas" data-icon="arrow-circle-up" class="svg-inline--fa fa-arrow-circle-up fa-w-16" role="img" xmlns="http://www.w3.org/2000/svg" viewBox="0 0 512 512"><path fill="currentColor" d="M8 256C8 119 119 8 256 8s248 111 248 248-111 248-248 248S8 393 8 256zm143.6 28.9l72.4-75.5V392c0 13.3 10.7 24 24 24h16c13.3 0 24-10.7 24-24V209.4l72.4 75.5c9.3 9.7 24.8 9.9 34.3.4l10.9-11c9.4-9.4 9.4-24.6 0-33.9L273 107.7c-9.4-9.4-24.6-9.4-33.9 0L106.3 240.4c-9.4 9.4-9.4 24.6 0 33.9l10.9 11c9.6 9.5 25.1 9.3 34.4-.4z"></path></svg> | <svg class="icon" aria-hidden="true" data-prefix="fas" data-icon="arrow-circle-up" class="svg-inline--fa fa-arrow-circle-up fa-w-16" role="img" xmlns="http://www.w3.org/2000/svg" viewBox="0 0 512 512"><path fill="currentColor" d="M8 256C8 119 119 8 256 8s248 111 248 248-111 248-248 248S8 393 8 256zm143.6 28.9l72.4-75.5V392c0 13.3 10.7 24 24 24h16c13.3 0 24-10.7 24-24V209.4l72.4 75.5c9.3 9.7 24.8 9.9 34.3.4l10.9-11c9.4-9.4 9.4-24.6 0-33.9L273 107.7c-9.4-9.4-24.6-9.4-33.9 0L106.3 240.4c-9.4 9.4-9.4 24.6 0 33.9l10.9 11c9.6 9.5 25.1 9.3 34.4-.4z"></path></svg> | ||
| − | Figure | + | Figure 23:Bar diagram that showed dose response of Enterocin B after four hours. |
</p> | </p> | ||
</div> | </div> | ||
| Line 493: | Line 604: | ||
<div class="explanation"><p> | <div class="explanation"><p> | ||
<svg class="icon" aria-hidden="true" data-prefix="fas" data-icon="arrow-circle-up" class="svg-inline--fa fa-arrow-circle-up fa-w-16" role="img" xmlns="http://www.w3.org/2000/svg" viewBox="0 0 512 512"><path fill="currentColor" d="M8 256C8 119 119 8 256 8s248 111 248 248-111 248-248 248S8 393 8 256zm143.6 28.9l72.4-75.5V392c0 13.3 10.7 24 24 24h16c13.3 0 24-10.7 24-24V209.4l72.4 75.5c9.3 9.7 24.8 9.9 34.3.4l10.9-11c9.4-9.4 9.4-24.6 0-33.9L273 107.7c-9.4-9.4-24.6-9.4-33.9 0L106.3 240.4c-9.4 9.4-9.4 24.6 0 33.9l10.9 11c9.6 9.5 25.1 9.3 34.4-.4z"></path></svg> | <svg class="icon" aria-hidden="true" data-prefix="fas" data-icon="arrow-circle-up" class="svg-inline--fa fa-arrow-circle-up fa-w-16" role="img" xmlns="http://www.w3.org/2000/svg" viewBox="0 0 512 512"><path fill="currentColor" d="M8 256C8 119 119 8 256 8s248 111 248 248-111 248-248 248S8 393 8 256zm143.6 28.9l72.4-75.5V392c0 13.3 10.7 24 24 24h16c13.3 0 24-10.7 24-24V209.4l72.4 75.5c9.3 9.7 24.8 9.9 34.3.4l10.9-11c9.4-9.4 9.4-24.6 0-33.9L273 107.7c-9.4-9.4-24.6-9.4-33.9 0L106.3 240.4c-9.4 9.4-9.4 24.6 0 33.9l10.9 11c9.6 9.5 25.1 9.3 34.4-.4z"></path></svg> | ||
| − | Figure | + | Figure 24:Bar diagram that showed dose response of Bovicin HJ50 after four hours. |
</p> | </p> | ||
</div> | </div> | ||
| Line 501: | Line 612: | ||
<div class="explanation"><p> | <div class="explanation"><p> | ||
<svg class="icon" aria-hidden="true" data-prefix="fas" data-icon="arrow-circle-up" class="svg-inline--fa fa-arrow-circle-up fa-w-16" role="img" xmlns="http://www.w3.org/2000/svg" viewBox="0 0 512 512"><path fill="currentColor" d="M8 256C8 119 119 8 256 8s248 111 248 248-111 248-248 248S8 393 8 256zm143.6 28.9l72.4-75.5V392c0 13.3 10.7 24 24 24h16c13.3 0 24-10.7 24-24V209.4l72.4 75.5c9.3 9.7 24.8 9.9 34.3.4l10.9-11c9.4-9.4 9.4-24.6 0-33.9L273 107.7c-9.4-9.4-24.6-9.4-33.9 0L106.3 240.4c-9.4 9.4-9.4 24.6 0 33.9l10.9 11c9.6 9.5 25.1 9.3 34.4-.4z"></path></svg> | <svg class="icon" aria-hidden="true" data-prefix="fas" data-icon="arrow-circle-up" class="svg-inline--fa fa-arrow-circle-up fa-w-16" role="img" xmlns="http://www.w3.org/2000/svg" viewBox="0 0 512 512"><path fill="currentColor" d="M8 256C8 119 119 8 256 8s248 111 248 248-111 248-248 248S8 393 8 256zm143.6 28.9l72.4-75.5V392c0 13.3 10.7 24 24 24h16c13.3 0 24-10.7 24-24V209.4l72.4 75.5c9.3 9.7 24.8 9.9 34.3.4l10.9-11c9.4-9.4 9.4-24.6 0-33.9L273 107.7c-9.4-9.4-24.6-9.4-33.9 0L106.3 240.4c-9.4 9.4-9.4 24.6 0 33.9l10.9 11c9.6 9.5 25.1 9.3 34.4-.4z"></path></svg> | ||
| − | Figure | + | Figure 25:Bar diagram that showed dose response of Durancin TW-49M after four hours. |
</p> | </p> | ||
</div> | </div> | ||
| + | </div> | ||
| + | <div class="pic4"> | ||
| + | <img src="https://static.igem.org/mediawiki/2018/a/ac/T--NCTU_Formosa--FT30.png" class="bar"> | ||
| + | <div class="explanation"><p> | ||
| + | <svg class="icon" aria-hidden="true" data-prefix="fas" data-icon="arrow-circle-up" class="svg-inline--fa fa-arrow-circle-up fa-w-16" role="img" xmlns="http://www.w3.org/2000/svg" viewBox="0 0 512 512"><path fill="currentColor" d="M8 256C8 119 119 8 256 8s248 111 248 248-111 248-248 248S8 393 8 256zm143.6 28.9l72.4-75.5V392c0 13.3 10.7 24 24 24h16c13.3 0 24-10.7 24-24V209.4l72.4 75.5c9.3 9.7 24.8 9.9 34.3.4l10.9-11c9.4-9.4 9.4-24.6 0-33.9L273 107.7c-9.4-9.4-24.6-9.4-33.9 0L106.3 240.4c-9.4 9.4-9.4 24.6 0 33.9l10.9 11c9.6 9.5 25.1 9.3 34.4-.4z"></path></svg> | ||
| + | Figure 30:Bar diagram that showed dose response of Lacticin Z after four hours.. | ||
| + | </p> | ||
| + | </div> | ||
| + | </div> | ||
| + | <div class="text"> | ||
| + | <p> | ||
| + | Figure25~30 show dose response assessments of six bacteriocins. Durancin TW-49M and Enterocin B represent a greater dose response data. After that, we analyze the target band of SDS-PAGE gel and estimate concentration of bacteriocins. | ||
| + | </p> | ||
| + | </div> | ||
| + | <div class="text"><p>Enterocin 96_1.0X:21.12mg/L, Durancin TW-49M_1.0X is 24.32mg/L, Enterocin B_1.0X is 21.12mg/L, Bovicin HJ50_1.0X is 18.71mg/L and Lacticin Z_1.0X is 260.29mg/L.</p></div> | ||
| + | <img src="https://static.igem.org/mediawiki/2018/4/4f/T--NCTU_Formosa--FT31.png" alt="" class="p_value"> | ||
| + | <div class="explanation"><p> | ||
| + | <svg class="icon" aria-hidden="true" data-prefix="fas" data-icon="arrow-circle-up" class="svg-inline--fa fa-arrow-circle-up fa-w-16" role="img" xmlns="http://www.w3.org/2000/svg" viewBox="0 0 512 512"><path fill="currentColor" d="M8 256C8 119 119 8 256 8s248 111 248 248-111 248-248 248S8 393 8 256zm143.6 28.9l72.4-75.5V392c0 13.3 10.7 24 24 24h16c13.3 0 24-10.7 24-24V209.4l72.4 75.5c9.3 9.7 24.8 9.9 34.3.4l10.9-11c9.4-9.4 9.4-24.6 0-33.9L273 107.7c-9.4-9.4-24.6-9.4-33.9 0L106.3 240.4c-9.4 9.4-9.4 24.6 0 33.9l10.9 11c9.6 9.5 25.1 9.3 34.4-.4z"></path></svg> | ||
| + | Figure 31:The relative percentage of O.D.<sub>600nm<sub> value of bacteriocins. | ||
| + | </p> | ||
| + | </div> | ||
| + | <div class="text"> | ||
| + | <p> | ||
| + | P values are used to determine whether two sets of data are significantly different with each other or not. Therefore, the smaller p-value is, which means bacteriocin exactly more effective to inhibit the growth of <i>Bacillus subtilis</i> than negative control does. The star indicates p< 0.05 and two stars indicate that p< 0.01. | ||
| + | </p> | ||
| + | </div> | ||
| + | <div class="text"> | ||
| + | <p> | ||
| + | Figure 31 shows the p-value and the star of each sample. P-value of Durancin TW-49M is the smallest in the figure, which indicates it is the most reliable. | ||
| + | </p> | ||
</div> | </div> | ||
| Line 512: | Line 653: | ||
</p> | </p> | ||
</div> | </div> | ||
| − | |||
| − | |||
| − | |||
| − | |||
| − | |||
| − | |||
| − | |||
| − | |||
| − | |||
| − | |||
| − | |||
| − | |||
| − | |||
| − | |||
<!-----------------------------------------------------------------------------> | <!-----------------------------------------------------------------------------> | ||
Revision as of 01:41, 18 October 2018


Inhibition Zone
To test the inhibition ability of bacteriocins in solid medium, we use Inhibition Zone to measure the effective inhibition of bacteriocins. We use the condensed culture spread to the agar plate and add bacteriocins and let it to dry. In that case, the dose of inhibition zone is as same as microdilution which can be in contrast with liquid condition.
Inhibition Ability Analysis
The purpose of this experiment is to verify that Bacteriocins have function. Firstly, we cultivated Bacillus subtilis as Bacteriocins’ inhibiting target. Centrifuge products which have been sonicated and used supernatants as samples. The positive control in this experiment is Ampicillin and the negative control is Bacillus subtilis without adding Bacteriocins. We use Elisa Reader to record O.D.600nm values of samples once an hour, if OD values decrease, it means that our bacteriocin inhibit the growth of Bacillus subtilis. Further, we can also know when does bacteriocin degrade by observing the growth curve of Bacillus subtilis. The pre-test data are all triplicated and normalized.
Inhibition Analysis of purified bacteriocins

Figure 1:Normalized growth curve of purified Leucocyciclin Q.

Figure 2:Normalized growth curve of purified Enterocin B.
Dose Response Assessment of purified bacteriocin (Inhibition Zone)

Figure 3:Inhibition zone test of Enterocin B for four dosages.
A: Enterocin B 1.0
B: Enterocin B 0.5
C: Enterocin B 0.25
D: Enterocin B 0.125
E: Negative Control

Figure 4:Inhibition zone test of Leucocyclicin Q for four dosages.
A: Leucocyclicin Q 1.0
B: Leucocyclicin Q 0.5
C: Leucocyclicin Q 0.25
D: Leucocyclicin Q 0.125
E: Negative Control

Figure 5:Inhibition zone test of Enterocin 96 for four dosages.
Concentration of Enterocin B 1.0 is 263mg/L, Leucocyclicin Q 1.0 is 217mg/L and Enterocin 96 1.0 is 74mg/L.
Figure3~5 show that Enterocin B, Leucocyclicin Q and Enterocin 96 have significantly inhibition rangecomparing to negative control, column buffer, which is the buffer that protein solubilize in after purification.
Inhibition Analysis of unpurified bacteriocins
After purifying bacteriocins, we do the inhibition analysis of unpurified bacteriocins, which only been sonicated after expression, and we find out that bacteriocins also have strong inhibition ability to Bacillus subtilis. Therefore, we do a series of experiments using unpurified bacteriocins, and the following data shows that each bacteriocin can have effective function without purifying, keeping costs of using bacteriocins as a biostimulator low.

Figure 1:Bar diagram that showed percentage resistance of six bacteriocins to Bacillus subtilis after four hours.
Lacticin Z(96.64%), Bovicin HJ50(82.05%), Enterocin 96(46.47%), Enterocin B(46.06%), Leucocyclicin Q(40.58%),Durancin TW-49M(19.52%).

Figure 2:Normalized growth curve of bacteriocins and Negative Control.
- Figure 1 shows six bacteriocins’ inhibiting ability to B. sub, and Durancin TW-49M has the most effective function, inhibiting 80% of B. sub’s growth.
- Figure 2 shows how O.D.600nm value of each sample decreases, indicating the strongest bacteriocin is Durancin TW-49M. It has strong inhibiting ability and its standard difference is also small, which means Durancin TW-49M has is both effective and stable.
- The following data showed that each bacteriocin can have effective function without purifying, keeping costs of using bacteriocins as a biostimulator low.
Durancin TW-49M

Figure 3:Bar diagram that showed percentage resistance of Durancin TW-49M to Bacillus subtilis after acting for four hours. Durancin TW-49M (18.94%)

Figure 4:Inhibition Zone Test of Durancin TW-49M. A: Durancin TW-49M; B: Negative Control

Figure 5:Normalized growth curve of Bacillus subtilis that showed Durancin TW-49M inhibiting ability throughout four hours.
Enterocin B

Figure 6:Bar diagram that showed percentage resistance of Enterocin B to Bacillus subtilis after acting for four hours.
Enterocin B(44.24%)

Figure 7:Inhibition Zone Test of Enterocin B
A: Enterocin B; B: Negative Control

Figure 8:Normalized growth curve of Bacillus subtilis that showed Enterocin B inhibiting ability throughout four hours.
Lacticin Z

Figure 14:Bar diagram that showed percentage resistance of Lacticin Z to Bacillus subtilis after acting for four hours.
Lacticin Z (96.32%)

Figure 15:Inhibition Zone Test of Lacticin Z.
A: Lacticin Z

Figure 16:Normalized growth curve of Bacillus subtilis that showed Lacticin Z inhibiting ability throughout four hours.
Enterocin 96

Figure 12:Bar diagram that showed percentage resistance of Enterocin 96 to Bacillus subtilis after acting for four hours.
Enterocin 96 (45.16%)

Figure 18:Inhibition Zone Test of Enterocin 96
A: Enterocin 96; B: Negative Control

Figure 14:Normalized growth curve of Bacillus subtilis that showed Enterocin 96 inhibiting ability throughout four hours.
Bovicin HJ50

Figure 15:Bar diagram that showed percentage resistance of Bovicin HJ50 to Bacillus subtilis after four hours.
Bovicin HJ50 (82.05%)

Figure 21:Inhibition Zone Test of Bovicin HJ50.
A: Bovicin HJ50; B: Negative Control

Figure 22:Normalized growth curve of Bacillus subtilis that showed Bovicin HJ50 inhibiting ability throughout four hours.
Leucocyclicin Q

Figure 18:Bar diagram that showed percentage resistance of Leucocyclicin Q to Bacillus subtilis after four hours.
Leucocyclicin Q (40.58%)
Figure 19:Inhibition Zone Test of Enterocin 96.
A: Enterocin 96

Figure 20:Normalized growth curve of Bacillus subtilis that showed Leucocyclicin Q inhibiting ability throughout four hours.
Dose Response Assessment
Secondly, we diluted samples into three different concentration, which is 0.5, 0.25 and 0.125 times of primitive samples. Dose Response Assessment showed that the inhibition wasn’t caused by endotoxin. The positive control in this experiment is Ampicillin and the negative control is Bacillus subtilis without adding Bacteriocins. The Dose Response Assessment data are all triplicated and normalized.

Figure 21:Bar diagram that showed dose response of Enterocin 96 after four hours.

Figure 22:Bar diagram that showed dose response of Leucocyclicin Q after four hours.

Figure 23:Bar diagram that showed dose response of Enterocin B after four hours.

Figure 24:Bar diagram that showed dose response of Bovicin HJ50 after four hours.

Figure 25:Bar diagram that showed dose response of Durancin TW-49M after four hours.
Figure 30:Bar diagram that showed dose response of Lacticin Z after four hours..
Figure25~30 show dose response assessments of six bacteriocins. Durancin TW-49M and Enterocin B represent a greater dose response data. After that, we analyze the target band of SDS-PAGE gel and estimate concentration of bacteriocins.
Enterocin 96_1.0X:21.12mg/L, Durancin TW-49M_1.0X is 24.32mg/L, Enterocin B_1.0X is 21.12mg/L, Bovicin HJ50_1.0X is 18.71mg/L and Lacticin Z_1.0X is 260.29mg/L.
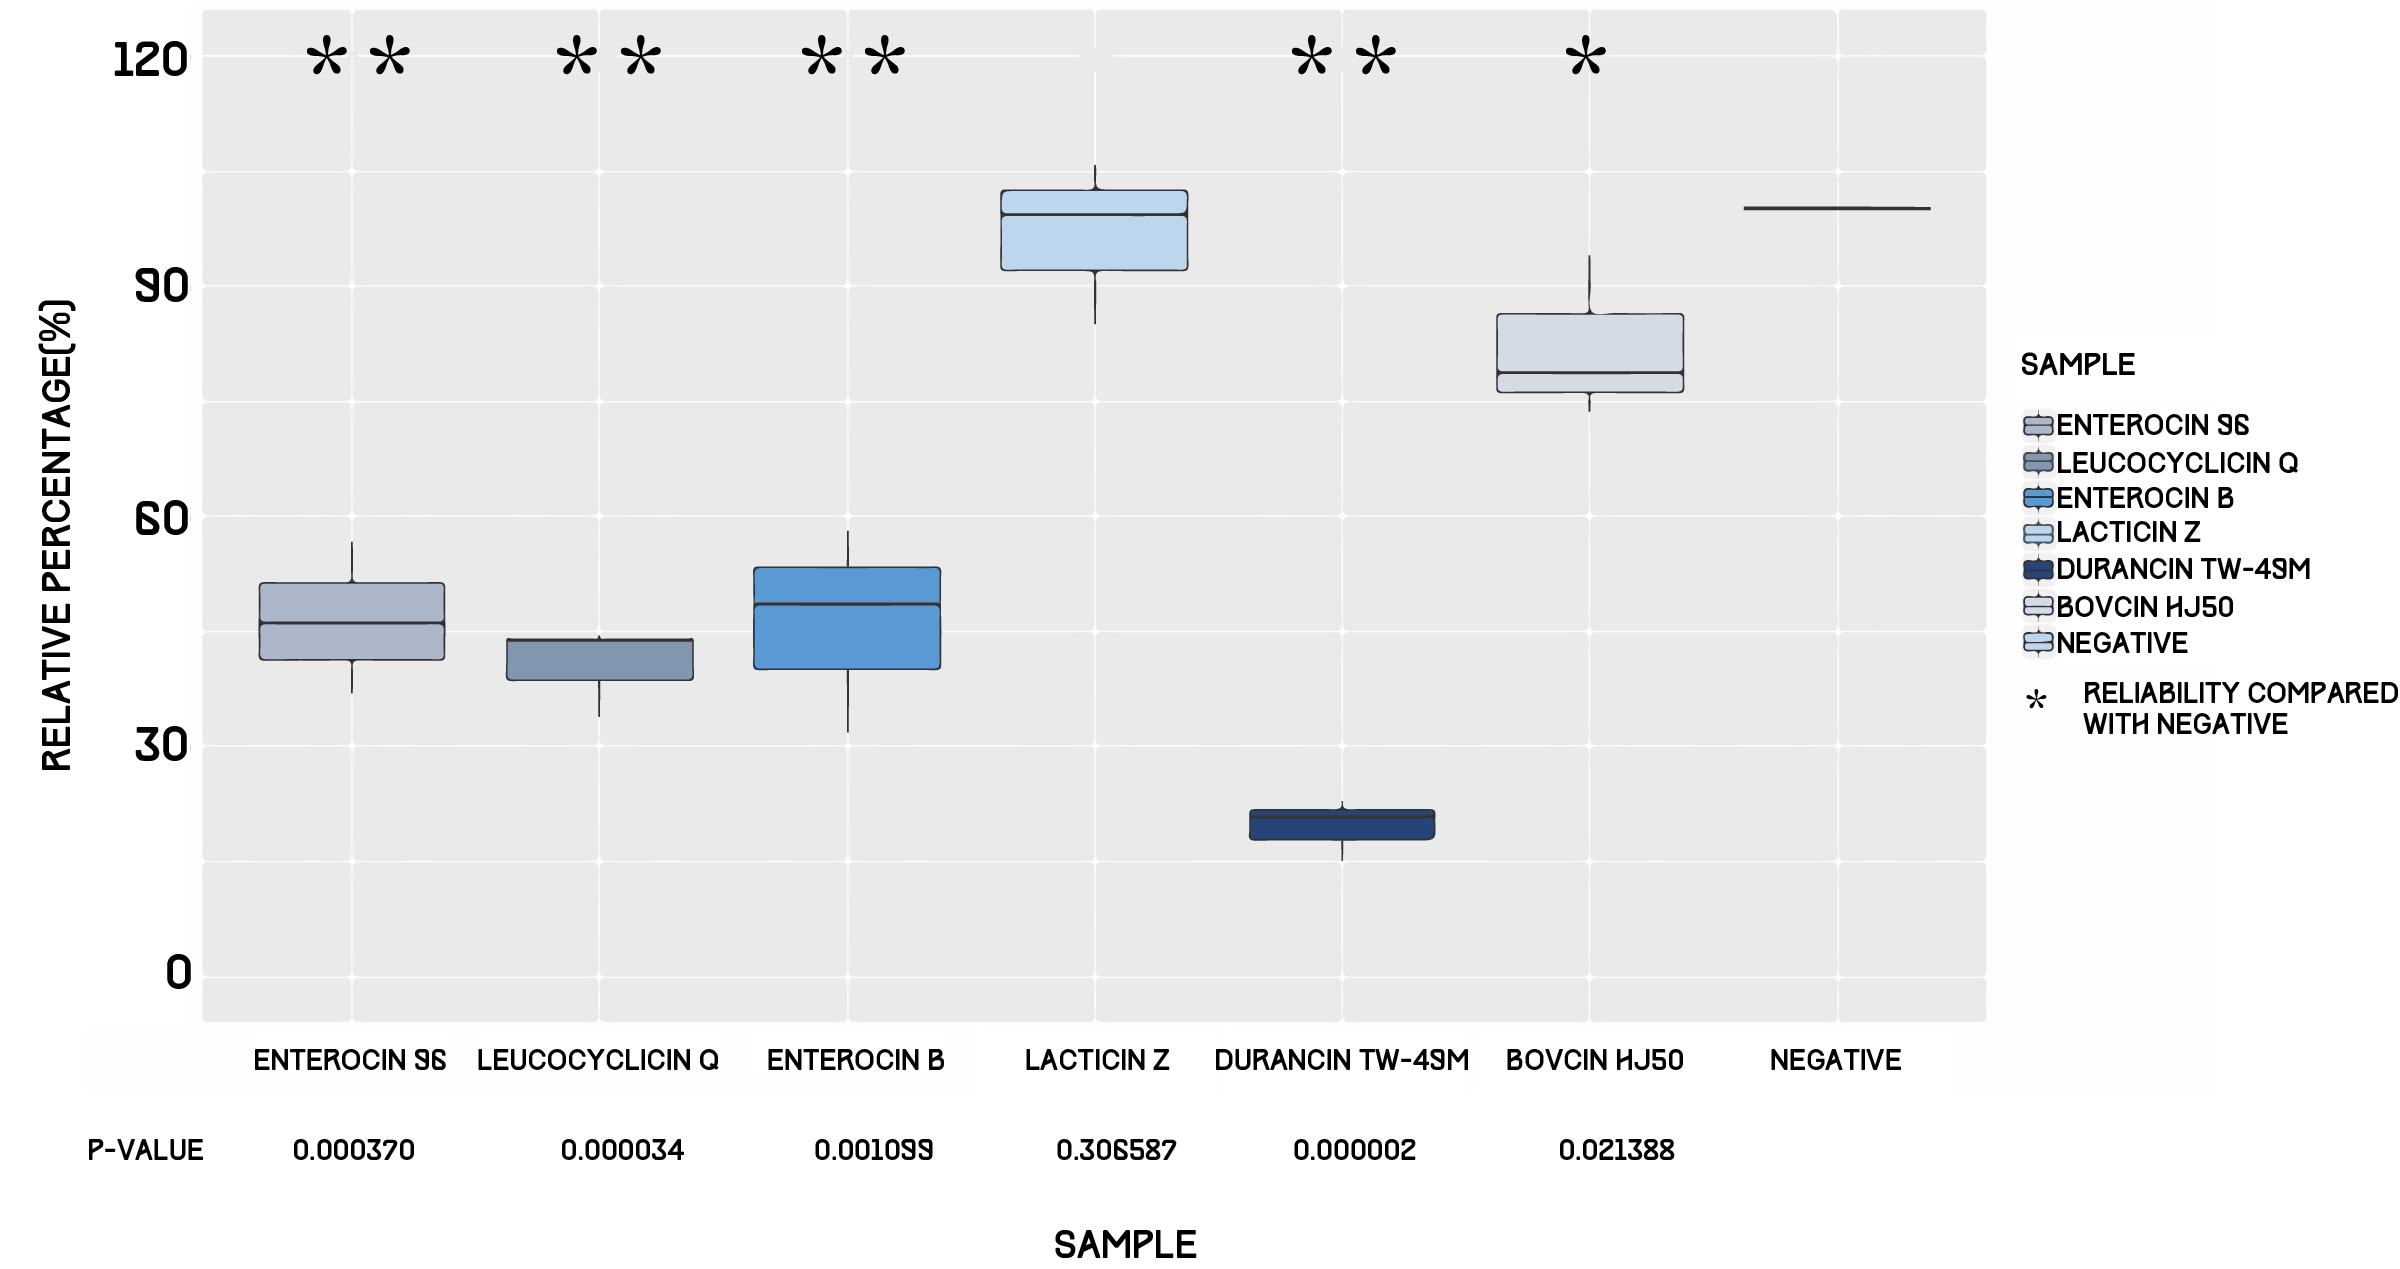
Figure 31:The relative percentage of O.D.600nm value of bacteriocins.
P values are used to determine whether two sets of data are significantly different with each other or not. Therefore, the smaller p-value is, which means bacteriocin exactly more effective to inhibit the growth of Bacillus subtilis than negative control does. The star indicates p< 0.05 and two stars indicate that p< 0.01.
Figure 31 shows the p-value and the star of each sample. P-value of Durancin TW-49M is the smallest in the figure, which indicates it is the most reliable.
Conclusion
From our experiments we conclude that our 6 bacteriocins are functional. We began by performing both functional test in 96-well plate and inhibition zones. Our results indicate successful inhibition of Bacillus subtilis. Then, we moved on to dose response assessment. Of our 6 peptides, four show convincing results, following the trend of greater inhibition with higher dosage.