Team:SCAU-China/Model/PPIBoost
PPI network prediction
Even though we have used microarray data to re-construct gene regulatory network, and transcriptomics studies provide crucial information in transcript level, it must be recognized that various levels of post-transcriptional control might rival its importance and are not captured by these analyses[1].In order to capture the information inherent in the post transcript level, We want to integrate more data type to identify and model the protein-protein interaction network in the PCC6803.
Decades of research into cell biology, molecular biology and so on that have produced a remarkable compendium of knowledge and database on the function and molecular properties of individual protein(like Uniprot[2]). However, protein rarely acts alone, and organizes as protein-protein interaction network which has intricate physicochemical dynamic connections to undertake biological functions at both cellular and systems levels[3]. Although efforts have been devoted to the development of methodology for predicting PPIs, the application of existing methods in PCC6803 is limited. Here, we proposed a novel protein-protein interaction prediction method based on the research of Shen et al. 2007 published on PNAS. This method integrates the functional annotation data, transcriptome(microarray), and protein sequences information, to predict PPI of PCC6803 in high performance.
Mathematics model
The protein sequence determines the first level structure even higher level structure of protein. Which may reveal that knowledge of the amino acid sequence alone might be sufficient to estimate the possibility of interaction between two proteins. It may be much universal that using sequence data to predict PPI. Motivated by it, we developed a high confidence protein-protein interaction training and test sample from published databases, and used a state-of-the-art machine learning algorithm to learn the relationship between sequence information to the interactions.
The first challenge of PPI prediction is how to prepare a dataset which is really vital to the reliability of the prediction model. For positive data, we selected high-confidence ppi data from string database. This database contains 832431 nonredundant entries with interaction combined scores derived from specific computational methods. We selected PPI pairs with experimental verified scores( >100) so that the quality and size of positive sample are high and large enough for the construction of PPI prediction models.
The main challenge of dataset preparation is how to generate a high confidence negative sample because we have limited information about proteins that are really noninteractive. Unlike the random way and recombine way for selecting a negative dataset, we used gene coexpression information and text mining skills to generate negative sample.
At first, we randomly selected 1047 protein coding genes with Go functional annotation terms from Go database[5]. We want to use the gene functional annotation information to measure the distance of two genes in the biological system. We prepare a gene function dictionary to fully describe the important information when describe the gene functions. The Go annotation information for each gene can be projected into a binary vector space(each vector is composed by 0 or 1). The process of text mining is shown in figure1.

Figure1.The text mining similarity score analysis
Then, we can calculate Jaccard similarity for each protein coding gene pair.

The jaccard similarity measures how far a pair of genes(proteins) in cellular pathway are. If two genes are not on the same pathway, it merely has possibility that these two proteins have interaction. We defined jaccard similarity coefficient as text mining distance. Another evidence is from gene co-expression result, we calculated the Pearson correlation matrix and specific pvalue matrix of ~3000 genes in PCC6803. After FDR control, we selected gene pairs with non-significant Pearson correlation and zero Jaccard similarity(text mining distance equal to 1). These genes(proteins) have no interactive evidence no matter transcript level or annotation level. Which may prove that our rational strategy can select a high confidence negative dataset.
 <
<
Figure2. the distribution of text mining distance and coexpression coefficient
The training and test set consisted of 96004 positive protein pairs and 8606 negative protein pairs.
Using Xgboost to predict PPI based on protein sequence
Generating features from sequence data
For predicting PPI by sequence, another one of the main computational challenges is to find a suitable way to encode the feature based on sequence. We used the method proposed by Shen et al[4], the first step is using density-functional theory method and molecular modeling approach to classify 20 amino acids into 7 seven classes. Amino acids within the same class have similar characteristics. Then we regarded any three continuous amino acids as an unit. The unit can be differential according to the classes of amino acids. Each protein sequence can be projected into a vector space by counting the frequencies of each unit type, so that we can generate a 343-dimensional vector for each protein sequence. To prevent the length of protein sequence may influence the frequencies of each unit type. We used MIN-MAX normalization method to normalize the vector(V).

Next, concatenate the vector spaces of two protein(DA and DB ) to represent their interaction feature (DAB) , thus a 686-dimensional vector has been built to represent each protein pair.
The XGBoost training step
Our method for PPI prediction was developed based on XGBoost, the details of XGBoost can be found in ref[6]. Basically, XGBoost implements machine learning algorithms under the Gradient Boosting framework. XGBoost provides a parallel tree boosting (also known as GBDT, GBM) that solves many data science problems in a fast and accurate way[12]. The reason why we used XGBoost is that it perform really wonderful in so many scenarios and computational cost is really low compare with other machine learning algorithm because of parallel character. In our PPI prediction model, we used 'xgboost' version 0.71.2 , an open source R package focused on XGBoost modeling, to train our prediction system on our dataset.
To prove that our model is out performing than the traditional method, we compared with our method with S kernel support vector machine algorithm. To minimize data dependence on the prediction model, we randomly sampled 5 dataset with 1000 sample size, and used 10 fold validation test to estimate our test error(training set sample size:test set sample size=9:1). The prediction results are listed in Table1.

Table1 the performce of SVM with S kernel function and XGBoost algorithm comparison. One thing needs to be noted that XGBoost is output as probability. We let it prediction ‘interaction’(1) if pro>0.05 else predict non-interaction(0). We can see that the AUC of XGBoost is much more higher than SVM.

Figure3. The ROC curve of one task in XGBoost and SVM performance comparison
We used AUC(areas under curve)and accuracy to measure the performance of each method. The AUC is defined as the area under the receiver operating characteristic curve, which can be used to measure the performance of classification algorithm.The larger the AUC, the better the classifier.
The results indicate that the prediction model constructed with XGBoost is more accurate than the models constructed with the support vector machine even its kernel function is designed for protein sequence specifically.
Generate the XGBoost Bagging ensemble model to make prediction more generality
One thing we note is that the sampling distribution will influence the prediction performance. For instance, we sampling the positive dataset limited in protein interaction pairs with experimental score large than 900, after merging with negative dataset, we re-training our model on the new dataset. Then, we compared the predict probability of PPI with experimental score record on the 'string'.

Figure4. the comparision between experimental score and PPI score, PPI score is XGBoost probability outcome.
We found that protein pairs with low experimental score(< 300) will tend to have high predict probability. But the protein pairs with high experimental score can fit with our prediction. Which means that our model may have data dependence performance problem, and will influence our prediction on new dataset.
To address this problem, we used ensemble skills called bagging[8], we sampling the negative samples and positive samples with sample size 500 for training our sub-model, and we integrated the predict result of each sub-model on test dataset as ensemble XGBoost model prediction result.

We validate our new ensemble model on test dataset(with sample size around 1000,training sample size: test sample size=1:1), and compared with each sub-model. The prediction results are listed in Table2.
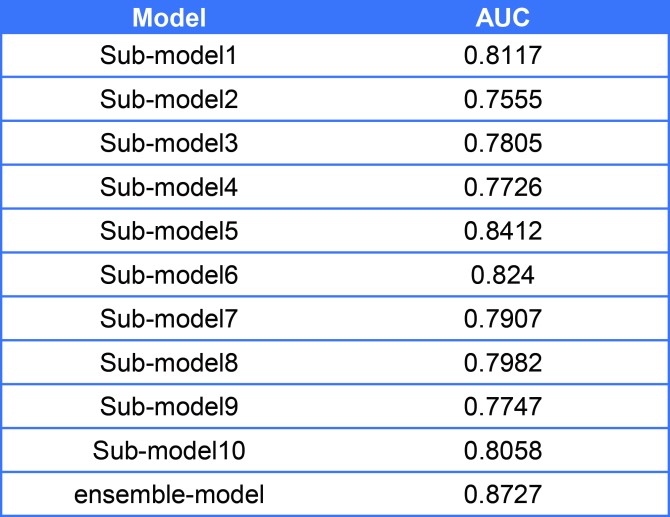
Table2. The performance comparison between submodels and ensemble-model

Figure5. The ROC curve comparison of ensemble model and sub-model
As shown in result, the ensemble model has higher sensitivity and specificity compare with each sub-model, so that we used our ensemble model to predict the PPI network.
Reference
[1] Mata, J., Marguerat, S. & Bahler, J. Posttranscriptional control of gene expression: a genomewide perspective. Trends Biochem. Sci. 30, 506–514(2005).
[2] Apweiler R, Martin MJ, O’Donovan C, Magrane M, Alam-Faruque Y, et al. (2010) The Universal Protein Resource (UniProt) in 2010. Nucleic Acids Res 38: D142–D148
[3] Rivas J D L, Fontanillo C. Protein–Protein Interactions Essentials: Key Concepts to Building and Analyzing Interactome Networks[J]. Plos Computational Biology, 2010, 6(6):e1000807.
[4] Shen J, Zhang J, Luo X, et al. Predicting Protein-Protein Interactions Based Only on Sequences Information[J]. Proceedings of the National Academy of Sciences of the United States of America, 2007, 104(11):4337-4341.
[5] http://www.geneontology.org/
[6] Chen T, Tong H, Benesty M, et al. xgboost: Extreme Gradient Boosting[J]. 2016.
[7] Quinlan J R. Bagging, boosting, and C4.S[C]// Thirteenth National Conference on Artificial Intelligence and Eighth Innovative Applications of Artificial Intelligence Conference, AAAI 96, Iaai 96, Portland, Oregon, August 4-8. DBLP, 1996:725-730.
The R script for PPIBoost and SVM with kernel function[4] is available from our Github page
School's name:SCAU
Member's name:SCAU
Designed by:SCAU