Team:SCAU-China/Model/HAWNA
Abstract:
In order to increase the production of bacterial cellulose in cyanobacteria , we want to base on known regulatory and metabolic information and new knowledge generated by gene expression profile. We developed a statistical model based on partial correlation and hierarchical clustering called HAWNA(Hierarchical And Weighted Network Analysis), to infer genetic regulatory network and gene co-expression module. We performed simulation test and combine known information of genetic regulatory pathway of PCC6803 to show that our model perform better than existing model and can enrich functional pathway significantly. We then performed our model on public microarray dataset of PCC6803 to predict new genes may influence the production of bacterial cellulose and used crisper-cas9 to knockout these genes to further prove our model.
HAWNA is consisted of two analysis step
1. Causal network analysis step: We used singular value decomposition and partial correlation analysis to find alternative genes which not annoted on our target pathway have a direct correlation with our annoted pathway genes. The direct correlation(partial correlation) means the correlation of two variables while not controlling for a third or more other variables.
2. Gene coexpression module detection analysis: We used correlation matrix and hierarchical clustering algorithms to find network community and quantify the effect of genes to the whole system.
Overview:
In our result, we have demonstrated that we have developed a PCC6803 strain capable of expressing bacterial cellulose. However, we find that our strain cannot produce sufficient bacterial cellulose. To improve the production, the metabolic engineering is necessary.
Advances in metabolic engineering have enabled the modification of biosynthetic pathways in microorganisms, one major step in metabolic engineering is to overexpression or knockdown a heterologous enzyme to boost the yield of intermediates(s) or the desired product directly. However, the genetic modification will bring two major problems in metabolic engineering:
1. The modification may result in accumulation of intermedias with no change or even decrease of desired product. Because of complexity and heterogeneity of the genetic regulatory network.
2. The modification may result in potential metabolic burdens which may influence the growth of cyanobacteria.

Figure1. the bacterial cellulose biosynthetic pathways
This present a issue that which genes need to be knock out, in cellulose biosynthetic pathway(Fig 1), we can found that gene slr0897(Cyanobase access- ion number)encode endo-1,4-beta-glucanase like protein(SsGlc), and present function of cellulose degradation and salt stress tolerance. For the problem2, it may not suit to knock out slr0897 directly. In order to address above two problems, we decided to develop a mathematical model of gene regulatory network, to detect new genes may have functional involvement in cellulose production and measure each gene's impact to the whole biological regulatory network.
Genetic regulatory networks(GRNs) are collections of gene-gene regulatory relations in a genome and are models that display causal relationships between gene activities. Inference of GRNs based on gene expression profile is referred to as 'reverse engineering'[1], as the gene hidden variableexpression profile is the outcome of GRNs. Mathematically, Reverse Engineering is a traditional inverse problem. But GRN is really complicated by the enormously large scale of the unknowns, the inherent noise like experimental defects and many other hidden-variable my play a role in the variation of experimental data.
In mathematical perspective, we have a variety of methods to inference and simulate GRNs. Most iGEM teams tend to use flux balance analysis and ordinary differential equation(ODE). But this way may lead to two shortcomings, the first one is modelers often need enough background knowledge of your organism, and most ODEs model have a strong assumption about network structure. Second, ODEs perform not so good in a noisy gene expression profile, and may lead to overfitting problem even fit perfectly with your observed data.Compare with ODEs, using probability graphic model seems is a better choice in large scale GRN inference. Statistical learning techniques have a solid basis in statistics, allowing them to deal with the stochastic aspects of gene expressions and noisy measurements in a natural way, and give us more directly and an easier way to draw the graph of whole GRN[2].
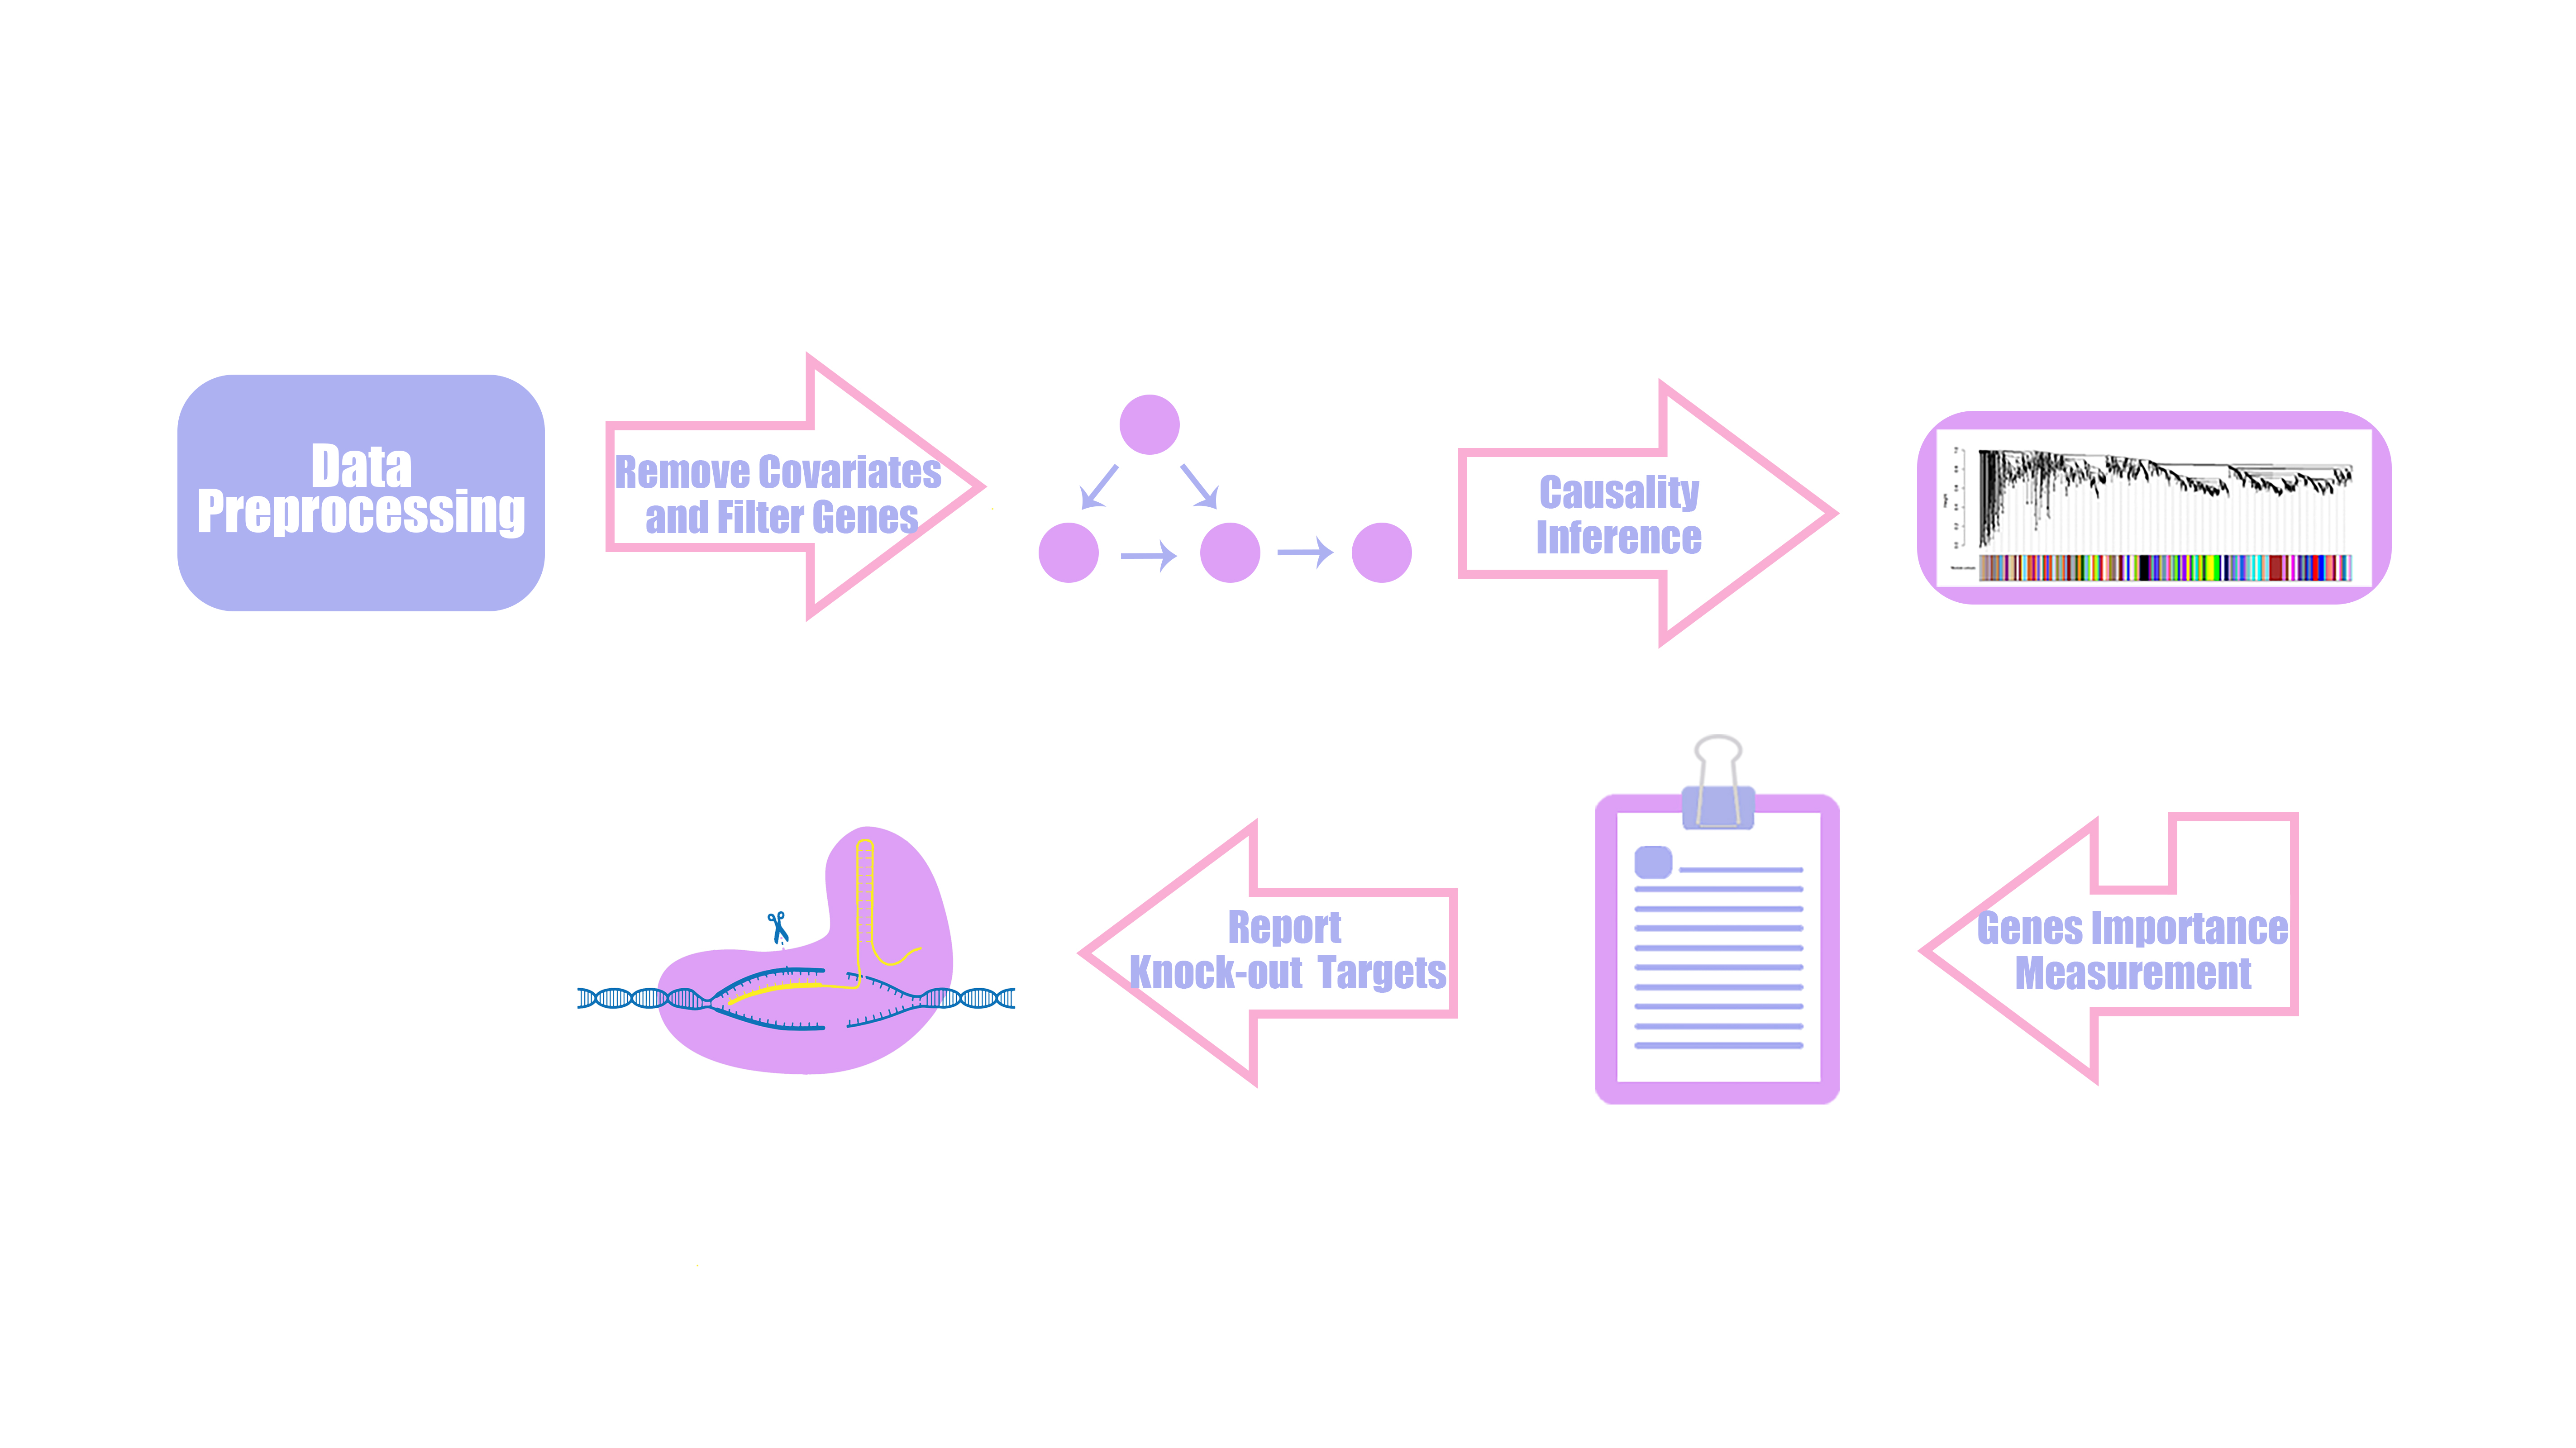
Figure2. the structure of HAWNA
Collecting and processing data
The HAWNA is based on the gene expression profile, so we download the microarray data of PCC6803[3]:the gene expression in Synechocystis sp. PCC 6803 was analyzed following culture at different light conditions(30, 50, 300, 1000, 1100, and 1300 μmol m-2 s-1. Three independent experiments were performed under each light intensity). To remove the bias of light intensity, we use linear regression model to calculate the residual variation of each gene after regressing out the light effect.
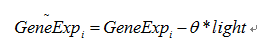
The θ is learned through OLS(ordinary least square) methods, after regressing process. We rescale the data, and use Kolmogorov-Smirnov test to test each gene’s gaussianity. This step we filtered 182 genes to prevent their effects from network construction..
Partial network construction
Difference Between Causality And Correlation?
Correlation networks are widely used to explore and visualize high-dimensional data. Constructing correlation network is really simple and including two steps: 1) the computation of all pairwise correlations for the investigated variables. And 2) a thresholding or filtering procedure to conduct significant correlation. But correlation will reach limit that it not represents 'causality', as shown in Figure3.
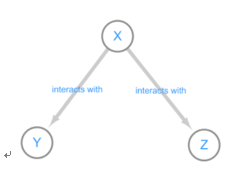
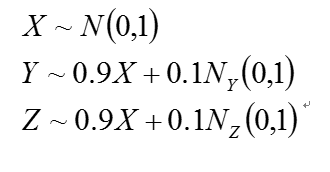
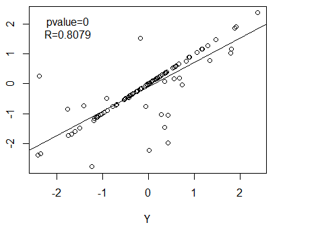
Figure 3: Interact diagram of two genes(Y,Z) co-regulated(X) model. We simulated three variable:X, Y, Z .The distribution of X, Y, Z is independent, as we can see, the variable Z and Y present a very strong correlation, But Y and Z is regulated by variable X, which means they are not causal correlation. If we knock out gene Y, it seems will not down-regulated the expression value of Z.
So considering the conditional correlation is really important, it can help us to remove the influence of intermedia variable, and filter some meaningless correlation.
Partial correlation model
The partial correlation[4] is the correlation that remains between the two variables if the effects of the other variables have been regressed out. As proved in Gaussian graphical model theory, that the partial correlation(also called conditional correlation) of Xa and Xb given {Xc:c≠a,b} is given by
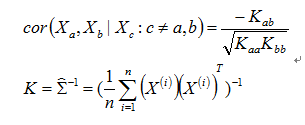
K matrix means the inverse matrix of covariance matrix. For n>p-2, we have
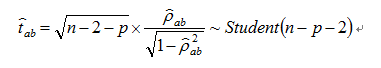
For each a and b, we can caculate the p-value of  with the test statistic
However, for most gene expression matrix, the sample size(n) is much more smaller than the number of variables(p > >n).Which will bring two problems:
1.The empirical covariance matrix is singular, and the estimate of corresponding inverse matrix(K) will be unstable.
2.The degree of freedom of test statistic will be negative.
Considering above problems, we proposed a novel computational framework, based on matrix decomposition and random matrix theory, and we can reduce dimension efficiently, and make an accurate inference of causal network.
Information compression
To solve the problems of "curse of dimensionality"[5] in partial correlation analysis step, we use SVD to help us compress the information as reduce dimensions.It is known that most of information of matrix can be compressed through a wide of different algorithms like PCA, ICA and so on.
The Singular Value Decomposition(SVD) is a matrix decomposition that is very useful in many fields of applied mathematics.For any matrix A, the matrices ATA and AAT are symmetric positive semidefinite.
Any n*p matrix A of rank r can be decomposed as
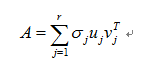
where
- r=rank(A)
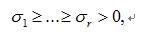
 are the nonzero eigenvalues of ATA(which are also the nonzero eigenvalues of AAT), and
 and
and
 are two orthonormal families of Rn and Rp, such that
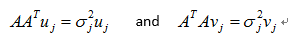
U vectors are said to be left-singular vectors, represent the characteristic vector of AAT, the range of it and the range of A coincide. So we can use left-singular vector to surrogate the variation of Xc. Which means we can use a part of left-singular vectors to represent the rest genes expression variation information. The number of dimensions is chosen through random matrix theory(RMT).
Random matrix theory(RMT)
To estimate the number of components K to be used in partial correlation analysis, we use RMT to estimate the number of dimensions of a data covariance matrix by comparing the statistics of the observed eigenvalues of the co-variance matrix. We consider a “random” correlation matrix
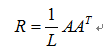
where A is an N✖L matrix containing N variables and L random elements with zero mean and unit variance. Statistical properties of random matrices such as R are known. In the limit N → ∞, L → ∞ ,such that Q=L/N is fixed, it was shown analytically that the distribution Prm(λ) of eigenvalues λ of the random correlation matrix R is given by[9]
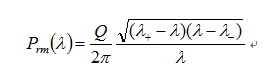
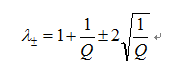
where lambda+ and lambda- are the maximum and minimum eigenvalues of R respectively, given by
So we can determine the number of components by test the number of eigenvalue with bigger than theoritical maximum eigenvalues of random correlation/co-variance matrix.
Candidate targets detection
Based above theory, in causal network inference step(as shown in Figure4), We first separate genes into two sets:the target pathway gene set and the non-target pathway gene set. For each gene on the target pathway, we calculated its' partial correlation with all genes in non-target pathway gene set. And than, we defined the genes in non-target pathway gene set only present one interaction with the gene in target pathway gene set as candidate target.
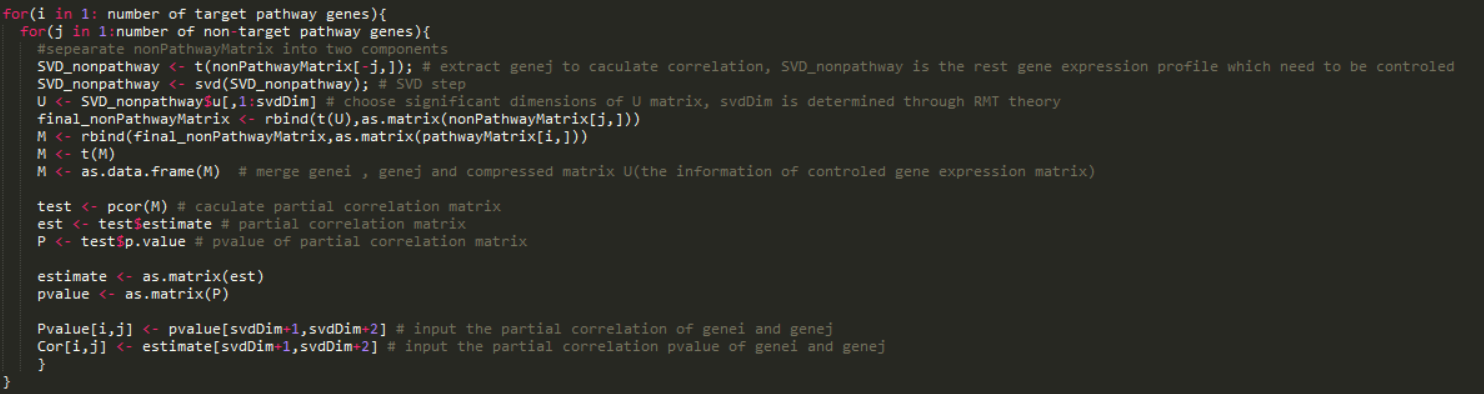
In our analysis, We want to search the non-target pathway genes which only present positive interaction with slr0897.The pseudo code of causal network inference step is detailed below:
Pvalue = pvalue of partial correlation matrix, number of row equal to the number of target pathway genes, number of column equal to the number of non-target pathway genes
Cor = partial correlation matrix, number of row equal to the number of target pathway genes, number of column equal to the number of non-target pathway genes
FDR control of Pvalue matrix
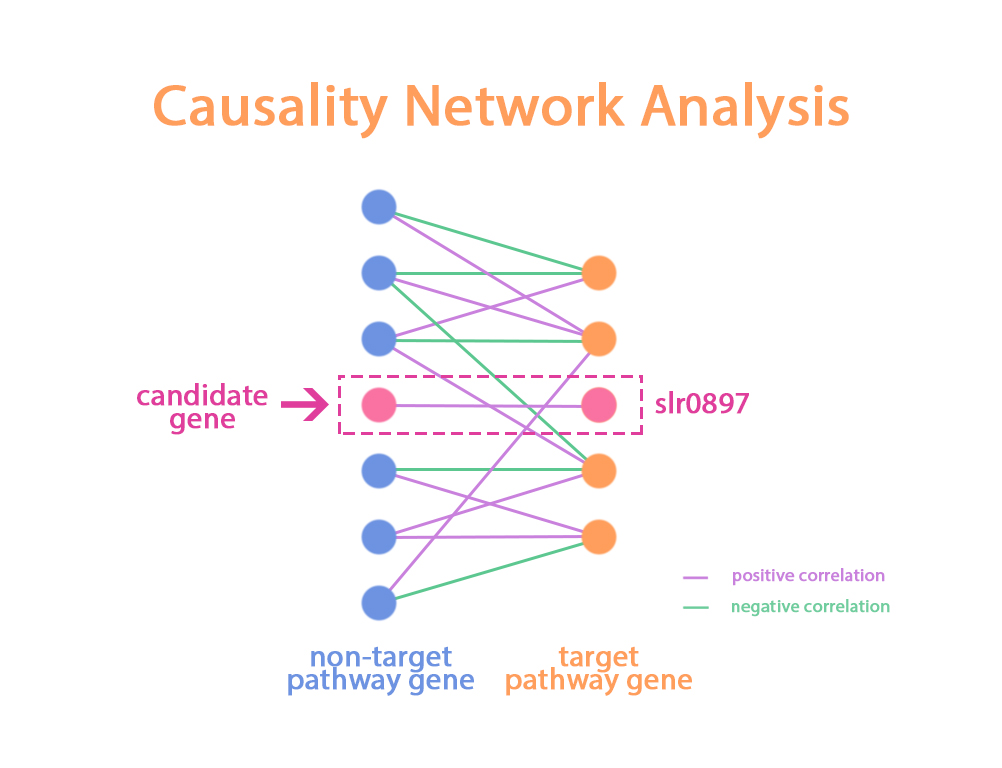
Figure 4 the illustration of Causal network analysis
According to our result, We found that around 59 genes that positive correlate(partial correlation with slr0897)with slr0897. Besides, there are 51 genes only correlated with slr0897 across genes in target pathway.
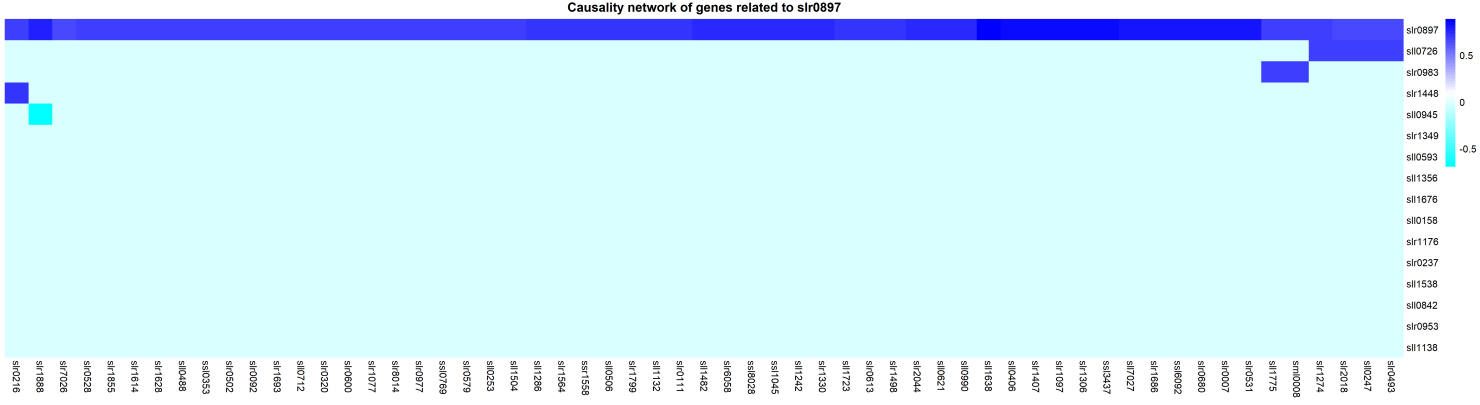
Figure 5 the heatmap of non-target pathway genes which positive correlated with slr0897
Another question we need to address is to determine which gene is suitable to be knock out within these 51 genes. The nature of scale free network property of genetic regulatory network decides that genes have different impact to the whole GRN[10]. Motivated by this idea, the next step of HAWNA is to define the “importance score” for each target gene.
To test our method performance, we performed a simulation test and compared our method with other network computational tools(GeneNet[7]), the results shown that our method has higher true positive rate compare with GeneNet and Pearson correlation analysis. See text1. Simulation Report for more details.
Gene co-expression module clustering(WGCNA)
Partial correlation measure the direct interaction for each pair of genes. But in real genetic network, the secondary regulation phenomenon is really common. Although partial correlation matrix can measure “the direct distance” for each pair of genes, It will miss a lot of information when we need to describe the impact of one gene to the whole network.
Because of it, we decided to use clustering method to cluster gene expression profile and get gene co-expression module. We used a state-of-the-art weighted gene co-expression network analysis R package called “WGCNA”[8] to analysis our microarray data and clustered the genes according their similarity. For details about clustering step, see text2 WGCNA report for more details.
Each module represents one or some biological pathways, to prove that our learning algorithm can enrich the biological pathway, We use hypergeometric distribution test to build a pathway enrichment test model.
Hypergeometric distribution is a discrete probability distribution that the probability of k successes in n draws without replacement, from a finite population of size N that contains exactly K objects with that feature. In our scenario, the number of genes in pathway(A) which enriched in gene co-expression module(B) is following hypergeometric distribution.
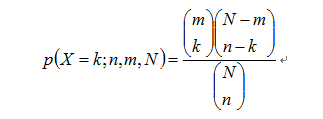
k: The number of genes belong to both gene co-expression module(B) and KEGG pathway(A)
n: The number of genes in gene co-expression module(B)
m: The number of genes in KEGG pathway(A)
N: The number of totally genes(3301 in our scenario)
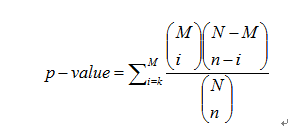
In order to reflect the probability that the enrichment of pathway genes not causes by random effects, we need to calculate the probability that a module can detect genes more than k genes.
We downloaded the KEGG pathway information from KEGG website, and summarized gene set information for each pathway. Using our pathway enrichment test model, we found that our co-expression modules have enriched a lot of KEGG pathways.
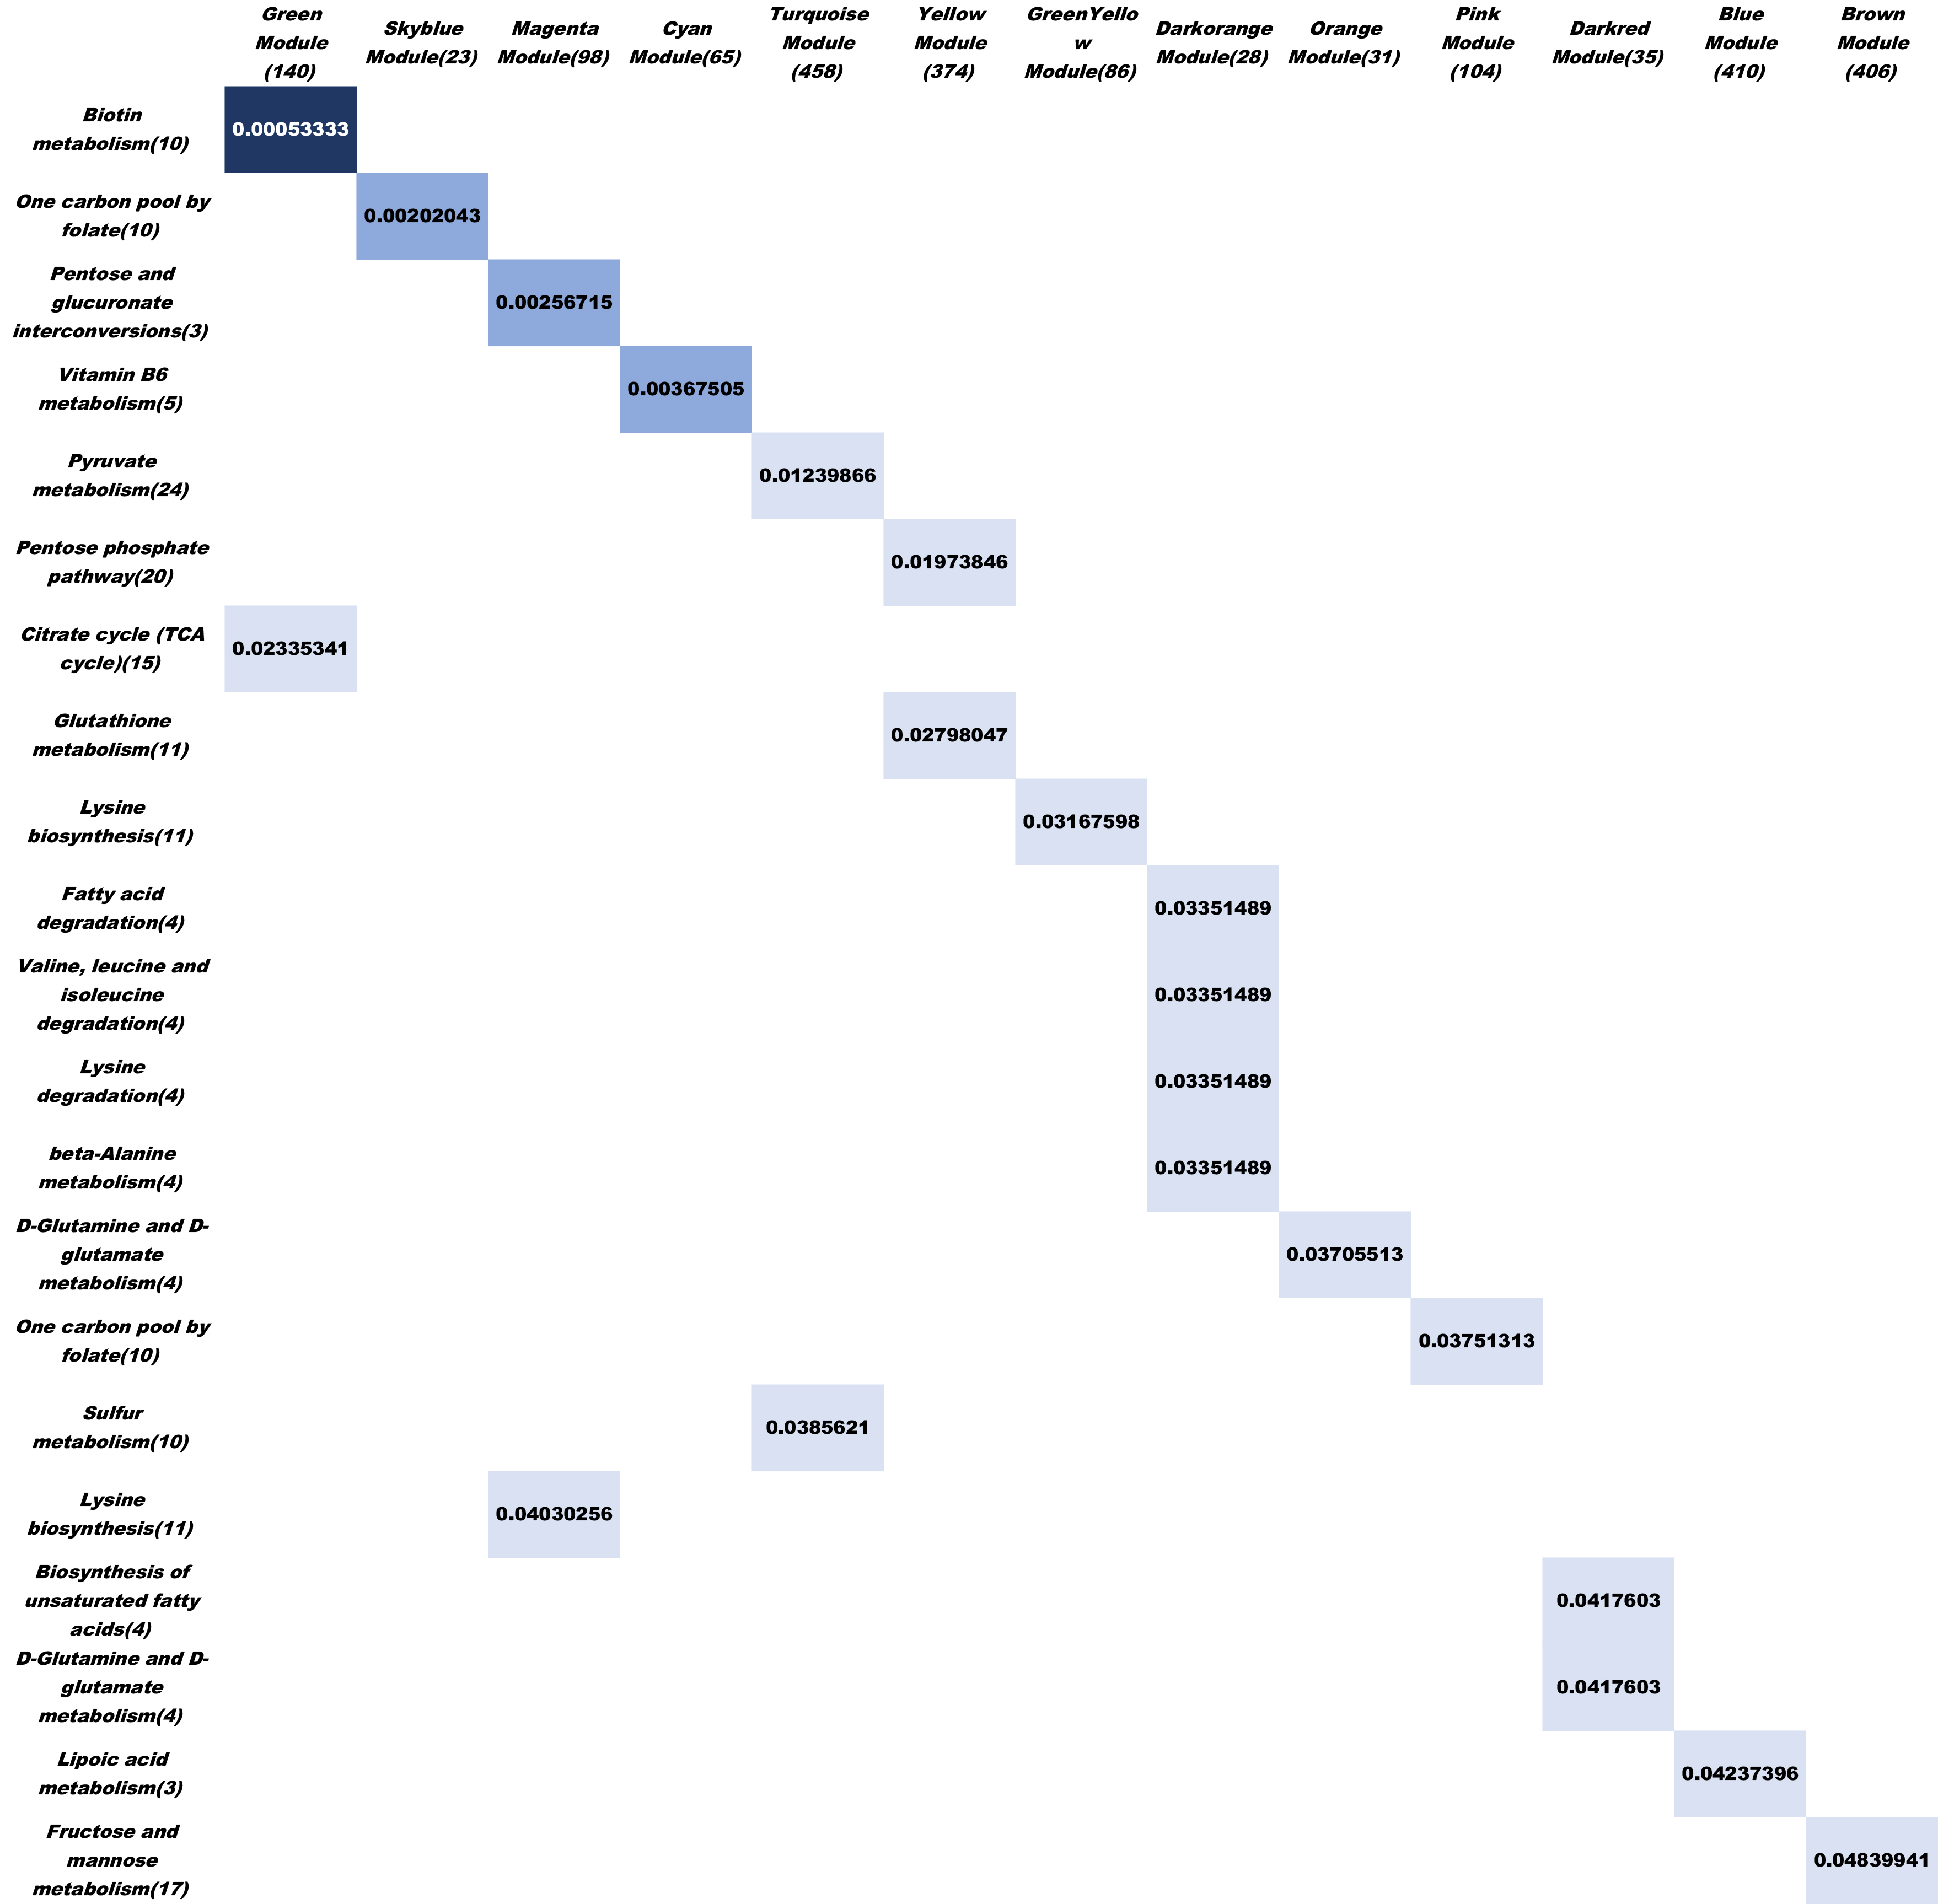
Figure6. The diagram of KEGG pathway enrichment test result, the column is our gene co-expression module, the row is KEGG pathway. We tested 24 KEGG functional pathway and found 21 KEGG pathway genes are enriched in specific co-expression module.(FDR< 0.05)
Gene importance measurement
As previous clustering step, we got a lot of co-expression modules and we wanted to measure the importance score of each gene
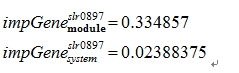
In genetic regulatory network, each node can measure its importance to the network through calculating its connectivity[11]. Motivated by it, we calculated two kinds of connectivity index to measure each gene importance to the functional module(genes in module) and global system(all genes) which defined as blow.For gene i, we have
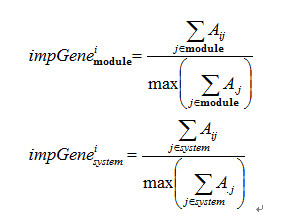
A is symmetric adjacency matrix defined by WGCNA[8]. Above indice can measure gene’s importance in co-expression module level and global system level.
Results and future work

Using HAWNA and PPIBoost(see PPIBoost page for more details), We can integrate transcriptome data, Go annotation data, protein sequence data and experimental data to derive regulatory network of gene-gene interaction and protein-protein interaction. We selected 4 genes to do crisper/cas9 knock-out experiment to prove our prediction. The details of calculation result as shown above. We also give the computational result of GeneNet[7], one thing needs to be noted that slr0977 present a high interaction score with slr0897(pvalue=8.40E-10, qval=9.50E-08, directionality is slr0977 to slr0897 with probability 0.99917) computed by GeneNet.
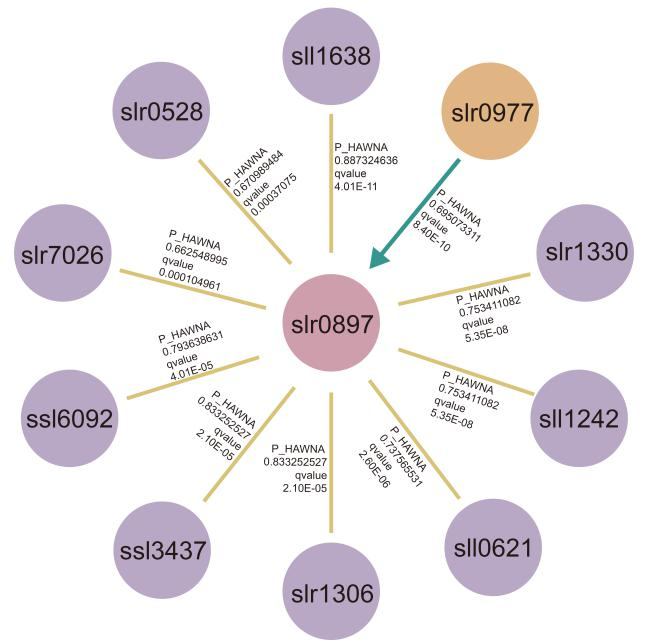
Figure7. The causal network relates to slr0897, we extracted top10 most significant positive interaction both predicted by HAWNA and GeneNet, and marked on the partial correlation coefficient of HAWNA(P_HAWNA), and corresponding qvalue. The ‘directionality’ is defined by GeneNet which used to represent ‘causality’, slr0977 is the only genes present ‘directionality’ with slr0897.
Our hope is that future iGEM teams will use our HAWNA framework to design their metabolic engineering, but also will build upon our theoretical framework for understanding the underly interactome of highly complex biological system.
For simulation report, click it and download text1
For WGCNA_analysis, click it and download text2
For HAWNA combined with GeneNet calculation result, click it and download slr0897Net
Reference:
[1] Csete M E, Doyle J C. Reverse engineering of biological complexity.[J]. Science, 2002, 295(5560):1664-1669.
[2] Jansen R, Yu H, Greenbaum D, et al. A Bayesian Networks Approach for Predicting Protein-Protein Interactions from Genomic Data[J]. Science, 2003, 302(5644):449-453.
[3] https://www.ncbi.nlm.nih.gov/geo/query/acc.cgi?acc=GSE111408
[4] https://en.wikipedia.org/wiki/Partial_correlation
[5] https://en.wikipedia.org/wiki/Curse_of_dimensionality
[6] Andrew R. Joyce, Bernhard Ø. Palsson. The model organism as a system: integrating 'omics' data sets[J]. Nature Reviews Molecular Cell Biology, 2006, 7(3):198-210.
[7] Rainer O R, Korbinian S. From correlation to causation networks: a simple approximate learning algorithm and its application to high-dimensional plant gene expression data[J]. Bmc Systems Biology, 2007, 1(1):37-37.
[8] Langfelder P, Horvath S. WGCNA: an R package for weighted correlation network analysis.[J]. Bmc Bioinformatics, 2008, 9(1):559.
[9] Plerou,V. et al. (2002) Random matrix approach to cross correlations in financial data.Phys. Rev. E Stat. Nonlin. Soft Matter Phys., 65, 066126
[10] Barabasi A L, Oltvai Z N. Network biology: understanding the cell's functional organization[J]. Nature reviews genetics, 2004, 5(2): 101.
[11] Barabási A L, Gulbahce N, Loscalzo J. Network medicine: a network-based approach to human disease[J]. Nature reviews genetics, 2011, 12(1): 56.
School's name:SCAU
Member's name:SCAU
Designed by:SCAU