Our model is mainly composed of two parts: the first part is the biological part, and the first part is the Michaelis-Menten equation model, which is used to describe the relationship between the starting speed of enzymatic reaction and the substrate concentration, and then the negative feedback model of HucR-hucO-Uric Acid
gene, which is used to describe the regulation of Uric Acid on the negative feedback model. The second part is a one - chamber model of the variation of uric acid oxidase concentration over time with single dose and multiple doses. According to the knowledge of pharmacology, the intensity of drug action is proportional to its concentration. When taking single and periodic drugs, we can characterize the action strength of uric acid oxidase by the concentration of uric acid oxidase in blood.
Team:DLUT China/Model
Model
A The Michaelis-Menten equation model of uric acid oxidase:
In order to represent the relationship between the initial velocity of an enzymatic reaction and the substrate concentration, we chose the mistral equation to represent such a quantitative relationship
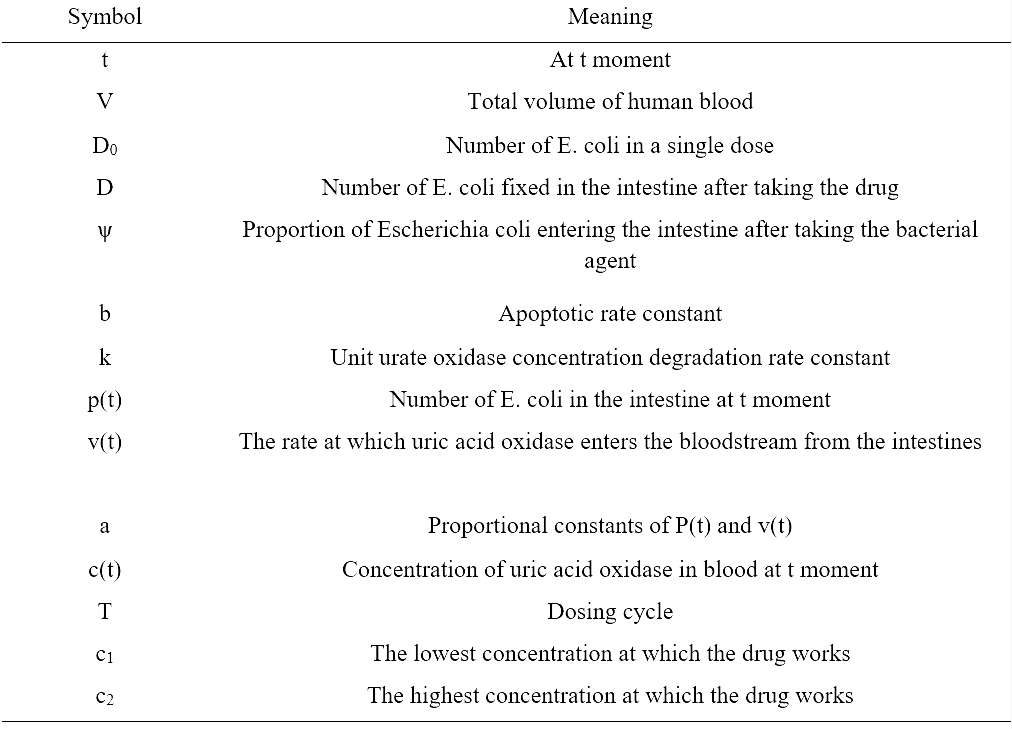
Symbol description
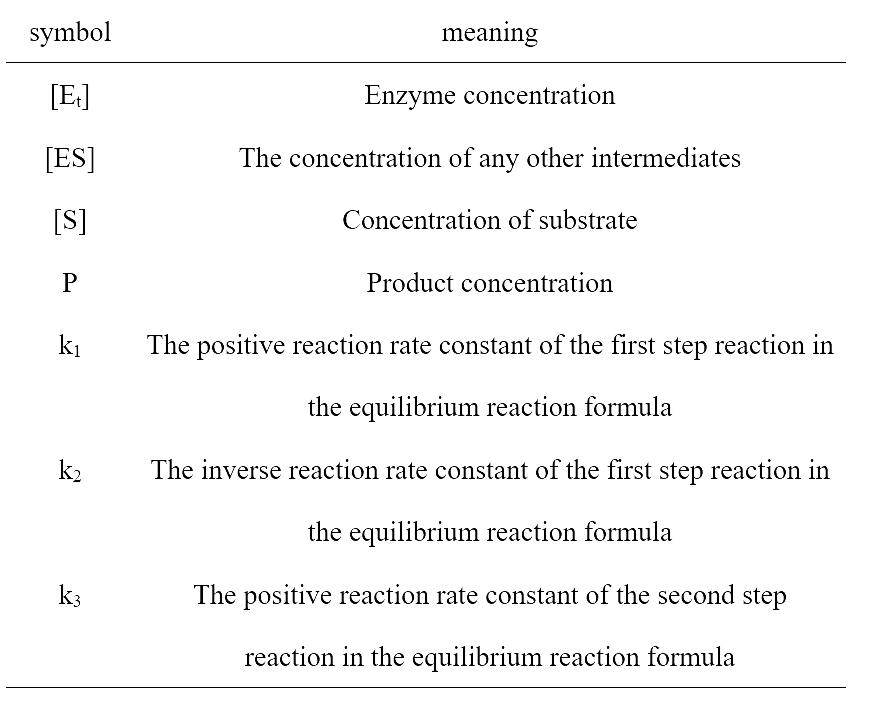
Our chemical reaction equation can be written as:
 (1)
(1)
 (2)
(2)
Thus, we can infer that: (3)
(3)
We assume that : (4)
(4)
So: (5)
(5)
The reaction rate after reaching equilibrium is: (6)
(6)
 (7)
(7)
The relationship between the rate of enzymatic reaction and the concentration of enzyme, substrate concentration and the mil constant of enzyme is given.
Symbol description
Our chemical reaction equation can be written as:
(1) (2)Thus, we can infer that:
(3)We assume that :
(4)So:
(5)The reaction rate after reaching equilibrium is:
(6) (7)The relationship between the rate of enzymatic reaction and the concentration of enzyme, substrate concentration and the mil constant of enzyme is given.
B Negative feedback model of genes:
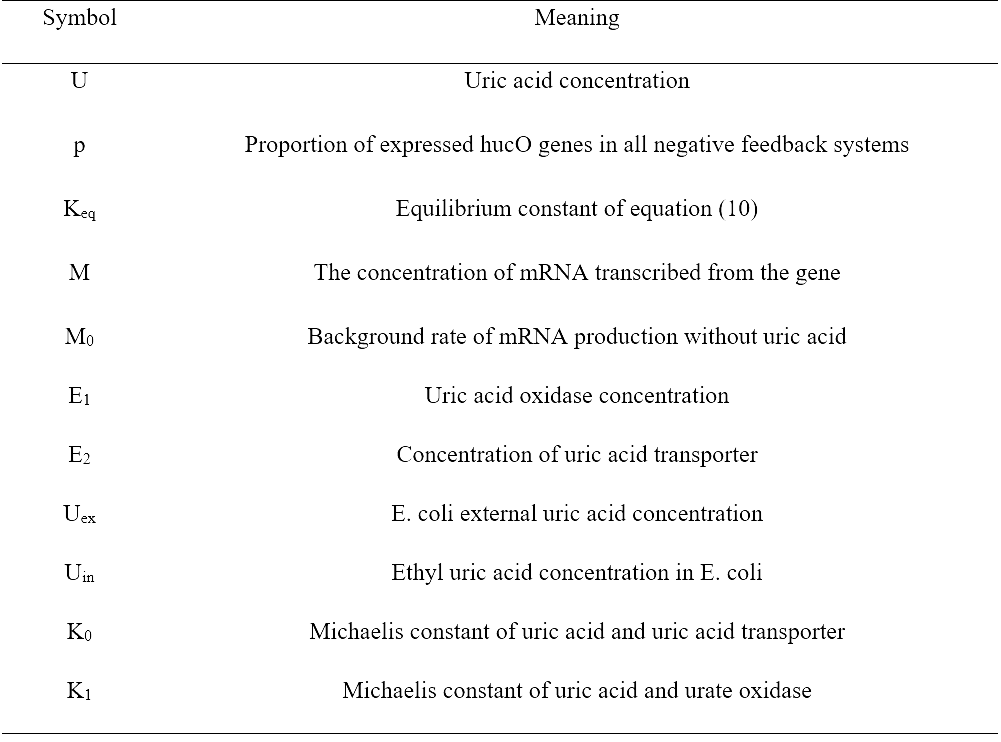
Symbol description

 (8)
(8) (9)
(9)However, when uric acid is present, HucR dimer will bind to uric acid to form stable complexes, and will not bind to hucO, so that related genes can be transcribed and translated normally. Inactive genes can also bind to uric acid to restore activity.
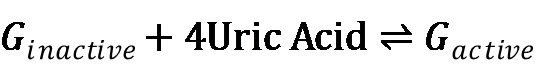 (10)
(10) (11)
(11) (12)
(12) (13)
(13) (14)
(14) (15)
(15)The increase of uric acid concentration from extracellular to intracellular is mediated by uric acid transporter protein, while the decomposition of uric acid depends on the uric acid oxidase. As can be seen from the mistral equation (7) derived from the first part:
 (16)
(16) (17)
(17)In pharmacology, the degree of action of the drug is directly proportional to the concentration of the drug in the blood, and the efficacy of the drug can be analyzed by measuring the concentration of uric acid oxidase in the blood.
We assume that the entire human body is treated as a central chamber, a part of the body's blood. Uric acid oxidase in the central chamber is uniformly distributed and ongoing and degradation, we can set the number of e. coli enters the body, the degradation rate constant, etc., according to the function of relationship between each variable, using the extremum and differential and so on many kinds of mathematical method and the MATLAB software to solve the model, calculated the medication and periodic medication for the first time in the blood uric acid oxidase a chamber model of change over time.
Symbol description
1. The central ventricular volume, or blood volume, remains unchanged.
2. The influence of individual differences on the model is not considered.
3. Before the first entry of uric acid oxidase into the central chamber, the blood drug concentration in the central chamber was zero.
4. Treat the whole body as a central chamber, considering only the variation of uric acid oxidase concentration in blood.
5. The degradation rate of uric acid oxidase is directly proportional to the concentration of urea oxidase in blood.
6. The rate of uric acid oxidase entering blood is directly proportional to the number of escherichia coli in the intestinal tract.
7. After taking a drink or medicine, the medicine is produced and immediately enters the blood and is distributed evenly.
8. Within a reasonable range of blood drug concentration, uric acid oxidase has no side effects on the body.
B Drug distribution model
We hypothesized that the number of escherichia coli taken was D, and the number of escherichia coli taken into the human intestinal tract was p(0), then there were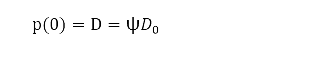 (18)
(18)
After entering the intestinal tract, escherichia coli will grow, reproduce and apoptosis. It is assumed that the number of escherichia coli satisfies the differential equation with the change of time:
 (19)
(19)
The equation (18) and (19) satisfy the initial value problem of the differential equation: The number of coliforms in the intestinal tract at time t was
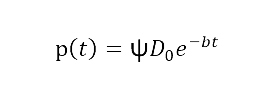 (20)
(20)
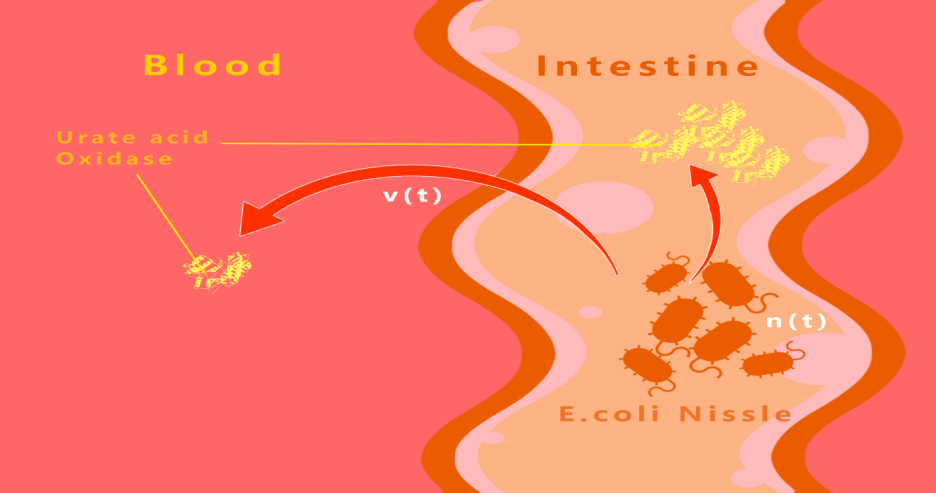
The rate of uric acid oxidase entering blood from the intestinal tract can be expressed as:
 (21)
(21)
Where, a is the proportional coefficient of p(t) and v(t), which is a normal number.
 (22)
(22)
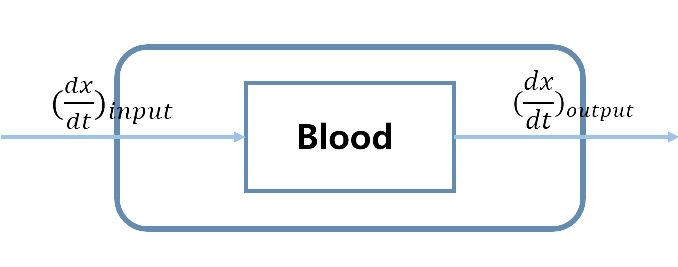
Since the degradation rate of the drug from the blood satisfies the first-order reaction kinetics, that is, the degradation rate is proportional to the total amount of drug in the blood at the moment, and the proportionality coefficient is k, then (dx/dt)output=k*x. The rate of entering blood is (dx/dt)input=v(t). Based on the hypothesis of the above compartment model, the change of the total amount of drugs in the center at any time in the body is satisfied:
 (23)
(23)
Since the blood volume is, divide both sides of the equation by V, and obtain the one-room model of blood drug concentration in the center at time t:
 (24)
(24)
By substituting equation (21), we can get:
 (25)
(25)
And the first time I gave it,
 (26)
(26)
So:
 (27)
(27)
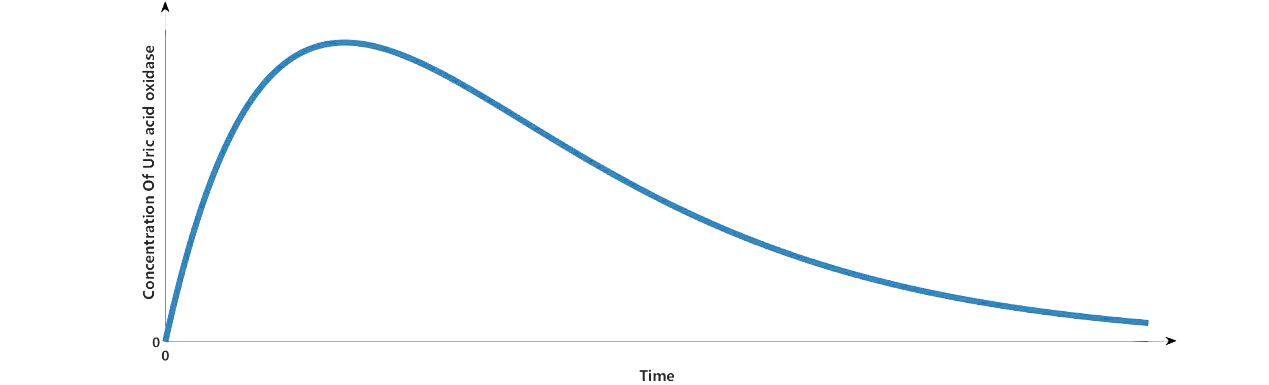
That is, the change of uric acid oxidase concentration in blood over time, using MATLAB to draw the image as shown in figure 3.
C. multidose administration kinetics
Assuming that multidose function is:
 (28)
(28)
In the time equation of blood drug concentration after single dose administration, each index is multiplied by the multi-dose function r, where the injection cycle is set to T2, and the time equation of blood drug concentration after repeated administration is obtained
 (29)
(29)
When, the blood drug concentration reaches a steady state, and the relationship between the blood drug concentration and time is
 (30)
(30)
If I take the derivative, I get (31)
(31)
The derivative method is used to find the extremum of steady state.
 (32)
(32)
Thus
 (33)
(33)
Since cmax is no more than or equal to c2, the range of values we can obtain can be used to determine the number of escherichia coli in the bacterial agent used to guide patients to take each drug.
Combined with the single drug administration formula (27), c(T)=c1, the time interval T can be obtained under the given D0, which can be used to guide the cycle of taking the bacteria.
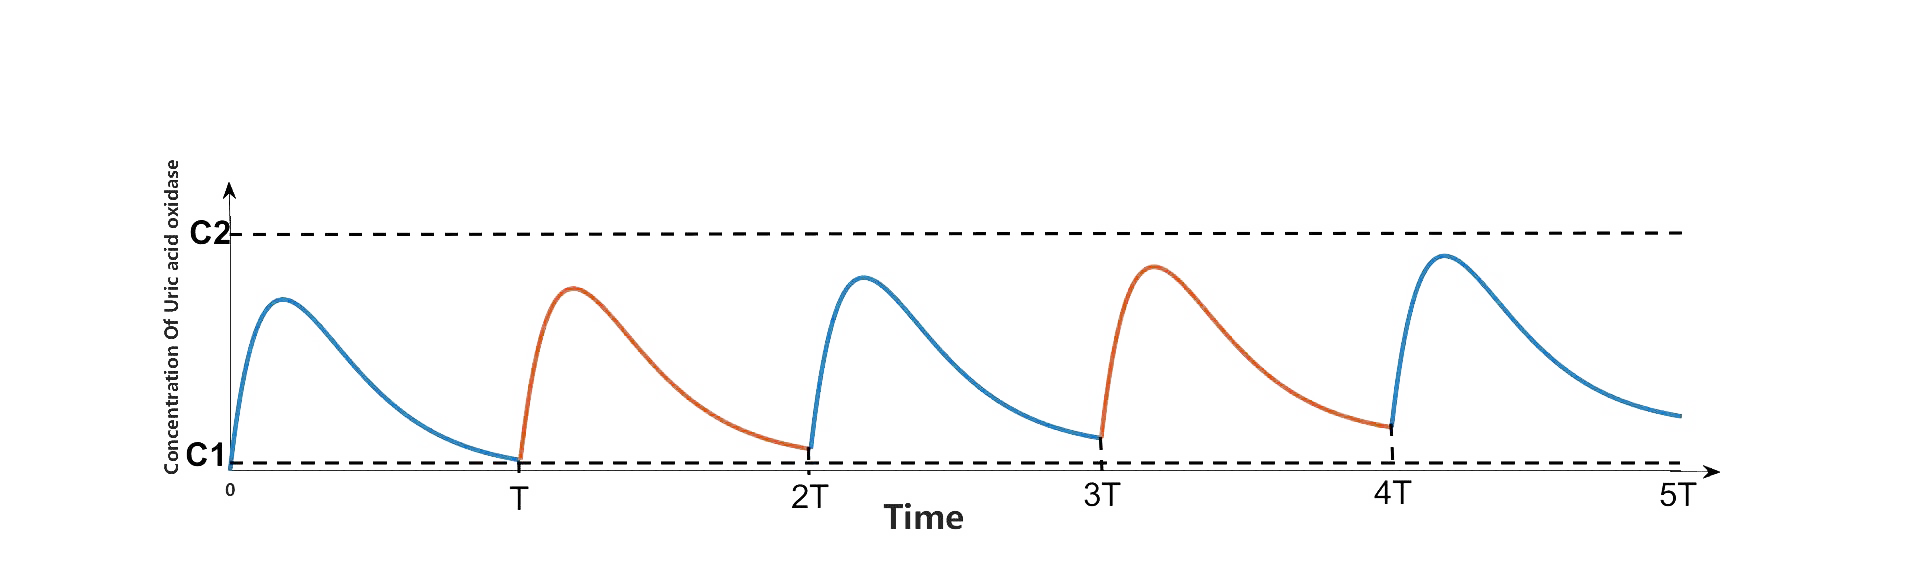
Finally, we make uric acid oxidase in five medication cycle concentration change over time c-t image, which, as shown, uric acid oxidase concentration in several cycle concentration is increased, but can reach the maximum concentration of uric acid oxidase less than c2, and taking inoculants, the concentration of uric acid oxidase just is equal to the lowest concentration uric acid oxidase play a role.
We assume that the entire human body is treated as a central chamber, a part of the body's blood. Uric acid oxidase in the central chamber is uniformly distributed and ongoing and degradation, we can set the number of e. coli enters the body, the degradation rate constant, etc., according to the function of relationship between each variable, using the extremum and differential and so on many kinds of mathematical method and the MATLAB software to solve the model, calculated the medication and periodic medication for the first time in the blood uric acid oxidase a chamber model of change over time.
Symbol description
1. The central ventricular volume, or blood volume, remains unchanged.
2. The influence of individual differences on the model is not considered.
3. Before the first entry of uric acid oxidase into the central chamber, the blood drug concentration in the central chamber was zero.
4. Treat the whole body as a central chamber, considering only the variation of uric acid oxidase concentration in blood.
5. The degradation rate of uric acid oxidase is directly proportional to the concentration of urea oxidase in blood.
6. The rate of uric acid oxidase entering blood is directly proportional to the number of escherichia coli in the intestinal tract.
7. After taking a drink or medicine, the medicine is produced and immediately enters the blood and is distributed evenly.
8. Within a reasonable range of blood drug concentration, uric acid oxidase has no side effects on the body.
B Drug distribution model
We hypothesized that the number of escherichia coli taken was D, and the number of escherichia coli taken into the human intestinal tract was p(0), then there were
(18)After entering the intestinal tract, escherichia coli will grow, reproduce and apoptosis. It is assumed that the number of escherichia coli satisfies the differential equation with the change of time:
(19)The equation (18) and (19) satisfy the initial value problem of the differential equation: The number of coliforms in the intestinal tract at time t was
(20)Figure 1 transport of uric acid oxidase produced by e. coli in the intestinal tract to the blood
The rate of uric acid oxidase entering blood from the intestinal tract can be expressed as:
(21)Where, a is the proportional coefficient of p(t) and v(t), which is a normal number.
Figure 2 Entry and degradation rate of uric acid oxidase in blood
(22)Since the degradation rate of the drug from the blood satisfies the first-order reaction kinetics, that is, the degradation rate is proportional to the total amount of drug in the blood at the moment, and the proportionality coefficient is k, then (dx/dt)output=k*x. The rate of entering blood is (dx/dt)input=v(t). Based on the hypothesis of the above compartment model, the change of the total amount of drugs in the center at any time in the body is satisfied:
(23)Since the blood volume is, divide both sides of the equation by V, and obtain the one-room model of blood drug concentration in the center at time t:
(24)By substituting equation (21), we can get:
(25)And the first time I gave it,
(26)So:
(27)That is, the change of uric acid oxidase concentration in blood over time, using MATLAB to draw the image as shown in figure 3.
Figure 3 c-t image of the change of uric acid oxidase concentration with time under single dose administration
C. multidose administration kinetics
Assuming that multidose function is:
(28)
In the time equation of blood drug concentration after single dose administration, each index is multiplied by the multi-dose function r, where the injection cycle is set to T2, and the time equation of blood drug concentration after repeated administration is obtained
(29)
When, the blood drug concentration reaches a steady state, and the relationship between the blood drug concentration and time is
(30)
If I take the derivative, I get
(31)
The derivative method is used to find the extremum of steady state.
(32)
Thus
(33)
Since cmax is no more than or equal to c2, the range of values we can obtain can be used to determine the number of escherichia coli in the bacterial agent used to guide patients to take each drug.
Combined with the single drug administration formula (27), c(T)=c1, the time interval T can be obtained under the given D0, which can be used to guide the cycle of taking the bacteria.
Finally, we make uric acid oxidase in five medication cycle concentration change over time c-t image, which, as shown, uric acid oxidase concentration in several cycle concentration is increased, but can reach the maximum concentration of uric acid oxidase less than c2, and taking inoculants, the concentration of uric acid oxidase just is equal to the lowest concentration uric acid oxidase play a role.
Figure 4 c-t diagram of the change of uric acid oxidase concentration with time during cyclic administration
[1]Griffith, J. (1968) Mathematics of cellular control processes I. Negative feedback to one gene. J. Theor. Biol.20 (2), 202– 208