Team:Jilin China/Model/Curve Fitting
Switch Behavior Fitting
Model
-
Introduction
From our experiment, we got the raw data of thermosensors at different temperatures. However, using the original data merely, we could hardly measure the pure impact of temperature on our RNA-based thermosensors and describe its switch behavior. Therefore, we defined normalized fluorescence, which means a normalized activity of thermosensors, and introduced Statistical Postulate to describe the probability distribution of thermosensors’ states.According to our HP investigation, we also extracted several focused features which are most valued by potenital users. Furthermore, we built a model to describe the thermodynamics of them and obtained a continuous temperature-dependent curve.
The goal of this model was to answer the following questions:
How to eliminate the temperature effect of bacterial expression system?
How to describe the switch behavior of massive RNA molecules statistically?
How to fit a continuous temperature-dependent expression curve?
How to extract features of RNA-based theromosensors from the curve? -
Methodology
Data Normalization
Temperature dependence of global factors such as the survival rate of RNA or enzyme activity may contribute to the individual measurement. They should, however, affect all thermosensors in a similar function. Therefore, we focus on the relative difference in the thermosensor activities.[1]
To measure the relative difference of fluorescence expression, we used BBa_R0040, a device without sfGFP coding sequence, as our negative control (Neg.). Our positive control(Pos.),whose sequence predicted by the software will not form a stem-loop structure, expresses sfGFP continuously and its activity won't change sharply as temperature shifting.
$$Normalized\ Fluorescence={Fluorescence/Abs600_{(Device)}-Fluorescence/Abs600_{(Neg.)}\over{Fluorescence/Abs600_{(Pos.)}-{Fluorescence/Abs600_{(Neg.)}}}}$$(Fluorescence/Abs600 stands for the Fluorescence expression in each bacteria)
The value of Normalized Fluorescence reflects the ratio of pure RNA expression between thermosensors and PC group, giving us a relatively impartial value to measure the relative difference in the thermosensors activities.
Two-state Distribution follows from the Statistical Postulate
According to \(Liphardt\)'s work[2], we knew that each RNA-based thermosensor has two temperature-dependent states (Folded and Unfolded). When there are massive thermosensors in \(E.coli\), individual actors are behaving randomly and yet a clear pattern emerges statistically. We replaced the idea of a definite state by the idea of a definite probability distribution of states.[3]
At low temperatures all samples displayed as folding state with low expression level, whereas at high temperatures the expression level increased, which indicated the increasing statistical rate of unfolded thermosensors. This explains why each of our thermosensor only can be in two states(Folded and Unfolded), but the switch behavior of our system is a continuous function.
As the result, normalized fluorescence of our thermosensor system is a linear function of the fraction of unfolded thermosensors, which also represents the probability distribution that a system will be in a certain state.

Figure 2. Fractional Distribution of RNA-based thermosenser
Thermodynamics
We defined \(f_T\) as the function of the fraction of unfolded molecules(\(f\)) vs temperature(\(T\)) and defined melting temperature \(T_m\) as the temperature for which \(f{(T_m)}=0.5\). We can use the equation appropriate for monomolecular to calculate equilibrium constant.[4]
$$K_{eq}={f\over{1-f}}\qquad (1)$$The Van ’t Hoff equation is the equation revealing the relationship between the change in the equilibrium constant(\(K_{eq}\)) of a chemical reaction and the change in temperature(T). The Van 't Hoff equation between temperatures T1 and T2 is [5]
$${ln{K_1\over{K_2}}}=-{\triangle{H^\Theta}\over{R}}{({1\over{T_2}}-{1\over{T_1}})}\qquad (2)$$Where R is the ideal gas constant and \(\triangle{H^\Theta}\) is standard enthalpy change.
Logistic Regression
Logistic function is a common "S" shape (sigmoid curve), S-curve function that can be used to describe the probability distribution of a two-state system with equation[6]
$$f(x)={L\over{1+e^{k(x-x_0)}}}\qquad (3)$$
Figure 3. Standard logistic sigmoid functioni.e.L=1, k=1, \(x_0\)=0
Based on the melting temperature \(T_m\), we transform our equations (1)(2) into the form of logistic function. $$f(T)={1\over{1+e^{[-k({1\over T} -{1\over T_m})]}}}\qquad (4)$$ As the normalized fluorescence F(T) of our system is a linear function of fraction of unfolded molecules f(T)
$$F(T)=a\times{f(T)}+b\qquad (5)$$The final function of normalized fluorescence vs temperature is
$$f(T)={{a\over{1+e^{[-k({1\over T} -{1\over T_m})]}}}+b}\qquad (6)$$Where a, b, c are the parameters of the function.
Annotation of Parameters
From our function, we could analyze that
$$f(T)=0$$ $$F(T)=a\times0+b=b$$
when all thermosensors are folded,The value of its expression is the constant value b.
$$f(T)=1$$ $$F(T)=a\times1+b=a+b$$
When all thermosensors are unfolded,The value of its expression is the constant value a+b.
The value of k can be analogized to the Hill coefficient, for the first item of the Taylor expansion on \(ln{(1+x)}\) is \(1/x\). Our function can be changed into the form of Hill equation when doing an approximate treatment.
-
Results
Curve Fitting
We employed least square method to regress a temperature-dependent expression curve for each thermosensor. R-squared is used to measure fitting goodness and to reflect thermosensors’quality degree. An example of the curve is shown below.
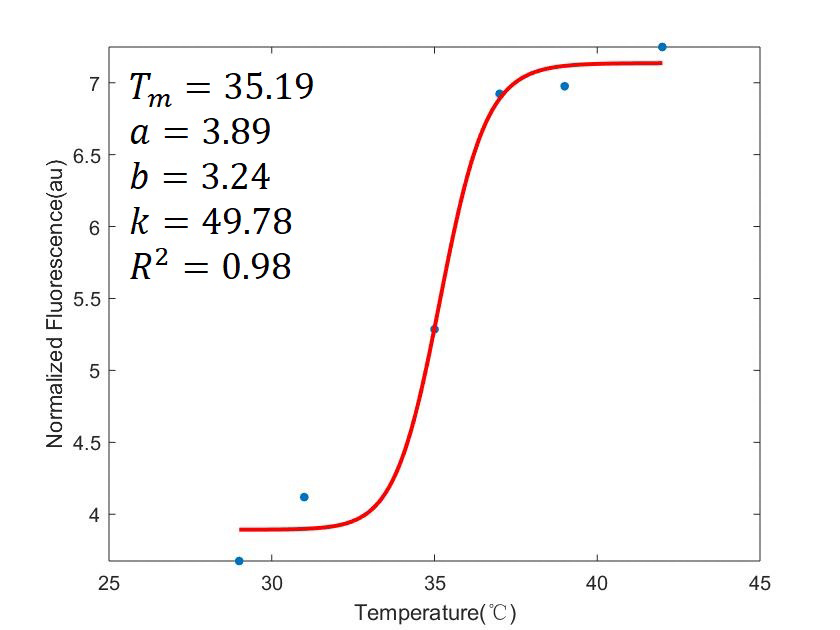
Figure 4. Fitting Curve of K25410039
The result of fitting goodness classification is used in our machine learning model RNA-based thermosensors Intelligent Screening System, which provided us an intelligent mean to screen sequences of desirable thermosensors. (Click here to see more)
Feature Extraction
After communicating with our HP group, we found several features of our thermosensors are vital in practice. We extracted the values of features from our expression curve and built a database to describe behaviors of each thermosensor.(Click here to our results)
The features include:
Melting Temperature \(T_m\): the temperature at which a 50% switch in expression occurs, with the value of \(T_m\)[7]
Sensitivity: the expression sensitivity to temperature, expression as the value of derivative of \(f(T)\) at \(T_m\)
Relative Intensity (M):the value of predicted normalized fluorescence when all RNA molecules are unfolded, with the value of a+b
Threshold (m): the value of predicted expression when all RNA are folded, with the value of b
Figure 5. Schematic diagram of features extraction
-
References
- [1] Sen S, Apurva D, Satija R, et al. Design of a Toolbox of RNA-based Thermometers[J]. Acs Synthetic Biology, 2017, 6(8).
- [2]Liphardt J, Onoa B, Smith S B, et al. Reversible unfolding of single RNA molecules by mechanical force.[J]. Science, 2001, 292(5517):733-737.
- [3] Nelson P C. Biological physics:energy, information, life[M]. W.H. Freeman and Co, 2004.
- [4] Mergny J L, Lacroix L. Analysis of thermal melting curves.[J]. Oligonucleotides, 2003, 13(6):515.
- [5] Ives, D. J. G. (1971). Chemical Thermodynamics. University Chemistry. Macdonald Technical and Scientific. ISBN 0-356-03736-3.
- [6] Vogels M, Zoeckler R, Stasiw D M, et al. P. F. Verhulst's “notice sur la loi que la populations suit dans son accroissement” from correspondence mathematique et physique. Ghent, vol. X, 1838[J]. Journal of Biological Physics, 1975, 3(4):183-192.
- [7]Sadler F W, Dodevski I, Sarkar C A. RNA Thermometers for the PURExpress System[J]. Acs Synthetic Biology, 2017, 7(1):292-296.