Team:VIT Vellore/Model


Where would you like to go?


Mathematical modelling gives us a better insight of our synthetic biology system. Using mathematical equations, it helps us analyse and reconstruct our system prior to performing the experiment practically. It predicts the responses of our biobricks and aids us in approaching the experiment in a well-informed and clear manner. Thus, before beginning our experimental work, we simulated a virtual model of our system using Matlab, in order to check the effectiveness of our proposed theory.
Purpose
Our model depicts how extracellular concentration of H+ ions in the
surrounding oceanic environment would alter the level of protein production in
our system. The main objective was to investigate how different concentrations of the
proteins are produced at different pH levels due to the activation and repression
of the respective promoters through a series of kinetic equations.
The main objective was to investigate how different concentrations of the
proteins are produced at different pH levels due to the activation and repression
of the respective promoters through a series of kinetic equations.
Method
The model predicted the performance of the pCadA and pNhaA promoters. It
also predicts the interactions between their protein products resulting in
activation or repression of these promoters.
We applied ordinary differential equations using Hills equation with already
existing parameters obtained from literature to estimate the effect of
extracellular pH on PNhaA and pcadA promoters.
Hills Equation
Hills equation helps measure the degree of interaction between a ligand and it
binding sites. We have used hills equation kinetics to model the regulatory
system of our engineered plasmid.

Parameter values
| VARIABLE | DESCRIPTION | VALUE | REFERENCE |
|---|---|---|---|
| αierA | Maximum Transcriptional Rate for lexA | 2.323 x 10⁻⁸ M sec-1 | Rabner et al., 2009 [1] |
| αrecA | Maximum Transcriptional Rate for recA | 2.79 x 10⁻⁷ M sec-1 | Rabner et al., 2009 [1] |
| αGFP | Maximum Transcriptional Rate for GFP | 0.05 mM min-1 | IGEM-IIT_DELHI,2013 [2] |
| βlexA | Repression Co-efficient for lexA | 0.333 mM | Marciano et al.,2016 [3] |
| βrecA | Repression Co-efficient for recA | 0.333 mM | Assumption |
| βGFP | Repression Co-efficient for GFP | 0.1 mM | IGEM-IIT_DELHI,2013 [2] |
| n1 | Co-operativity constant for pcadA and H+ | 0.4 | Assumption |
| n2 | Co-operativity constant for nhaA and H+ | 0.4 | Assumption |
Our Genetic Circuit

Response of promoters in varying pH
pNhaA and pCadA promoters are pH sensitive. Hence, we simulated models depicting the responses of the pCadA and pNhaA promoters at varying extracellular pH levels applying Hills equation with the parameters taken from literature(Refer Table 1).
pNhaA promoter behaviour
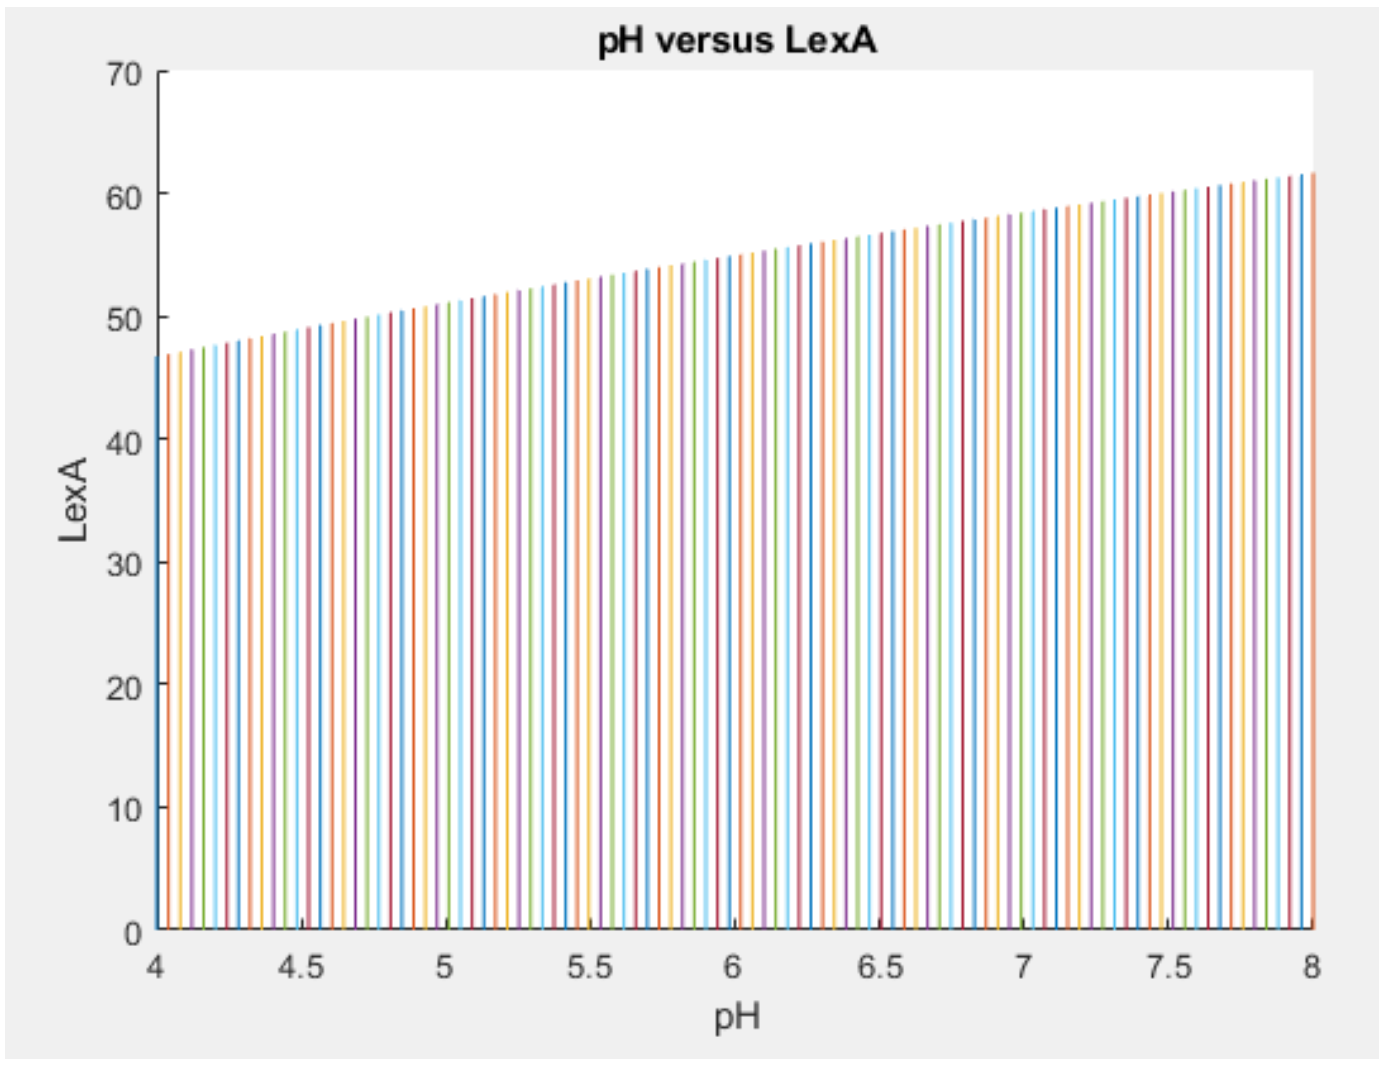
Here, the expression of lexA protein increases with increasing pH. This is in accordance with our proposed model.
pCadA promoter behaviour

Here, we can clearly see that the pCadA expression shown by the reporter decreases with increase in pH, which is also in accordance with our proposed model.
References
[1]Rabner, A., Martinez, E., Pedhazur, R., Elad, T., Belkin, S., & Shacham, Y. (2009). Mathematical Modeling of a Bioluminescent E. Coli Based Biosensor. Nonlinear Analysis: Modelling and Control, 14(4), 505–529.
[2] iGEM 2013 IIT_DELHI
[3] Marciano, David C. et al. “Cooperativity of Negative Autoregulation Confers Increased Mutational Robustness.” Physical review letters 116.25 (2016): 258104. PMC. Web. 16 Oct. 2018. http://www.jbc.org/content/271/39/23865.long
[4]Harmon, F. G., Rehrauer, W. M., & Kowalczykowski, S. C. (1996). Interaction of Escherichia coli RecA Protein with LexA Repressor. The Journal of Biological Chemistry, 271(39), 23865–23873. https://doi.org/10.1074/jbc.271.39.23874
[5]iGEM 2015 (UChile-OpenBio)
[6]Lechner M, Schwarz M, Opitz M, Frey E (2016) Hierarchical Post-transcriptional Regulation of Colicin E2 Expression in Escherichia coli. PLOS Computational Biology 12(12): e1005243. https://doi.org/10.1371/journal.pcbi.1005243