Difference between revisions of "Team:SMS Shenzhen/Results"
| Line 21: | Line 21: | ||
<div id="sec1"> | <div id="sec1"> | ||
<div id="page"> | <div id="page"> | ||
| − | < | + | <img src="https://static.igem.org/mediawiki/2018/5/51/T--SMS_Shenzhen--%E8%91%A1%E8%90%84%E7%B3%96%E6%A0%87%E5%87%86%E6%9B%B2%E7%BA%BF.PNG" > |
| − | <p> | + | <img src="https://static.igem.org/mediawiki/2018/c/cc/T--SMS_Shenzhen--Shiyan1.png" > |
| + | |||
| + | <h1>Analysis</h1> | ||
| + | <p style="font-size:18px"> The experiment 1 illustrates the relationship between the concentration of glucose and the absorbance of the solution with DNS colorant. By using linear regression, we constructed a function with glucose concentration (μmol) as the x-axis and the ab-sorbance as the y-axis. </p> | ||
| + | |||
| + | <p>In the experiment 2, we measured the stability of sucrose and dextran, as well as pH stability. We let the reaction take place in the hot pot set at 100℃. We observed that dextran has a poor hot stability. Moreover, the sucrose will decompose spontaneous-ly under the acidic condition while heat doesn’t affect the decomposition of sucrose. | ||
| + | </p> | ||
| + | |||
</div> | </div> | ||
</div> | </div> | ||
| Line 28: | Line 35: | ||
<div id="sec2"> | <div id="sec2"> | ||
<div id="page"> | <div id="page"> | ||
| − | + | <img src="https://static.igem.org/mediawiki/2018/0/02/T--SMS_Shenzhen--%E9%85%B6%E6%B4%BB%E5%9B%BE%E7%89%87.PNG" > | |
| + | |||
| + | <h1> Analysis</h1> | ||
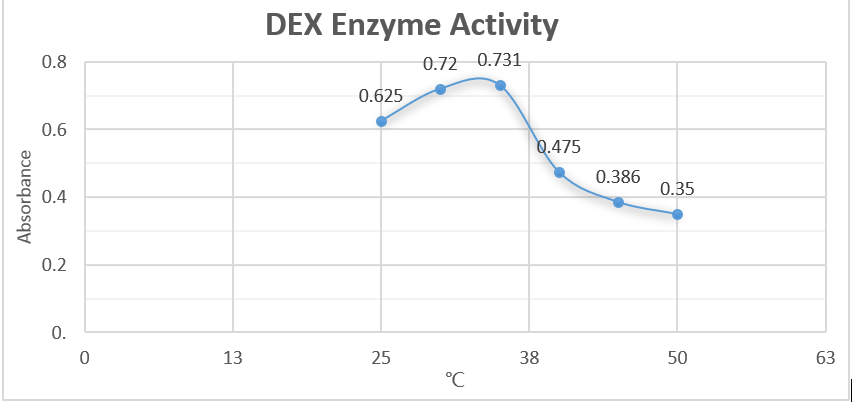
| + | <p style="font-size:18px"> From the first half of the graph, we can clearly discover the linear relationship be-tween enzyme concentration and the absorbance. Data suggest that as the concentra-tion of enzyme becomes greater, the relative absorbance increase proportionately. This result justified our assumption. However, the latter half illustrated a negative-related relationship. We suspected that we didn’t use enough substrate to allow the decomposition reaction. Also, we assumed that excessive concentration of enzymes will negatively affected the reaction rate.</p> | ||
| + | |||
</div> | </div> | ||
</div> | </div> | ||
| Line 39: | Line 50: | ||
</body> | </body> | ||
| − | <img src="https://static.igem.org/mediawiki/2018/5/55/T-- | + | <img src="https://static.igem.org/mediawiki/2018/5/55/T--SMS_Shenzhen--green.jpg" width="100%" > |
Revision as of 01:16, 18 October 2018


Experiment Data


Analysis
The experiment 1 illustrates the relationship between the concentration of glucose and the absorbance of the solution with DNS colorant. By using linear regression, we constructed a function with glucose concentration (μmol) as the x-axis and the ab-sorbance as the y-axis.
In the experiment 2, we measured the stability of sucrose and dextran, as well as pH stability. We let the reaction take place in the hot pot set at 100℃. We observed that dextran has a poor hot stability. Moreover, the sucrose will decompose spontaneous-ly under the acidic condition while heat doesn’t affect the decomposition of sucrose.
Analysis
From the first half of the graph, we can clearly discover the linear relationship be-tween enzyme concentration and the absorbance. Data suggest that as the concentra-tion of enzyme becomes greater, the relative absorbance increase proportionately. This result justified our assumption. However, the latter half illustrated a negative-related relationship. We suspected that we didn’t use enough substrate to allow the decomposition reaction. Also, we assumed that excessive concentration of enzymes will negatively affected the reaction rate.
